Holderness, T, Kennedy-Walker, R, Alderson, D et al. (1 more author) (2016) Crowd-Sourced Data for Geospatial Sanitation Planning in Informal Settlements.
International Journal of Complexity in Applied Science and Technology, 1 (1). pp. 22-34. ISSN 1740-0554
https://doi.org/10.1504/IJCAST.2016.081293
(c) 2016, Inderscience Publishers. This is an author produced version of a paper published in International Journal of Complexity in Applied Science and Technology. Uploaded in accordance with the publisher's self-archiving policy.
Reuse
Unless indicated otherwise, fulltext items are protected by copyright with all rights reserved. The copyright exception in section 29 of the Copyright, Designs and Patents Act 1988 allows the making of a single copy solely for the purpose of non-commercial research or private study within the limits of fair dealing. The publisher or other rights-holder may allow further reproduction and re-use of this version - refer to the White Rose Research Online record for this item. Where records identify the publisher as the copyright holder, users can verify any specific terms of use on the publisher’s website.
Takedown
If you consider content in White Rose Research Online to be in breach of UK law, please notify us by
Crowd-Sourced Data for Geospatial Sanitation Planning in
Informal Settlements
Tomas Holderness1*, Ruth Kennedy-Walker2, David Alderson2, Barbara Evans3
1SMART Infrastructure Facility, University of Wollongong, Australia
2School of Civil Engineering and Geosciences, Newcastle University, United Kingdom 3School of Civil Engineering, University of Leeds, United Kingdom
*Corresponding author: tomas@uow.edu.au
Keywords
Sanitation, Geographical Information System, Network Analysis
Abstract
Crowd-sourced geospatial data from OpenStreetMap and the Map Kibera project were used to model and optimise a proposed road-based sanitation network for the settlement of Kibera in Nairobi, Kenya. A Boolean multi-criteria suitability analysis was employed to identify areas of land for transfer station infrastructure construction. Selected locations were then used in a spatio-topological network model for a theoretical road-based faecal sludge management scheme to service 158 public toilets in Kibera using Vacutug technology. The network model was employed to further optimise the location of transfer stations based on minimising total sewage transport time across the network. In this manner the paper establishes the utility of maps generated by communities and citizens as providing vital on-the ground information for sanitation engineering planning. Such information is in lieu of traditional formal sources of geospatial data, which are often not available in informal settlements. The study demonstrates crowd-sourced maps, when combined with geographical information systems for analysis, present new opportunities for sanitation infrastructure provision planning in unplanned communities.
1 Introduction
In developing nations a lack of sanitation infrastructure results in significant risks to public health through the unsafe collection and treatment of sewage (United Nations, 2005; World Health Organisation 2012). Exposure and vulnerability to such risks are exacerbated in rapidly urbanizing and informal settlements, which have limited access to formal water and sanitation services (Isunju et al., 2011). It is estimated that only
half of Africa’s large cities have formal sewerage networks (Banerjee &
transportation of waste is conducted via the road network (Tilley et al., 2008). Furthermore, restricted road and footpath networks in informal settlements mean that motorized collection and emptying vehicles are unable to access homes and shared toilet facilities. As a result waste collection and transportation processes are often undertaken manually, increasing exposure and health risks to communities (Tilley et al., 2008).
One solution is the ‘Vacutug’ developed by the United Nations Habitat
program. The Vacutug is a small motorized vacuum pump truck designed to meet challenges of limited access to waste collection points in informal
settlements (O’Riordan 2011). Using Vacutugs as part of road-based fecal
sludge management schemes has been widely cited as a potential method of reducing the aforementioned risks of informal sewage collection
practices in developing nations (Tillet et al., 2008; O’Riordan 2011). The
viability of such a system has been proven through a number of successful
field trials (O’Riordan 2011; Chowdhry & Koné 2008). However, it has
also been highlighted that the success and scalability of sanitation solutions using Vacutugs are significantly limited by operational costs,
maintenance requirements, limited carrying capacity (0.5m3), and speed (5
Km/h) (Tilley et al., 2008; O’Riordan 2011).
A possible solution to decreasing costs is to reduce Vacutug transportation time by employing an intermediate transfer station for waste, located at the boundary of a settlement (Tilley et al., 2008). In this scenario Vacutugs only travel between collection point (e.g. toilet) and the transfer station where they deposit sewage in a holding tank. The holding tank is then periodically emptied by a large tanker truck that transports the waste across the main road network the remaining distance to the treatment plant
(Tilley et al., 2008; O’Riordan 2011).
non-existent, often because of the settlements’ ‘illegal’ status (Hagen 2010).
Crowd-sourced maps such as the OpenStreetMap project are created by community volunteers using GPS data, aerial photographs and existing paper maps (Haklay & Weber 2008). Data are generated and organized using open source geographical information systems and the underlying geospatial data is often released under an open license (Haklay & Weber 2008). As such, crowd-sourced maps have proved invaluable in areas where formal spatial data sources such as topographic surveys are limited. Crowd-sourced maps have been successfully used for community engagement (Hagen 2010), urban planning (Paar & Rekittke 2011), and disaster response (Zook et al., 2010). Crucially, the information provided by these maps is playing an increasingly important role in the lives and livelihoods of many inhabitants of developing cities world wide (Berdou 2011; Holderness 2014). In these regions crowd-sourced spatial data-sources have been cited as being more current, complete, and reliable the existing traditional formal sources of data (Hagen 2010; Zook et al., 2010). The Map Kibera project is an example of one such scheme where members of a developing urban community working within the OpenStreetMap framework created for the first time a free and open highly detailed map of the informal settlement of Kibera in Nairobi, Kenya. The data collected includes land cover, the road/footpath network, and the location of amenities such as water taps, toilets, and health clinics (Hagen 2010; Paar & Rekittke 2010; Berdou 2011;).
This paper investigates the viability of using crowd-sourced geospatial data within a geographical information system to develop models of road-based sanitation networks to support sanitation planning in the informal settlement of Kibera, Nairobi. To this end, data from OpenStreetMap and the MapKibera project were used to perform a two-step geospatial analysis; first, a Boolean multi-criteria suitability analysis of land cover was conducted to identify potential transfer station locations. Second, identified transfer station locations were integrated into a proposed road-based sewage treatment-transportation model designed to use Vacutug
technology to service Kibera’s communal toilets (Tilley et al., 2008;
O’Riordan et al., 2009). Spatio-topological network analysis was then
2 Materials and Methods
2.1 Study Area and Data
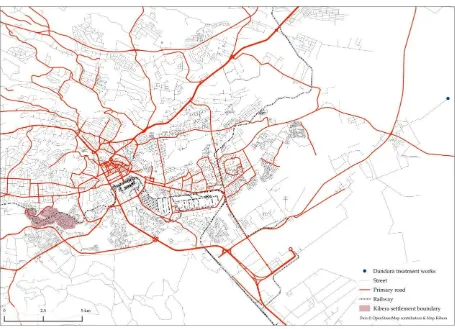
The informal settlement of Kibera is located approximately 5 Km to the south west of Nairobi, Kenya. Kibera has an estimated population of 200,000 residents, and is situated on a 550 acre site (Hagen 2010). Figure 1 shows the location of Kibera in relation to the city of Nairobi. The settlement contains limited formal sanitation provision, with little or no formal sewerage network (Binale 2011). Geospatial water and sanitation data were downloaded from the Map Kibera project and contained the locations of 158 public toilets that were used as collection nodes in the proposed road-based sanitation network. The Dandora treatment plant 20 Km east of Nairobi (see Figure 1) was selected as a potential end-point for
sewage from Kibera’s toilets and located using OpenStreetMap data
downloaded from “Metro Extracts” website (Migurski 2013). Dandora is a
lagoon-based plant with a daily treatment capacity of 80,000 m3 that is
discharged as partially treated effluent to the Nairobi river system (Engineering and Consulting Firms Association 2008).
In addition to the location of public toilets, geospatial vector data of the Kibera settlement boundary and internal footpath network were downloaded from the Map Kibera project. City-scale data for the road network and land cover in Nairobi, derived from OpenStreetMap, were also downloaded from the Metro Extracts website. To manage the required data layers a spatial database was constructed, forming the foundation of the geographical information system used for analysis. The spatial database was created using the PostGIS extension to the open source PostgreSQL relational database management system, and contained tables representing each of the aforementioned input data layers. The open
source “QGIS” desktop GIS package was subsequently used to support
analysis by visualising and interrogating layers within the database.
[Figure 1. About here]
2.2 Boolean Multi-Criteria Suitability Analysis of Transfer Stations
A Boolean multi-criteria suitability analysis was used to identify potential locations for transfer stations based on spatial parameters required for transfer station infrastructure as reported in the literature (Tilley et al.,
2008; O’Riordan 2009; Binale 2011). Boolean multi-criteria suitability
geospatial vector operations that test whether a location meets the specified criteria in a true/false manner (Malczewski 2006).
The analysis was conducted in four stages with each stage representing one spatial characteristic required for an area of land to be classified as suitable location, based on the spatial and topological relationships between the different layers of data (see Figure 2). Each level of analysis was performed using the information from OpenStreetMap and Map Kibera in the spatial database tables described above, principally the Kibera boundary, land cover in Nairobi, and the road network in Nairobi. Calculations were performed using spatial SQL, part of the PostGIS toolkit, to create a series of new tables representing locations identified as suitable for transfer station infrastructure.
Suitable land areas were selected if they met the following four conditions: (1) were within 5m of a road connected to both Kibera and Nairobi, (2) were within 50m of the settlement boundary, (3) were free from existing infrastructure development and, (4) had a total area of than 64 square metres or greater. Figure 2 shows the spatial analysis processes used to determine whether these conditions were met. The four processes are described in detail below using set theory notation to represent topological operations. Note that in this notation each data layer is represented as a unique set containing one or more individual polygon features, and for simplicity the individual point topology of polygon vertexes is not considered (Egenhoffer & Franzosa 1991; Worboys & Duckham 2004).
First, a Euclidean buffer is applied to the Nairobi road network and the settlement boundary at 5 and 50 metres respectively (see Figure 2). The output of this pre-processing step is two new polygon representations of
these areas . Areas of layer that fall outside form a new layer
representing roads outside of Kibera.
Eq. 1
Similarly, areas of the settlement boundary buffer outside existing
infrastructure development ( ) form new layer .
Thus, the intersection of and gives locations within specified distance for the road network, the settlement boundary, and free from existing infrastructure, satisfying conditions one, two and three.
Eq. 3
Lastly, polygons within L with land area of 64m2 or greater are identified
as suitable locations for transfer stations (see Figure 2), satisfying the fourth and final condition.
Eq. 4
The centroids of these areas were subsequently used to represent
transfer station nodes within the network model.
[Figure 2. About here]
2.2 Spatio-Topological Analysis of a Road-based Sanitation Network
Using the footpath network in Kibera and the surrounding road network
for Nairobi a spatio-topological network model connecting Kibera’s public
toilets to the Dandora treatment works was constructed. The footpath network interchanged to the road network at transfer stations as identified by the suitability analysis. Network edges were weighted by travel time,
based on each segment’s geometric length and speed; for the footpath
network speed was set to maximum Vacutug velocity 5 Km/h, and external road speeds 25 Km/h based on empirical measurements from the literature (Davis et al., 2005).
The spatio-topological model of the proposed road-based sanitation network was created using the spatial database schema and coupled Python interface to the NetworkX graph analysis package, developed by Newcastle University (Barr et al., 2012). The completed network consisted of 19,558 edges covering 4,686,483 Km of road and 16,347 nodes representing road junctions, toilets, transfer stations and the treatment plant. The network model was used to optimise transfer station location based on minimising total sewage transportation time from each of
Total sewage transport time was calculated in two stages (see Equation 5). First, the time taken to transport one full load of waste from each public toilet in Kibera ( ) to a transfer station ( ) using a Vacutug
travelling at 5 Km/h, via the shortest possible path ( ) was computed.
Second, this was added to the time taken to transport accumulated waste from a transfer station ( ) to the Dandora treatment works ( ) using a large
tanker travelling at 25 Km/h . For both calculations, the shortest path
between source and destination nodes was calculated using the Dijkstra algorithm. Iterating the calculation over each of the transfer stations in turn would reveal the transfer station that yielded the lowest total transport time (Equation 5).
min
Eq. 5
Equation 5 shows that the transportation time of large tanker trips is
weighted by the number of transfer stations multiplied by the ratio
between large tanker capacity and Vacutug capacity . This
accounts for the difference in sewage capacity between the two (large tanker: 10,000 litres, Vacutug: 500 litres). As a result only one large tanker trip is required from the transfer station for every 20 Vacutug trips between a toilet and transfer station, assuming that each transfer station capacity is equal to that of the large tanker. Thus, the total sewage transportation time via each transfer station is the time taken for a Vacutug journey from each of the 158 toilets in Kibera to the transfer station and the time for 7.9 large tanker trips required from the transfer station to the Dandora treatment plant.
3 Results
3.1 Transfer Station Location Suitability Analysis
The location of stations was determined primarily by the availability of land for development and suitable access to the Nairobi network for large tanker access. In relation to the Dandora treatment works, stations one and two have the shortest straight line distance (~25Km) compared to the other locations and are also closest to the majority of public toilets which are situated in south-eastern Kibera (see Figure 3). Interestingly, stations four, five and six are located on a road that bisects two segments of northwest Kibera. As such the road is represented by an internal boundary line in the settlement boundary data (not shown in Figure 3), meaning that these stations have the lowest distance to the nearest toilet as compared to any of the other 11 transfer stations.
[Figure 3. About here]
3.2 Spatio-Topological Network Optimisation of Transfer Station
Table 1 and Figure 3 show the total sewage transportation time for each station, and highlights that station three has the lowest total sewage transportation time of any station at 42.39 hours. The location of station three to the south of Kibera provides the best balance between proximity to all 158 public toilets and access to the Nairobi road network for transportation of waste to the Dandora treatment works. The total sewage transportation time from station three is 5.51 hours less than that of station 14, the next fastest route. Station 14 is similarly situated to station three in that it is towards the horizontal centre of the settlement, as opposed to extreme east and west positions of the other 12 stations (see Figure 3). Furthermore, total sewage transport time from station three is 13.34 hours less than station four, the least efficient station, which is situated at the western end of the settlement. This result highlights that station four is both furthest away from both the treatment works and the majority of
Kibera’s toilets, increasing travel time for both Vacutug and large tanker
journeys.
However, whilst station three exhibits the lowest overall sewage transport time the journey time from transfer station to treatment plant (large tanker journey time) is between 1.61 and 0.04 hours slower than the large tanker trip times for the next six fastest transfer stations (Table 1). These results suggest that Vacutug journey times have the greatest influence on overall sewage transportation time, and so optimum transfer station selection. This is supported by comparison of the standard deviation of Vacutug journey times from all stations in Table 1 ( = 3.03, x = 40.97 hours),
= 9.92 hours). The variance of large tanker journey times can be explained
by the topology of Nairobi’s road network, which due to a lack of ring
roads which often forces vehicles to traverse the city through the central business district (Gonzales et al., 2010) (see Figure 3). This results in a convergence of possible shortest path routes from each transfer station to the Dandora treatment works, minimising the differences in large tanker journey times. Transfer station ∑ Vacutug time (hours) Large tanker time (hours) Total sewage transport time (hours)
3 32.32 10.07 42.39
14 37.99 9.91 47.90
13 39.73 9.92 49.64
11 40.21 9.97 50.18
10 40.43 9.99 50.41
9 40.56 10.00 50.56
8 40.79 10.03 50.82
7 41.55 10.13 51.69
12 41.69 10.04 51.73
1 43.09 8.96 52.05
6 42.34 10.19 52.52
2 43.97 9.08 53.05
5 43.53 10.26 53.79
4 45.37 10.36 55.73
Table 1. Sewage transportation time for each transfer station
4 Conclusions
settlement periphery, which were deemed suitable for transfer station infrastructure. Second, using these locations a spatio-topological network model was constructed to model the transportation of waste from 158 public toilets within Kibera to the Dandora treatment works via each transfer station. Transfer station location was evaluated by total sewage transportation time and showed that intra-settlement travel time via Vacutug between toilet and transfer station was the critical factor in total transportation time.
However, while the results validated the effectiveness of geographical information systems combined analysis these approaches only provide a hypothetical model and still required further on the ground information if they are to inform communities and decision makers. For example, the OpenStreetMap data does not capture information on land ownership or availability, or include private household toilets, both of which may alter suitability of identified transfer station locations. While such factors could be integrated into the suitability analysis there are also a number of other non-technocratic factors such as community willingness to implement such a system and infrastructure costs that need to be accounted for and should be investigated in future research.
Notation
Eq. 1 - 4
Nairobi road network
Kibera settlement boundary
Nairobi land cover
Elements in buffered to 5m
Elements in buffered to 50m
Elements in outside
Elements in outside
Intersecting elements of and
Elements of with an area of 64m2 or greater
Eq. 5
tj is the minimum sewage travel time for station j where station j has
the lowest time of any station, using the single station model configuration
j is the transfer station node
i is the public toilet node
k is the treatment plant node
dij is the shortest path between toilet node i and transfer station j
weighted by time
djk is the shortest path between transfer station j and treatment plant k
weighted by time
in is the number of public toilets
cvt is the Vacutug capacity
References
Banerjee, S. G. and Morella, E. (2011) Africa's Water and Sanitation Infrastructure: Access, Affordability and Alternatives. The International Bank for Reconstruction and Development. Washington, DC, USA.
Barr, S., Holderness, T., Alderson, D., Robson, C., Ford, A. (2012) An Open Source Relational Database Schema and System for the Analysis of Large Scale Spatial Interdependent Infrastructure Networks. Proceedings
of the 4th Open Source GIS Conference, Nottingham, UK.
Berdou E. (2011) Mediating Voices and Communicating Realities. Using Information Crowdsourcing Tools, Open Data Initiatives and Digital Media to Support and Protect the Vulnerable and Marginalised. Vulnerability and Poverty Reduction Research Team, Institute of Development Studies, Brighton, UK.
Binale, A. (2011) Umande Trust Bio-Centre Approach in Slum
Upgrading. Les Cahiers d’Afriquede l’est, September: 167-186.
Chowdhry, S. and Koné, D. (2012) Business Analysis of Fecal Sludge Management: Emptying and Transportation Services in Africa and Asia - Draft final report. Bill and Melinda Gates Foundation, Seatlle, WA, USA.
Davis, N., Lents, J., Osses, M., Nikkila, N., and Barth, M. (2005) Part 3: Developing Countries: Development and Application of An International Vehicle Emissions Model. Transportation Research Record 1939(1): 155-165.
Egenhofer, M.J. and Franzosa, R.D. (1991) Point-set Topological Spatial
Relations’. International Journal of Geographical Information Systems, 5:
161-174.
Engineering and Consulting Firms Association (2008) Project Formulation Study on Nairobi Metropolitan Development Planning Project. Engineering and Consulting Firms Association, Tokyo, Japan.
Gastner, M. and Newman, M. (2006) The Spatial Structure of Networks.
The European Physical Journal B – Condensed Matter and Complex
Gonzales, E., Chavis, C., Li, Y., and Daganzo, C. (2011) Multimodal transport in Nairobi, Kenya: insights and recommendations with a macroscopic evidence based model. Proceedings of the Transportation
Research Board 90th Annial Meeting. Washington, DC, USA.
Hagen E. (2010) Putting Nairobi’s Slums on the Map. Development
Outreach, 12: 41-43.
Haklay, M., and Weber, P. (2008) OpenStreetMap: User-Generated Street Maps. Pervasive Computing, 7: 12-18.
Holderness, T. (2014) Geosocial Intelligence. IEEE Technology and Society Magazine, 33: 17-18.
Isunju, J. B., Schwartz, K., Schouten, M. A., Johnson, W. P. and van Dijk, M. P. (2011) Socio-economic aspects of improved sanitation in slums: A review. Public Health, 125(6): 368-376.
Malczewski, J. (2006) GIS based multicriteria decision analysis: a survey of the literature. International Journal of Geographical Information Science, 20(7), 703-726.
Migurski, M. (2013) “Metro Extracts”. Accessed on April 30, 2013.
http://metro.teczno.com/
O’Riordan, M. (2009) Investigation into Methods of Pit Latrine Emptying
– Management of Sludge Accumulation in VIP Latrines. Water Research
Commision (WRC), South Africa.
Paar, P. and Rekittke, J. (2011) Low-Cost Mapping and Publishing Methods for Landscape Architectural Analysis and Design in Slum-Upgrading Projects. Future Internet, 3: 228-247.
Tilley, E., Lüthi, C., Morel, A., Zurbrügg, C., and Schertenleib, R. (2008) Compendium of Sanitation Systems and Technologies. Swiss Federal Institute of Aquatic Science and Technology, Eawag, Dübendorf, Switzerland.
Worboys, M. and Duckham, M. (2004) GIS: A Computing Perspective, CRC Press.
World Health Organisation (2012) Progress on Drinking Water and Sanitation: 2012 Update. WHO/UNICEF Joint Monitoring Programme for Water Supply and Sanitation, USA.