ADJUSTABLE POWER MONITORING SYSTEM (APMS) FOR DAILY USAGE
MOHAMMAD ZULKHAIRI BIN BADRULHISHAM
This Report Is Submitted In Partial Fulfillment of the Requirements for the Award of Bachelor of Electronic Engineering (Industrial Engineering) With Honours
Faculty of Electronic and Computer Engineering Universiti Teknikal Malaysia Melaka
III
UNIVERSTI TEKNIKAL MALAYSIA MELAKA
FAKULTI KEJURUTERAAN ELEKTRONIK DAN KEJURUTERAAN KOMPUTER
BORANG PENGESAHAN STATUS LAPORAN
PROJEK SARJANA MUDA II
Tajuk Projek : ADJUSTABLE POWER MONITORING SYSTEM (APMS)
FOR DAILY USAGE
Sesi Pengajian :
1
Saya MOHAMMAD ZULKHAIRI BIN BADRULHISHAM
mengaku membenarkan Laporan Projek Sarjana Muda ini disimpan di Perpustakaan dengan syarat-syarat kegunaan seperti berikut:
1. Laporan adalah hakmilik Universiti Teknikal Malaysia Melaka.
2. Perpustakaan dibenarkan membuat salinan untuk tujuan pengajian sahaja.
3. Perpustakaan dibenarkan membuat salinan laporan ini sebagai bahan pertukaran antara institusi
pengajian tinggi.
4. Sila tandakan ( √ ) :
SULIT*
*(Mengandungi maklumat yang berdarjah keselamatan atau kepentingan Malaysia seperti yang termaktub di dalam AKTA RAHSIA RASMI 1972)
TERHAD**
**(Mengandungi maklumat terhad yang telah ditentukan oleh organisasi/badan di mana penyelidikan dijalankan)
TIDAK TERHAD
Disahkan oleh:
III
“I hereby declare that the work in this project is my own except for summaries and quotations which have been duly acknowledge.”
Signature : ...
IV
“I acknowledge that I have read this report and in my opinion this report is sufficient in term of scope and quality for the award of Bachelor of Electronic Engineering
(Industrial Electronics) with Honours.”
Signature : ...
V
VI
ACKNOWLEDGEMENT
VII
ABSTRACT
VIII
ABSTRAK
IX
CONTENTS
CHAPTER CASE PAGE
PROJECT TITLE I
DECLARATION III
SUPERVISOR AUTHENTICATION IV
DEDICATION V
ACKNOWLEDGEMENT VI
ABSTRACT VII
ABSTRAK VIII
CONTENTS IX
LIST OF TABLE XI
LIST OF FIGURE XII
LIST OF AMBREATIONS XIV
I INTRODUCTION
1.1 Introduction 1
1.2 Problem Statement 2
1.3 Objective of Project 3
1.4 Scope of Work 3
1.6 Significant of Study 4
1.7 Thesis Organization 4
II LITERATURE REVIEW 6
2.1 Previous Research on Energy Measurement 6 2.1.1 Power Line Communication Concept 2.1.2
Client Server Concept
2.1.3 Current and Voltage Sensor Concept 2.1.4 Energy Metering IC
7 9 11 13 2.2 Previous Design of Power Monitor 14
2.2.1 Kill-a-watt
2.2.2 The Energy Detective (TED) 14 15
2.3 Discussion 17
III METHODOLOGY 18
3.1 Project Flowchart 19
3.2 Hardware Development 20
X
3.2.2 Current Sensor 3.2.3 LCD Panel 3.2.4 Push Button
22 24 25
3.3 Design of Power Meter 26
3.3.1 Overview of overall circuit
3.3.2 Specification of Power Meter 26 27
3.4 Software Development 27
3.4.1 Program Code 27
IV RESULT AND DISCUSSION 32
4.1 Prototype of Power Meter
4.2 Experimental test on electric appliance 4.3 Accuracy analysis for power meter
32 35 39
V CONCLUSION AND RECOMMENDATION 42
5.1 Conclusion
5.2 Recommendation 42 43
XI
LIST OF TABLE
NO TITLE PAGE
1.1 New tariff of electricity 3
2.1 Specification of kill-a-watt meter 15
3.1 Specification of Arduino Uno 22
3.2 Specification of design power meter 27
4.1 Specification of test load 36
4.2 Tabulated value of power 36
4.3 Limitation value of electricity for each switch 37
4.4 Specification of energy monitor (D02A) 39
4.5 Comparison between measurement reference meter with APMS 39 4.6 Comparison between measurement reference meter with APMS 40 4.7 Comparison between measurement reference meter with APMS 40
XII
LIST OF FIGURES
NO TITLE PAGE
2.1 Overall block diagram of the system 8
2.2 Block diagram of measurement node module 10
2.3 Block diagram of central server module 10
2.4 Voltage Sensing Module 12
2.5 Current Sensing Module 12
2.6 Kill-a-watt meter 15
2.7 TED handheld device 16
3.1 The Project Flow Chart 19
3.2 Arduino Uno 22
3.3 SCT 013 000 current sensor 22
3.4 Connection of burden resistor 23
3.5 Interfacing current sensor with Arduino 24
3.6 Connection of LCD pin with Arduino 25
3.7 Connection between push button and Arduino 25
3.8 Schematic diagram of overall circuit 26
3.9 Flow chart of programming part 28
XIII
3.11 Mode selection of push button 30
3.12 Calculation for desire value 31
4.1 Setup of the current sensor with live wire 33
4.2 Complete power meter 34
4.3 Circuit inside the power meter 34
4.4 Display of serial monitor or Arduino IDE 35
4.5 Operate power meter 37
XIV
LIST OF AMBREVIATIONS
UTeM Universiti Teknikal Malaysia Melaka TNB Tenaga Nasional Berhad
PLC Power line communication
1
Chapter I
INTRODUCTION
1.1Introduction
Currently, much user are focused in how to reduce electricity consumption. Increasing in consumption of electricity is neither economical nor environmentally sustainable. Additionally, there is a growing consensus that environmental and economical sustainability are inextricably linked [1]. As the cost of electricity and power increases, we must find the solution to help reducing or at least optimize our energy use.
2
With recent technology, we will develop a device that will help consumer to monitor their usage of electricity in daily life. This work offers a simple solution to the growing power needs by raising the awareness of homeowners regarding how much individual household devices are consuming electricity [2]. With the aim to reduce the energy usage of the domestic devices, this project will produce a smart power meter which can display not only the total power, but also the electricity bill, so that the consumers can be more alert about the amount of energy being used in term of Ringgit Malaysia [4].
In the next section, we will have a view on problem statement, objective of project, scope of work, significant of study and how the thesis is organize.
1.2Problem statement
Nowadays, awareness of saving energy has been quite high due to the efforts taken by the government and the authorities in reaching the public. These phenomena had created a new path of business opportunity for tools and devices related to monitoring and saving energy.
3
Table 1.1 : New tariff for electricity [3]
TARIFF CATEGORY (for domestic usage) UNIT CURRENT RATE (1 JAN 2014) For the first 200 kWh (1-200 kWh) per month sen/kWh 21.80 For the first 200 kWh (201-300 kWh) per month sen/kWh 33.40 For the first 200 kWh (301-600 kWh) per month sen/kWh 51.60 For the first 200 kWh (601-900 kWh) per month sen/kWh 54.60
For the first 200 kWh (901 kWh onwards) per month
sen/kWh 57.10
The minimum monthly charge is RM 3.00
1.3 Objective of Project
The objectives of this project are as follows:
1. To develop a power meter for monitoring electricity for daily usage. 2. To analyse the overall performance of the project in term of efficiency and
accuracy.
1.4 Scope of Work
This project is in limited scope as follows: 1. Arduino Uno will be used in this project.
2. Only single phase system will be monitored in this project. 3. The unit of power used for this project is kWh.
4
1.6 Significant of Study
This project should be able to help user at home by minimizing their electricity usage by setting a limit for their everyday usage of power. Most residential consumer only received feedback on their energy use in the form of monthly bill. The utility in Malaysia only give one monthly reading for electricity use, which does not encourage consumers to examine their electricity usage pattern. With increasing in electricity tariff nowadays, this project can be applied as one of the solution for rising awareness in minimizing the usage of electricity. Also, with the increasing concept of smart home and automation, this project can be implemented to give an additional feature on smart home concept. User can monitor their everyday usage of electricity by referring to LCD panel and LEDs on power meter. If the electricity usage in a day is exceeding the limiting usage, the LED will light on. Thus, the user will know the status of electricity usage of their home.
1.7 Thesis Organization
This report consists of five chapters. The overall summary for each chapter are as follows.
Chapter 1 discuss briefly about the introduction of the project, which consists of project objective, problem statement, scope of work, significant of study and thesis organization.
Chapter 2 is about the review of the previous work which had been done by other researcher that may have some similarities. It include the study of power line communication concept, client server concept, current and voltage sensor concept, energy metering IC and previous design of power meter.
5
Chapter 4 discuss about the experiment results from the prototype. Accuracy analysis will be carried out in this chapter.
6
Chapter II
LITERATURE REVIEW
This chapter explains about the previous research on energy measurement. A brief explanation about the perspective and methods used in the previous research is presented in this chapter. A few types of power meter also presented in this chapter.
2.1 Previous Research on Energy Measurement
7
appliances. However, this method will only save some amount of electricity bill, not rising awareness towards consumers on how important to save electricity usage. In order to raise the awareness of pattern of energy usage, consumer need to know how much the energy that have been used by them every day. One of the method is by measuring the usage of electricity. In the next section, we will discuss the methods that have been used by other researchers to monitor the energy usage.
2.1.1 Power Line Communication Concept
Power Line Communication (PLC) is a communication technology that able to transmit data over existing power cables. This method used same power cables to power up an electronic device and to control/retrieve data from it in a half-duplex manner.PLC applied same concept in communication technology whereby a sender modulates the data to be sent, injects it onto medium, and the receiver de-modulates the data to read it. The major advantage of PLC is no extra cable is required since it used existed wiring. Other than that, all line- powered devices in PLC also can be controlled or monitored [6].
8
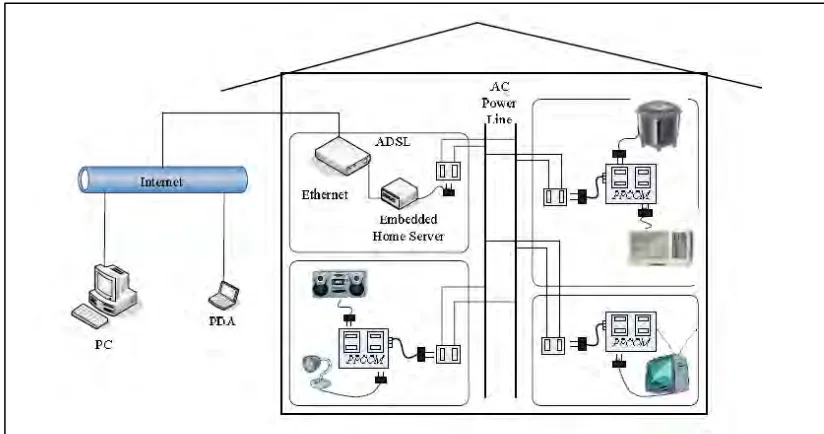
[image:22.595.112.524.101.318.2]
Figure 2.1: Overall block diagram of the system
Figure 2.1 shows an overview of the embedded system which consists of three parts: the PPCOM (PLC Power-Controlled Outlet Module), the embedded home server and the remote control. Any electric home appliance plugged into the socket of a PPCOM can be controlled and monitored without making any additional setting. The PLC and the asymmetric Digital Subscriber Line (ADSL) which has been selected for a wide area network have also been selected for the home network. By combining PLC and Ethernet technologies, PPCOM can connect to the embedded home server without any new additional wire lines.
9
technology. The operation of the proposed system is started with monitoring the energy consumption. This can be achieved by placing the monitor between the appliance and the power outlet. Then, data is sent through the power lines as soon as the server broadcasts a request, or being manually requested by the homeowner. Once the server has received the information, it will organize the information and display the data in its web-based interface for the homeowner to view. To verify the accuracy of the power analyzer module, several household light-bulbs were tested, mixing full length fluorescents, CFLs and LED types [2]. The test yielded a 100% success rate, which is expected since there are no other factors affecting the data that is sent.
2.1.2 Client Server Concept
Client Server concept is a two way communication between the provider of data, which is the server and the receiver of the data which is the client. This system requires client to request a data from server. When someone need a data, they will request to the server. After the data is acquired, the server will reply to the client. Chobot et al. proposed a system that can help users to have a better understanding about their electricity usage patterns and consequently adapt their behaviour to reduce their energy consumption and cost. This system has two major functions which are energy measurement module and remote power on/off control module. Figure 2.2 and 2.3 show the block diagram for both the measurement node module and remote power on/off control module [7].
10
Figure 2.2: Block diagram of measurement node module [7]
[image:24.595.118.526.469.591.2]Figure 2.3 shows the server displays the readings from these nodes through a user visual interface in real time. The remote power on/off control module is integrated with an actuator into each measurement node that will automatically turn on and turn off the power supply to the products.
Figure 2.3: Block diagram of central server module [7]
![Table 1.1 : New tariff for electricity [3]](https://thumb-us.123doks.com/thumbv2/123dok_us/75446.7115/17.595.108.529.129.328/table-new-tariff-electricity.webp)
![Figure 2.2: Block diagram of measurement node module [7]](https://thumb-us.123doks.com/thumbv2/123dok_us/75446.7115/24.595.115.507.69.302/figure-block-diagram-measurement-node-module.webp)
