This is a repository copy of Player Rating Systems for Balancing Human Computation
Games : Testing the Effect of Bipartiteness.
White Rose Research Online URL for this paper:
http://eprints.whiterose.ac.uk/100126/
Version: Published Version
Proceedings Paper:
Cooper, Seth, Deterding, Christoph Sebastian orcid.org/0000-0003-0033-2104 and
Tsapakos, Theo (2016) Player Rating Systems for Balancing Human Computation
Games : Testing the Effect of Bipartiteness. In: DIGRA/FDG '16 - Proceedings of the First
International Joint Conference of DIGRA AND FDG. DIGRA/FDG '16 - PROCEEDINGS
OF THE FIRST INTERNATIONAL JOINT CONFERENCE OF DIGRA AND FDG . DIGRA
Digital Games and Research Association , Dundee .
[email protected] https://eprints.whiterose.ac.uk/
Reuse
["licenses_typename_other" not defined]
Takedown
If you consider content in White Rose Research Online to be in breach of UK law, please notify us by
Player Rating Systems for Balancing Human
Computation Games: Testing the Effect of
Bipartiteness
Proceedings of 1stInternational Joint Conference of DiGRA and FDG
Seth Cooper
1, Sebastian Deterding
2, and Theo Tsapakos
11College of Computer and Information Science, Northeastern University
[email protected], [email protected]
2Digital Creativity Labs, University of York
[email protected] ABSTRACT
Human Computation Games (HCGs) aim to engage volunteers to solve information tasks, yet suffer from low sustained engagement themselves. One potential reason for this is lim-ited difficulty balance, as tasks difficulty is unknown and they cannot be freely changed. In this paper, we introduce the use of player rating systems forselecting and sequencing tasks
as an approach to difficulty balancing in HCGs and game genres facing similar challenges. We identify the bipartite structure of user-task graphs as a potential issue of our approach: users never directly match users, tasks never match tasks. We therefore test how well com-mon rating systems predict outcomes in bipartite versus non-bipartite chess data sets and log data of the HCGParadox. Results indicate that bipartiteness does not negatively im-pact prediction accuracy: common rating systems outperform baseline predictions in HCG data, supporting our approach’s viability. We outline limitations of our approach and future work.
Keywords
Human Computation Games, difficulty balancing, matchmaking, Elo, TrueSkill, Glicko, bipartite graphs
INTRODUCTION
Human computation games (HCGs) are an increasingly popular way of engaging poten-tially hundreds of thousands of volunteers in solving vast amounts of information tasks that cannot yet be computationally solved, such as identifying protein foldings (Foldit), classi-fying galaxies (GalaxyZoo), transcribing historical newspapers (DigitalKoot), or mapping neurons (Eyewire) (Pe-Than et al. 2015; Law and Ahn 2011).
time, and most contributions are very short in duration. The overwhelming majority of work (around 85 percent) is performed by a small (4-7 percent) minority of “superusers” that return multiple days and for long sessions (Sauermann and Franzoni 2015). Hence, to fulfill the promise of HCGs, their designers have to find ways of better engaging users—to motivate the current majority of short-one-time visitors to either stay longer or, ideally, to turn into repeat-long-visitors.
A core feature of engaging game design is a well-balanced difficulty curve, in which players are faced with challenges whose difficulty matches their growing skill (Csikszentmihalyi 1990; Sweetser and Wyeth 2005; Koster 2004). Unlike entertainment games, however, HCGs cannot create or modify challengesad libitumto optimize engagement; they have to work with the given information tasks of the scientific project. Additionally, the difficulty of these tasks is typically unknown in advance—an issue HCGs share with e.g. entertainment games with user-generated levels. We suggest this issue can be solved by estimating task difficulties and player skill to thenselect and sequencetasks from the task pool in an order that matches the user’s skill curve. In theory, multiplayer rating systems like Elo, Glicko, or TrueSkill could be adapted to estimate task difficulty and user skill in HCGs by treating both tasks and users as players. A major unresolved issue of this approach is the bipartite structure of the user-task graph in HCGs: users only ever “play against” tasks (and vice versa), which could easily result in insufficient flow of rating information through the graph, particularly when the graph is very sparse or unbalanced.
To assess the viability of our approach, we empirically tested the prediction accuracy of three common rating systems—Elo, Glicko, and TrueSkill—with two data sets. We tested bipartite versus non-bipartite and balanced versus unbalanced sub-samples of professional chess match data to see the effect of bipartiteness and balance with “standard” multiplayer data. Results indicate that bipartiteness has no effect on prediction performance, and that unbalancedness in some circumstances increases prediction quality, which appears to be connected to the existence of vertices with a high degree centrality. We also tested the systems with player data from the HCGParadox, finding that all three outperform a base-line prediction. We discuss possible explanations for the observed data, and conclude with outlining limitations, future work, and applications of our approach beyond HCGs.
BACKGROUND
Challenge, Engagement, and Difficulty Balancing
One fundamental mechanism of game engagement is challenge: the pursuit and mastery of non-trivial challenges stokes arousal, binds attention, and provides intrinsically motivat-ing experiences of competence (Klimmt and Hartmann 2006; Deterdmotivat-ing 2015). Largely grounded in Csikszentmihaly’s flow theory (1990), game designers and researchers concur that game challenges are particularly engaging because or when they are well-balanced over time: the difficulty of presented challenges grows with the skill of players, such that players are faced with neither boringly easy nor frustratingly hard ones. Optimum engagement or “flow” is found at a “happy” medium where difficulty matches player skill, requiring their total attention and effort (Csikszentmihalyi 1990; Sweetser and Wyeth 2005; Koster 2004).
En-geser and Rheinberg 2008; Lomas et al. 2013; Fullagar et al. 2013; Corem et al. 2013; Cechanowicz et al. 2014; Alexander et al. 2013; Denisova and Cairns 2015). However, studies also call into question the hypothesis thatoptimalengagement is found where player skill and task difficulty match – mathematically, where the odds of success or failure are 50/50. On average, players experience more enjoyment and stay longer the likelier they are to succeed (Rigby and Ryan 2007; Lomas et al. 2013). One large-scale experiment found that behavioral engagement (measured as number of trials times time on task) is highest at a success rate of about 90 percent (Lomas et al. 2013), suggesting that players seek out difficulty that is “just enough” to providesomesense of challenge (and hence competence) rather than difficulty that is “just barely” surmountable.
No matter what the exact point of optimum challenge, theory and evidence support that bal-ancing difficulty is important for making games engaging. And indeed, difficulty balbal-ancing is a core practice of game design. Broadly speaking, one can differentiate three approaches: (1)manual balancingthrough playtesting and revision of game levels and tasks pre-release; (2) providing game levels and tasks in multiple predetermineddifficulty settingsthat players choose from; (3)dynamic difficulty adjustment, where the game adjusts game parameters and content during gameplay to steer the game state toward a desired target (e.g. modulate enemy spawn rate to maintain a target player death probability) (Schell 2014; Michael and Chang 2013; Baldwin et al. 2013).
Constraints of difficulty balancing in HCGs and similar genres
If difficulty balancing is a proven approach to design balanced challenges, and well-balanced challenges are a key to game engagement, difficulty balancing should be a promis-ing strategy for improvpromis-ing engagement in HCGs as well. However, HCGs present several design constraints typically not found in entertainment games (see also Logas et al. 2014):
1. The information tasks that constitute the “levels” of HCGs are predetermined by the scientific data set or problem. They cannot be designed or discarded at will to improve engagement.
2. The difficulty of these tasks is usually unknown.
3. Tasks cannot be straightforwardly manipulated to optimize their difficulty, as this could quickly compromise the scientific validity of generated solutions.
4. Investing large amounts of human labor into identifying and manipulating the diffi-culty of individual tasks defeats the purpose of HCGs to cost-efficiently solve com-putationally unsolvable tasks through crowdsourcing.
Hence, the above-mentioned common approaches to difficulty balancing do not easily ap-ply to HCGs: manual balancing and difficulty settings are too human labor-intensive; and dynamic difficulty adjustment involves manipulating the actual tasks. Perhaps as a conse-quence of that, HCGs today by and large feature no difficulty adjustment. In fact, most of these constraints hold for user-generated-content-driven games such as theLittleBigPlanet
Solution: task sequencing through multiplayer matchmaking
While tasks themselves cannot be easily manipulated, there is one aspect of HCGs that can be balanced: the selection and sequencing of which tasks get presented to players in which order. Fundamentally, this form of difficulty balancing requires a mechanism that can (a) efficiently estimate task difficulty and user skill and (b) choose a task from a task pool that presents an optimally engaging challenge to the current user. Where tasks and task difficulty parameters exist in a well-formalized form and optimal solutions are known, approaches exist to potentially produce a well-balanced task sequence (see Butler et al. 2015 for one example). However, in such cases, human computation is by definition no longer needed as tasks can be computationally solved. And in most cases of HCG tasks, tasks are ill-formalized, difficulty parameters are ill-understood, and optimal solutions are unknown. Hence, if at all, systems have been using very rough heuristics like task size to arrange tasks in difficulty curves, resulting in suboptimal player experiences (Logas et al. 2014).
We suggest that multiplayer game matchmaking systems (Delalleau et al. 2012) provide an attractive template for the selection-and-sequencing balancing of HCGs. Matchmaking systems draw on ratings of player skill to identify players with roughly equal skill from a pool of currently active players and pair them into a balanced match. Match outcome data is then used to adjust the ratings of player skills. Most matchmaking systems today employ variants of one of three player rating systems: Elo, Glicko, and TrueSkill (Delalleau et al. 2012, see below). Matchmaking systems have been used outside of purely player-vs-player rating applications in some cases. Closely related to our work in this regard is the game
Jumpcraft (Snyder and Izquierdo 2014), which used TrueSkill to estimate the ratings of players and user-generated levels in a platforming game. The gameMatchin(Hacker and Ahn 2009) used Elo and TrueSkill to rate images to find the most preferred images in a set.
Formally, player matches in competitive multiplayer games and user task solutions in HCGs are highly analogous. Just as players in multiplayer tournaments and rankings engage in multiple matches, HCG users typically play multiple levels, and HCG levels are typically played multiple times, triangulating player solutions to control quality, generate aggregates, or collect multiple solutions for a problem with an unknown optimum (Pe-Than et al. 2015). These prior solution attempts are a readily available signal for both task difficulty and user skill, analogous to match outcomes in multiplayer games. If one equates both HCG users and tasks with players in multiplayer rating systems, one receives one unified skilland dif-ficulty measure for both at once: the rating score. Conveniently, all rating systems allow the calculation of winning odds of each side of the match based on the delta between their rating scores. And as we saw, winning odds are one quantitative measure of the balancedness of a challenge that has been shown to correlate with sustained player engagement (Lomas et al. 2013). In short, by using the information of prior solution attempts to give users and tasks skill/difficulty ratings, we should be able to achieve a desired engagement-optimal degree of challenge by presenting users with tasks whose rating score delta to the player’s rating score predicts the desired degree of success (e.g., a 90 percent chance of solving the task).
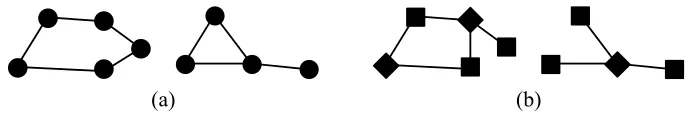
(a) (b)
Figure 1: Examples of (a) non-bipartite and (b) bipartite graphs. Vertices in the bipartite
graphs can be divided into two setsUandW (here indicated as diamonds and squares) such
that no edge connects two vertices in the same set.
never against a member of their own team.
In graph theoretical terms, if one models users and tasks as vertices and solution attempts or matches as edges between the vertices, HCG sessions present abipartite graph(Asratian et al. 1998): their vertices can be divided into two disjoint setsU andW such that every
edge connects a vertex inU with one inW. Examples are shown in Figure 1.
This raises the question whether existing rating systems, developed for non-bipartite player-match graphs, are equally capable to predict winning probabilities for bipartite ones. In non-bipartite player graphs, information about player skill (in the shape of match outcomes) flows more or less freely between vertices: three players A, B, and C may all inform and be informed by each other’s ratings through direct matches. In a bipartite player graph with players A and B in one setU and player C in setW, A and B can never directly inform each
other’s rating through matches, only indirectly through both consecutively matching C. In other terms, bipartite graphs limit the maximumdensityor proportion of actual to possible number of edges in the graph (Scott 2012). The lower the density of a graph, the higher the probability ofstructural holes: clusters of vertices and edges not linked to each other, resulting in incomplete information flow between vertices (Scott 2012). Another potential issue of bipartite graphs in particular isbalance(Asratian et al. 1998). A bipartite graph is balanced if its two vertex sets are of equal size. Given equal density, the more unbalanced a graph is, the less likely it is that a vertex in the larger set has more than one edge, meaning it never receives or sends more than one piece of rating information. We can assume that many HCGs have very unbalanced graphs, with tasks outnumbering players.
In summary, applying multiplayer rating systems to HCG users and tasks could be a promis-ing approach to difficulty balancpromis-ing in HCGs. However, it is unclear whether the bipartite nature of the user-task graph negatively affects the information flow between vertices and thus, the quality and predictive accuracy of the ratings. To answer this question, we em-pirically tested the predictive accuracy of popular rating systems against two relevant data sets.
METHOD
Rating systems
in a numerical Elo rating. If a player wins a match, their Elo rating increases, else it goes down—and more or less so depending on the skill of the other player. That is, the greater the delta between the Elo rating of both players, the more likely the stronger player will win, and the more a loss of the stronger player will increase the weaker player’s rating (and vice versa).
One problem with Elo is that it does not take into account how reliable player ratings are, that is, on how many and how recent matches they are based. In response, Glickman (1999) developed the likewise widely used Glicko and Glicko-2 systems, which include a “ratings deviation” expressing the uncertainty of the rating.
Finally, Herbrich et al. (2007) built on the ideas of Glicko to develop TrueSkill, a rating system that is notably used for player matchmaking on the Xbox Live online platform. Un-like Glicko, TrueSkill allows to compute player ratings in more than two-player and team matches.
Data Sets
For our analysis we used two data sets. The first stems from the Deloitte/FIDE Chess Rating Challenge, provided by Kaggle (2011). We chose this data set of professional chess matches for two reasons: first, multiplayer (chess) rankings are the original use case from which all three systems were developed. Hence, they should allow us to observe any effects of bipartiteness isolated from any potential unknown confounds of “non-standard” uses cases. Second, the chosen data set is large enough to allow us to extract similar bipartite and non-bipartite subgraphs for comparison. The full “primary training” data set covers a period of 132 months, and consists of 1,840,124 matches among 54,205 players. To simplify later processing, we removed all ties. To improve the number of matches per player in the data set, we removed players who only participated in a few matches, by retaining only matches between players who participated in 100 or more matches. This resulted in a data set of 262,648 matches among 5,321 players. In this data set, a match is between two players; an individual player may be either white or black in any given match. We will refer to this as the FIDE data set.
Our second data set stems from the HCGParadox, developed by the University of Wash-ington’s Center for Game Science (2015). The game is built around the concept of crowd-sourced formal verificationof software (Dean et al. 2015; Dietl et al. 2012): players are solving constraint problems that can contribute to a proof that a piece of software is free from certain classes of errors. Each level in the game is a system of constraints for the player to solve, cast as a puzzle involving changing the size of variables to satisfy those constraints. The player receives a score based on how many constraints they have satisfied. If the player can find a setting for the variables that satisfies all the constraints, they have solved the constraint system and proved a property about the underlying code. Since it may not be possible to satisfy all the constraints, puzzles have a target score that indicates the number of constraints that need to be satisfied for the player to complete the level.
We processed gameplay logs of the version of Paradox posted on the verigames.com
same set of constraints with a different target score a different level. Starting with non-tutorial levels, we found 5,671 matches among 348 players and 2,442 levels. We retained only matches between players who participated in 10 or more matches, resulting in 1,507 matches among 121 players and 70 levels. In this data set, a match is always between a player and a level. We will refer to this as theParadoxdata set.
In both cases, we took the first 95 percent of the matches to use as training data, and the last 5 percent as test data. Due to the ordering effects of playing (we expect that both chess and
Paradoxplayers improve over time), we preferred to test on data at the end of the data set rather than use a full cross-validation.
Graph Representation
We can model all the matches, players, and levels in the data sets as a graph; in general, a graphG = (V, E) consists of a set of verticesV and set of edgesE. In our case, the
vertices represent players/users or levels/tasks, and each edge represents a match between two players or a player/user and a level/task. A bipartite graph B = (U, W, E) consists
of set of edgesE and two disjoint sets of verticesU andW; each edge connects a vertex
fromU with one inW. There may be multiple edges between two vertices, representing
two players engaging in multiple matches or a user attempting a task multiple times. We represent bipartite graphs usingBand non-bipartite graphs usingN.
As noted, one graph property of interest is theaverage degreeof the graph,δ = 2||VE||. The
degreeof a vertex is its number of incident edges: in our case, the number of matches it is involved in. The average degree of the graph is the average number of matches players or levels take part in. More matches should give us a better estimate of the player’s skill or level’s difficulty. Thus, we would like to compare graphs that have the same average degree.
Another property of interest, which only applies to bipartite graphs, is howbalancedit is. A bipartite graph is said to be balanced if its two vertex sets are of equal sizes, that is,
|U|=|W|(Asratian et al. 1998). We generalize this to a notion ofhowbalanced a bipartite
graph is, by looking at what fraction of the vertices are in the smaller set:β = min(|U||U+||W,|W||).
A balanced graph would haveβ = 0.5; the closer β is to zero, the more “unbalanced” a
graph is. This is of interest as in an HCG, it is not necessarily the case that the number of players and levels will be the same, and therefore, we may have a very unbalanced graph.
Subgraph Construction
To examine matchmaking for prediction, we constructed many randomly-selectedtraining subgraphsfrom the training portion of the data sets, andtest subgraphsfrom the test portion. Subgraphs derived from training set are notated asGtr; subgraphs derived from the test set
asGte.
G
(a) (b) (c)
B N
[image:9.612.119.499.70.199.2](d) (e) (f) (g)
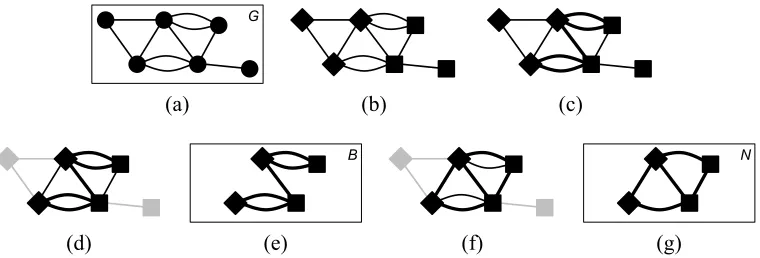
Figure 2: Subgraph Generation of desired edge count|E|. (a) Starting from an initial graph
G, (b) vertices are randomly partitioned into setsU (diamonds) andW (squares). (c) Up
to|E|edges betweenU andW are randomly selected (bold) and (d) vertices that are not
incident to any selected edges are discarded. (e) The selected edges and incident vertices are stored as a bipartite subgraphB. (f) A new set of edges is randomly selected (bold),
starting with edges that are incident to vertices that do not have any incident edges; (g) The newly selected edges and incident vertices are stored as a non-bipartite subgraphN.
Note that there is no guarantee that N is non-bipartite, or particularly different from B
(for example, one edge change change make a graph non-bipartite). However, in practice, all the subgraphsNwe constructed this way were bipartite. To construct the corresponding
test subgraphs, bipartite and non-bipartite edges that connect vertices that were not removed from the training subgraph are randomly selected from the test subgraph, starting with edges that are incident to vertices that do not have any incident edges.
same number of vertices and edges, and thus the same average degree, along with their corresponding test subgraphs (Bte andNte). By controlling the relative sizes ofU andW,
we controlled how balanced the constructed bipartite subgraph was. To examine graphs that are balanced differently, we constructed subgraphs atβ≈0.05andβ ≈0.50.
We used theParadoxdata set to examine prediction on a data set from a real HCG. Since this graph was already bipartite (between players and levels), we simply selected a random subset of matches to use from the training set (Ptr) along with the matches between the
corresponding vertices in the test data set (Pte).
ANALYSIS Prediction Error
We trained the rating systems by playing back all the matches in the training subgraph using a specified system, and then predicted the outcome of the matches in test subgraphs. As an error metric for prediction, we used the fraction of matches in the test subgraph that were predicted incorrectly, similar to Herbrich et al. (2007). We useerrM(X, Y)to represent
rating systemM, training on subgraphX, and predicting onY. Training systems include Elo,T S(TrueSkill), andGl2(Glicko-2). For baselines, we also useerrwh(•, Y)as always
predicting white; this method does not require training subgraphs.
We used our own implementation of Elo that initialized ratings to 1200 and usedK = 24.
implemen-Unbalanced Balanced Pre di ct ing Bi pa rti te 0.3 0.35 0.4 0.45 0.5 Pr e d ic ti on Er ror
FIDE Prediction Error on Bte (β≈ 0.05, δ≈ 5.3)
err
Elo(Btr, Bte) errElo(Ntr, Bte) errwh(¥, Bte)
0.3 0.35 0.4 0.45 0.5 Pr e d ic ti on Er ror
FIDE Prediction Error on Bte (β≈ 0.50, δ≈ 4.2)
err
Elo(Btr, Bte) errElo(Ntr, Bte) errwh(¥, Bte)
Pre di ct ing N on-bi pa rti te 0.3 0.35 0.4 0.45 0.5 Pr e d ic ti on Er ror
FIDE Prediction Error on Nte (β≈ 0.05, δ≈ 5.3)
err
Elo(Btr, Nte) errElo(Ntr, Nte) errwh(¥, Nte)
0.3 0.35 0.4 0.45 0.5 Pr e d ic ti on Er ror
FIDE Prediction Error on Nte (β≈ 0.50, δ≈ 4.2)
err
[image:10.612.114.494.68.349.2]Elo(Btr, Nte) errElo(Ntr, Nte) errwh(¥, Nte)
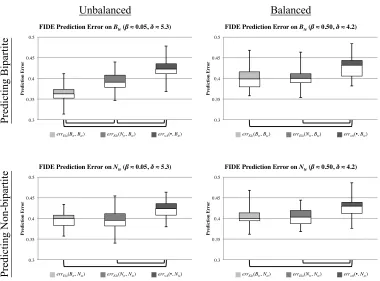
Figure 3: Prediction error on FIDE data set. Box plots show the minimum, first quartile,
median, third quartile, and maximum prediction errors. Lines under the plot show statisti-cally significant comparisons.
tations with their default initialization and update rules. We predicted the player with the higher rating would win a match.
To get a better idea of the general performance of each approach, for each graph, we con-structed 50 subgraphs and compared the prediction error of different approaches. Since prediction error was not normally distributed, for each set of comparisons we applied the Kruskal-Wallis test. For subsequent 2-way comparisons we applied the Wilcoxon Rank Sum test; here we applied the Bonferroni correction by multiplying observedp-values by
the number of pairwise comparisons within each set of comparisons. Lines underneath plots, if shown, give statistically signifigant comparisons (p < .05).
FIDE Prediction Error
Using the FIDE data set, we constructed 50 bipartite and 50 non-bipartite training subgraphs at bothβ = 0.05andβ = 0.50, all with10,000edges, and corresponding test subgraphs
of 500 edges. We then made predictions on both the resulting bipartite and non-bipartite test subgraphs. As a baseline, we chose always predicting white, as white won games more frequently in the data set. Prediction results on the FIDE data set are shown in Figure 3 and Table 1.
Pre di ct ing Bi pa rti te U nba la nc ed
FIDE Prediction Error onBte( ≈ 0.05, ≈ 5.3)
H(2) = 95.495 errElo(Btr, Bte) errElo(Ntr, Bte) errwh(•, Bte)
p < .001 M=0.36 M=0.39 M=0.42
errElo(Btr, Bte) U = 363.5, p < .001 U = 31.0, p < .001
errElo(Ntr, Bte) U= 330.5, p < .001
Ba
la
nc
ed
FIDE Prediction Error onBte( ≈ 0.50, ≈ 4.2)
H(2) = 33.097 errElo(Btr, Bte) errElo(Ntr, Bte) errwh(•, Bte)
p < .001 M=0.40 M=0.40 M=0.43
errElo(Btr, Bte) U = 1184.0, n.s. U= 531.0, p < .001
errElo(Ntr, Bte) U= 528.5, p < .001
Pre di ct ing N on-bi pa rti te U nba la nc ed
FIDE Prediction Error onNte( ≈ 0.05, ≈ 5.3)
H(2) = 38.356 errElo(Btr, Bte) errElo(Ntr, Bte) errwh(•, Bte)
p < .001 M=0.40 M=0.40 M=0.42
errElo(Btr, Bte) U = 1270.0, n.s. U= 455.5, p < .001
errElo(Ntr, Bte) U= 492.0, p < .001
Ba
la
nc
ed
FIDE Prediction Error onNte( ≈ 0.50, ≈ 4.2)
H(2) = 32.764 errElo(Btr, Bte) errElo(Ntr, Bte) errwh(•, Bte)
p < .001 M=0.40 M=0.40 M=0.43
errElo(Btr, Bte) U = 1185.0, n.s. U= 502.5, p < .001
[image:11.612.115.495.73.374.2]errElo(Ntr, Bte) U= 567.0, p < .001
Table 1:Prediction error using FIDE data set. Kruskal-Wallis test results top-left in corner;
Wilcoxon Rank Sum test results in individual entries.
between training on the bipartite and or non-bipartite subgraphs; this would indicate that a subgraph being bipartite did not have a detrimental effect on predictions (even when pre-dicting non-bipartite matches that could never have taken place). The exception is the case of predicting the bipartite test set with unbalanced subgraphs. In this case, the unbalanced bipartite subgraphs outperform the non-bipartite subgraphs.
0 200 400 600 800 1000 1200 1400 1600 1800
1 2 3-5 6-10 11-20 21-50 51-450
N
od
e C
ou
n
t
Node Degree
FIDE Node Degree Histogram
[image:12.612.162.455.80.192.2]Btr; β≈ 0.05 Btr; β≈ 0.50 Ntr; β≈ 0.05 Ntr; β≈ 0.50
Figure 4: Histogram of vertex degrees (matches for a player) from FIDE data set. The
median count is shown.
0.1 0.15 0.2 0.25
P
re
d
ic
ti
on
Er
ror
Paradox Prediction Error (β≈ 0.38, δ≈ 8.3)
err
Elo(Ptr, Pte) errGl2(Ptr, Pte) errTS (Ptr, Pte) errwh(¥, Pte)
Figure 5: Prediction error forParadox. Box plots show the minimum, first quartile,
me-dian, third quartile, and maximum prediction errors. Lines under the plot show statistically significant comparisons.
Paradox Prediction Error
Using theParadoxdata set, we constructed 50 bipartite training subgraphs with750matches
andβ≈0.38; corresponding test subgraphs had37edges. In this case, white is the player,
and black is level; there were relatively more levels than players. We compared the pre-diction performance of the Elo, Glicko-2, and TrueSkill systems. As a baseline, we chose always predicting white, as players were more likely to win than lose levels overall in the data set. Prediction results on test subgraphs are show in Figure 5 and Table 2.
All three trained prediction systems outperformed predicting white, improving median pre-diction error up to 25%, and both Glicko-2 and TrueSkill outperformed Elo (though neither outperformed the other).
[image:12.612.176.441.252.366.2]ParadoxPrediction Error ( ≈ 0.38, ≈ 8.3)
H(3) = 59.958 errElo(Ptr, Pte) errGl2(Ptr, Pte) errT S(Ptr, Pte) errwh(•, Pte)
p < .001 M=0.19 M=0.16 M=0.16 M=0.22
errElo(Ptr, Pte)
U = 1829.0 U= 1770.0 U = 728.0
p < .001 p= 0.001 p < .001
errGl2(Ptr, Pte)
U= 1241.0 U = 339.0
n.s. p < .001
errT S(Ptr, Pte)
U = 409.0
[image:13.612.124.488.79.186.2]p < .001
Table 2: Prediction error for Paradox. Kruskal-Wallis test results in top-left corner;
Wilcoxon Rank Sum test results in individual entries.
0 10 20 30 40 50 60
1001-1050 1051-1100 1101-1150 1151-1200 1201-1250 1251-1300 1301-1350 1351-1400 1401-1450
C
ou
n
t
Rating Paradox Elo Rating Histogram
Players Levels
Figure 6: Histogram of player and level Elo ratings. The median count is shown.
CONCLUSION
Contributions and Discussion
In this paper, we identified lacking difficulty balancing as one potential contributor to the low retention rates of HCGs, and outlined four design constraints that impede the use of standard difficulty balancing strategies for HCGs: HCGs (1) work with predetermined tasks (2) whose difficulty is unknown and (3) cannot be manipulated without risking the scientific validity of outcomes or creating artificial inefficiency; furthermore (4) manually identifying and balancing difficulty defeats the purpose of cost-efficiently crowdsourcing information tasks. We argued that a promising route for HCG difficulty balancing is computationally identifying task difficulty and user skill andselecting and sequencing tasksto fit user skills. We suggested that player rating systems used in multiplayer matchmaking can be plausibly used to identify user skill and task difficulty, drawing on existing user solution data.
[image:13.612.160.455.243.355.2]Finally, we tested the prediction accuracy of the three systems with a player data set from the HCGParadox. All three systems performed better than predicting that the user always “wins”, i.e. reaches the target score in each task, with TrueSkill and Glicko-2 outperforming Elo. This provides converging evidence for the viability of our approach, and suggests that the general advantages of TrueSkill and Glicko-2 hold in an HCG context.
In summary, our results suggest that applying standard player rating systems to HCG log data is a viable strategy for rating user skill and task difficulty, predicting task outcomes and thus, balancing difficulty in HCGs and user-generated-content-driven games.
Limitations and Future Work
One obvious limitation of our approach is that it relies on data from previous solution at-tempts. As we have seen, this is problematic for HCGs, where most users only engage once with few tasks (Sauermann and Franzoni 2015). To some extent, this might be an “empty bar problem” of reaching a critical mass: make the game engaging enough, and users will stay longer, generating more data which will help make the game more engaging. One par-tial solution is to have established “superusers” to play unplayed levels, relying on their investment in the game, and serve these once-played levels to novice players for verifica-tion. Another partial solution is to quickly assess user skill by exposing all users to a set of “calibration” levels where the true difficulty is known, e.g. during a tutorial phase. A final option is to computationally extract task features that correlate with existing user so-lution data and thus, task difficulty. In future work, we intend to triangulate soso-lution data, qualitative analyses of features that constitute the difficulty of tasks (following Cook 2007; Deterding 2015) and machine learning to extract and validate task features that indicate dif-ficulty. This way, our system would use two signals—solution data-based ratings and task features—to predict success probabilities for both played and unplayed tasks.
Second, the tested rating systems only compute win/loss, a very coarse outcome measure. In many HCGs, there are gradations of outcome quality, sometimes even with an unknown optimum. Paradoxis a case in point: for the purposes of this paper, we artificially reduced a scored degree of constraint solving into reaching or missing a target score. More granular outcomes should provide richer information about skill and difficulty. Hence, future work will explore how to modify rating systems to allow for gradations of outcomes.
Third, we trained the tested systems on relatively large data sets. Given that many HCG volunteers participate only once and for a short time, a crucial question for practical feasi-bility is how fast rating systems learn, that is: how many solution attempts per task and user do they need to produce acceptably accurate predictions?
A fourth limitation concerns the use of just one particular HCG, whose features are not representative of the variety of HCG types (Pe-Than et al. 2015). Future work will use existing typologies of HCGs to rerun tests with data sets across a representative sample of types.
needed, validating that HCGs employing the proposed balancing system result in higher player engagement.
Sixth and finally, a possible issue of balancing through task selection and sequencing is that a task pool at a given time doesn’t hold tasks of acceptable difficulty for a given player—for instance if task pools are unevenly distributed in many low and few high difficulty tasks. We suggest that in these instances, procedural content generation could be used to insert “bridging” tasks that both smooth the difficulty curve and prepare users for upcoming high difficulty tasks.
ACKNOWLEDGMENTS
We would like to thank the University of Washington’s Center for Game Science for the
Paradoxdata, and Alex Cho Snyder and Mario Izquierdo for their inspiration and feedback. This work was supported by a Northeastern University TIER 1 grant.
BIBLIOGRAPHY
Alexander, Justin T., John Sear, and Andreas Oikonomou. 2013. “An Investigation of the Effects of Game Difficulty on Player Enjoyment.”Entertainment Computing4, no. 1 (February): 53–62.
Asratian, Armen S., Tristan M. J. Denley, and Roland Häggkvist. 1998.Bipartite Graphs and Their Applications.New York, NY, USA: Cambridge University Press.
Baldwin, Alexander, Daniel Johnson, Peta Wyeth, and Penny Sweetser. 2013. “A Frame-work of Dynamic Difficulty Adjustment in Competitive Multiplayer Video Games.” In
2013 IEEE International Games Innovation Conference (IGIC),16–19.
Butler, Eric, Erik Andersen, Adam M. Smith, Sumit Gulwani, and Zoran Popović. 2015. “Automatic Game Progression Design Through Analysis of Solution Features.” In Pro-ceedings of the 33rd Annual ACM Conference on Human Factors in Computing Sys-tems,2407–2416. CHI ’15. Seoul, Republic of Korea: ACM.
Cechanowicz, Jared, Carl Gutwin, Scott Bateman, Regan L Mandryk, and Ian Stavness. 2014. “Improving Player Balancing in Racing Games.” InCHI Play’14,47–56. New York: ACM Press.
Center for Game Science. 2015.Paradox.[PC Computer, Online Game] Center for Game Science, Seattle USA.
Cook, Daniel. 2007.The Chemistry Of Game Design.http://www.gamasutra.com/
view/feature/1524/the_chemistry_of_game_design.php.
Corem, Yaniv, Naor Brown, and Jason Petralia. 2013. “Got Skillz? Player Matching, Mas-tery, and Engagement in Skill-Based Games.” InGamification’13,115–118. New York: ACM Press.
Dean, Drew, Sean Gaurino, Leonard Eusebi, Andrew Keplinger, Tim Pavlik, Ronald Watro, Aaron Cammarata, et al. 2015. “Lessons Learned in Game Development for Crowd-sourced Software Formal Verification.” In3GSE 15.Washington, D.C.: USENIX As-sociation.
Delalleau, Olivier, Emile Contal, Eric Thibodeau-Laufer, Raul Chandias Ferrari, Yoshua Bengio, and Frank Zhang. 2012. “Beyond Skill Rating: Advanced Matchmaking in Ghost Recon Online.” InIEEE Transactions on Computational Intelligence and AI in Games,4:167–177. 3.
Denisova, Alena, and Paul Cairns. 2015. “Adaptation in Digital Games: The Effect of Chal-lenge Adjustment on Player Performance and Experience.” InCHI Play 2015,97–101. New York: ACM Press.
Deterding, Sebastian. 2015. “The Lens of Intrinsic Skill Atoms: A Method for Gameful Design.”Human-Computer Interaction30 (3-4): 294–335.
Dietl, Werner, Stephanie Dietzel, Michael D. Ernst, Nathaniel Mote, Brian Walker, Seth Cooper, Timothy Pavlik, and Zoran Popović. 2012. “Verification Games: Making Ver-ification Fun.” InProceedings of the 14th Workshop on Formal Techniques for Java-like Programs,42–49. FTfJP ’12. Beijing, China: ACM.
Elo, Arpad E. 1978.The Rating of Chessplayers, Past and Present.Arco.
Engeser, Stefan, and Falko Rheinberg. 2008. “Flow, Performance and Moderators of Challenge-skill Balance.”Motivation and Emotion32 (3): 158–172.
Fullagar, Clive J., Patrick A. Knight, and Heather S. Sovern. 2013. “Challenge/Skill Bal-ance, Flow, and Performance Anxiety.”Applied Psychology62 (2): 236–259.
Glickman, Mark E. 1999. “Parameter Estimation in Large Dynamic Paired Comparison Ex-periments.”Journal of the Royal Statistical Society: Series C (Applied Statistics) 48 (3): 377–394.
Hacker, Severin, and Luis von Ahn. 2009. “Matchin: Eliciting User Preferences with an Online Game.” InProceedings of the SIGCHI Conference on Human Factors in Com-puting Systems,1207–1216. CHI ’09. Boston, MA, USA: ACM.
Herbrich, Ralf, Tom Minka, and Thore Graepel. 2007. “TrueSkill(TM): A Bayesian Skill Rating System.” InAdvances in Neural Information Processing Systems 20,569–576. MIT Press, January.
Kaggle. 2011.Deloitte/FIDE Chess Rating Challenge.https://www.kaggle.com/c/
ChessRatings2.
Kirkman, Ryan. 2010. pyglicko2: A Python Implementation of the Glicko 2 Algorithm.
https://code.google.com/p/pyglicko2/.
Klimmt, Christoph, Tilo Hartmann, and Andreas Frey. 2007. “Effectance and Control as Determinants of Video Game Enjoyment.”Cyberpsychology & Behavior10, no. 6 (De-cember): 845–847.
Koster, Raph. 2004.A Theory of Fun for Game Design.Scottsdale, AZ: Paraglyph Press. Law, Edith, and Luis von Ahn. 2011.Human Computation.Morgan & Claypool.
Lee, Heungsub. 2015.TrueSkill: The Video Game Rating System.http://trueskill. org/.
Logas, Heather, Jim Whitehead, Michael Mateas, Richard Vallejos, Lauren Scott, Dan Shapiro, John Murray, et al. 2014. “Software Verification Games: Designing Xylem, The Code of Plants.” InProceedings of the 9th International Conference on the Foundations of Digital Games.
Lomas, Derek, Kishan Patel, Jodi L. Forlizzi, and Kenneth R. Koedinger. 2013. “Optimizing Challenge in an Educational Game Using Large-scale Design Experiments.” In Pro-ceedings of the SIGCHI Conference on Human Factors in Computing Systems,89–98. CHI ’13. Paris, France: ACM.
Media Molecule. 2008.LittleBigPlanet.[PlayStation 3] Sony Computer Entertainment. Michael, David, and Jordan Chang. 2013. “Dynamic Difficulty Adjustment in Computer
Games.” InProceedings of the Interactive Multimedia Conference,1–6. Nintendo. 2015.Super Mario Maker.[Wii U] Nintendo.
Reeves, Stuart, and Scott Sherwood. 2010. “Five Design Challenges for Human Computa-tion.” InProceedings of the 6th Nordic Conference on Human-Computer Interaction Extending Boundaries - NordiCHI ’10.
Rigby, Scott, and Richard Ryan. 2007. “The Player Experience of Need Satisfaction (PENS): An Applied Model and Methodology for Understanding Key Components of the Player Experience.”
Sauermann, Henry, and Chiara Franzoni. 2015. “Crowd Science User Contribution Patterns and Their Implications.”Proceedings of the National Academy of Sciences 112 (3): 679–684.
Schell, Jesse. 2014.The Art of Game Design, Second Edition.Boca Raton, London, New York: CRC Press.
Scott, John. 2012.Social Network Analysis.Sage.
Snyder, Alex Cho, and Mario Izquierdo. 2014.Jumpcraft.[PC Computer, Online Game]. Sweetser, Penelope, and Peta Wyeth. 2005. “GameFlow: A Model for Evaluating Player
Enjoyment in Games.”Computers in Entertainment3 (3): Art. 3A.