Longitudinal Examination of the Intestinal Lamina Propria Cellular
Compartment of Simian Immunodeficiency Virus-Infected Rhesus
Macaques Provides Broader and Deeper Insights into the Link between
Aberrant MicroRNA Expression and Persistent Immune Activation
Vinay Kumar, Workineh Torben, Carys S. Kenway, Faith R. Schiro, Mahesh Mohan
Division of Comparative Pathology, Tulane National Primate Research Center, Covington, Louisiana, USA
ABSTRACT
Chronic immune activation/inflammation driven by factors like microbial translocation is a key determinant of human
immu-nodeficiency virus/simian immuimmu-nodeficiency virus (HIV/SIV) disease progression. Although extensive research on
inflamma-tion has focused on studying protein regulators, increasing evidence suggests a critical role for microRNAs (miRNAs) in
regulat-ing several aspects of the immune/inflammatory response and immune cell proliferation, differentiation, and activation. To
understand their immunoregulatory role, we profiled miRNA expression sequentially in intestinal lamina propria leukocytes (LPLs) of
eight macaques before and at 21, 90, and 180 days postinfection (dpi). At 21 dpi,
⬃
20 and 9 miRNAs were up- and downregulated,
re-spectively. However, at 90 dpi (
n
ⴝ
60) and 180 dpi (
n
ⴝ
44),
>
75% of miRNAs showed decreased expression. Notably, the T-cell
acti-vation-associated miR-15b, miR-142-3p, miR-142-5p, and miR-150 expression was significantly downregulated at 90 and 180 dpi. Out
of
⬃
10 downregulated miRNAs predicted to regulate CD69, we confirmed miR-92a to directly target CD69. Interestingly, the
SIV-in-duced miR-190b expression was elevated at all time points. Additionally, elevated lipopolysaccharide (LPS)-responsive miR-146b-5p
expression at 180 dpi was confirmed in primary intestinal macrophages following LPS treatment
in vitro
. Further, reporter and
over-expression assays validated IRAK1 (interleukin-1 receptor 1 kinase) as a direct miR-150 target. Furthermore, IRAK1 protein levels were
markedly elevated in intestinal LPLs and epithelium. Finally, blockade of CD8
ⴙT-cell activation/proliferation with delta-9
tetrahydro-cannabinol (
⌬
9-THC) significantly prevented miR-150 downregulation and IRAK1 upregulation. Our findings suggest that miR-150
downregulation during T-cell activation disrupts the translational control of IRAK1, facilitating persistent gastrointestinal (GI)
in-flammation. Finally, the ability of
⌬
9-THC to block the miR-150-IRAK1 regulatory cascade highlights the potential of cannabinoids to
inhibit persistent inflammation/immune activation in HIV/SIV infection.
IMPORTANCE
Persistent GI tract disease/inflammation is a cardinal feature of HIV/SIV infection. Increasing evidence points to a critical role
for miRNAs in controlling several aspects of the immune/inflammatory response. Here, we show significant dysregulation of
miRNA expression exclusively in the intestinal lamina propria cellular compartment through the course of SIV infection.
Specif-ically, the study identified miRNA signatures associated with key pathogenic events, such as viral replication, T-cell activation,
and microbial translocation. The T-cell-enriched miR-150 showed significant downregulation throughout SIV infection and was
confirmed to target IRAK1, a critical signal-transducing component of the IL-1 receptor and TLR signaling pathways. Reduced
miR-150 expression was associated with markedly elevated IRAK1 expression in the intestines of chronically SIV-infected
ma-caques. Finally,
⌬
9-THC-mediated blockade of CD8
ⴙT-cell activation
in vitro
significantly inhibited miR-150 downregulation
and IRAK1 upregulation, suggesting its potential for targeted immune modulation in HIV infection.
A
major hallmark of untreated human immunodeficiency
vi-rus/simian immunodeficiency virus (HIV/SIV) infection is
chronic generalized immune activation and inflammation that is
linked to viral replication, loss of CD4
⫹T cells, immunological
dysfunction, and disease progression (
1–3
). Further, chronic
im-mune activation has been reported to persist even in HIV-infected
individuals successfully treated with combination antiretroviral
therapy (cART), suggesting that proinflammatory signaling does
not completely subside in treated individuals (
4
). While the exact
mechanisms driving chronic immune activation in HIV/SIV
in-fection remain to be determined, several independent studies have
implicated HIV persistence, coinfections with hepatitis C virus/
hepatitis B virus/cytomegalovirus (HCV/HBV/CMV),
compensa-tory homeostatic mechanisms, and chronic stimulation by
trans-located intestinal microbial products to drive this phenomenon.
Among these, microbial translocation from a structurally and
functionally damaged gastrointestinal (GI) tract has received
con-siderable attention and is considered to significantly contribute to
Received29 January 2016 Accepted2 March 2016
Accepted manuscript posted online2 March 2016
CitationKumar V, Torben W, Kenway CS, Schiro FR, Mohan M. 2016. Longitudinal examination of the intestinal lamina propria cellular compartment of simian immunodeficiency virus-infected rhesus macaques provides broader and deeper insights into the link between aberrant microRNA expression and persistent immune activation. J Virol 90:5003–5019.doi:10.1128/JVI.00189-16.
Editor:F. Kirchhoff, Institute of Molecular Virology
Address correspondence to Mahesh Mohan, [email protected].
Supplemental material for this article may be found athttp://dx.doi.org/10.1128 /JVI.00189-16.
Copyright © 2016, American Society for Microbiology. All Rights Reserved.
on November 7, 2019 by guest
http://jvi.asm.org/
persistent systemic inflammation/immune activation and HIV/
SIV disease progression (
2
,
3
). Recent evidence has identified a
central role for noncoding RNAs, particularly miRNAs, in the
pathogenesis of chronic inflammatory diseases of the GI tract (
5
).
While it is known that increased inflammatory gene transcription
sustains persistent inflammation/immune activation in the
intes-tine during HIV/SIV infection, the posttranscriptional
mecha-nisms that fine-tune inflammatory gene activation/expression
re-main unknown and unaddressed.
Numerous studies have shown that microRNAs (miRNAs), a
class of small noncoding RNAs, can posttranscriptionally regulate
immune cell proliferation/differentiation/migration, cytokine
signaling/production, and the inflammatory response (
6–8
).
miRNA dysregulation has been associated with several chronic
inflammatory diseases, such as inflammatory bowel disease (
9
),
experimental autoimmune encephalomyelitis (
10
), multiple
scle-rosis (
11
), and rheumatoid arthritis (
12
). Lately, the enhanced
expression of miR-21 (
13
) and miR-142 (
14
) was correlated with
macrophage activation and encephalitis in the brain of
SIV-in-fected rhesus macaques. Focusing on the GI tract, an important
site of CD4
⫹T-cell depletion and HIV/SIV replication, we (
15
,
16
)
and others (
17
) reported significant miRNA dysregulation in
in-tact colon during SIV infection. Unlike our two previous studies
that utilized intact intestinal tissue (
15
,
16
), in the present study,
we focused exclusively on the intestinal lamina propria
compart-ment to obtain a deeper understanding of the link between
aber-rant miRNA expression and chronic immune
activation/inflam-mation in the intestine. In tune with this objective, we collected
serial intestinal resection segments from the same animals before
and at 21, 90, and 180 dpi and separated the different mucosal
compartments (epithelium, intraepithelial lymphocytes, lamina
propria leukocytes [LPLs], and fibrovascular stroma). This
strat-egy enabled the identification of distinct miRNA profiles related to
T-cell proliferation/expansion, activation, viral replication, and
microbial translocation. Specifically, we found the expression of 4
miRNAs (miR-15b, miR-142-3p, miR-142-5p, and miR-150)
pre-viously linked to T-cell activation to be consistently
downregu-lated at 90 and 180 dpi. Similar to the LPLs, miR-150 showed
markedly reduced expression in jejunal and colonic epithelium.
Further, we showed that miR-150 can directly regulate protein
expression of IRAK1 (interleukin-1 receptor-associated kinase 1),
an important serine/threonine protein kinase involved in
Toll-like receptor (TLR) and interleukin-1R (IL-1R) signaling
path-ways. Furthermore, decreased miR-150 expression was associated
with elevated protein expression of IRAK1 in both colonic
epithe-lium and LPLs that may contribute to persistent inflammatory
signaling in the intestine during chronic SIV infection. Finally,
and more importantly, we demonstrate that delta-9
tetrahydro-cannabinol (
⌬
9-THC)-mediated inhibition of CD8
⫹T-cell
acti-vation and proliferation successfully prevented miR-150
down-regulation and IRAK1 updown-regulation, an important finding with
strong translational significance.
MATERIALS AND METHODS
Animal care, ethics, and experimental procedures.All experiments us-ing rhesus macaques were approved by the Tulane Institutional Animal Care and Use Committee (protocol 3574). The Tulane National Primate Research Center (TNPRC) is an Association for Assessment and Accred-itation of Laboratory Animal Care International accredited facility (AAALAC number 000594). The NIH Office of Laboratory Animal Wel-fare assurance number for the TNPRC is A3071-01. All clinical proce-dures, including the administration of anesthesia and analgesics, were carried out under the direction of a laboratory animal veterinarian. Ani-mals were anesthetized with ketamine hydrochloride for blood collection procedures. Intestinal pinch and resection biopsy specimens were per-formed by laboratory animal veterinarians. Animals were preanesthetized with ketamine hydrochloride, acepromazine, and glycopyrolate, intu-bated, and maintained on a mixture of isoflurane and oxygen. All possible measures were taken to minimize discomfort of all animals used in this study. Tulane University complies with NIH policy on animal welfare, the Animal Welfare Act, and all other applicable federal, state, and local laws
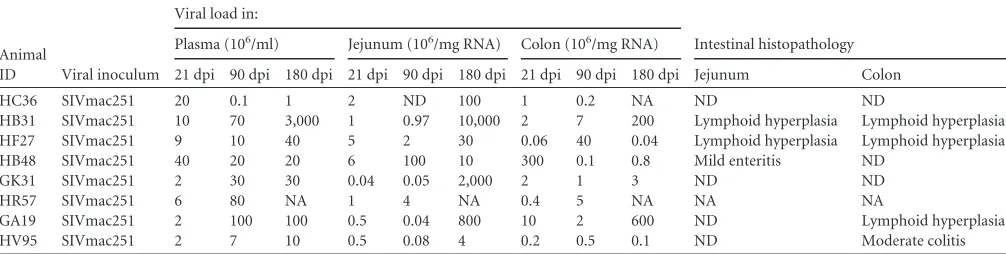
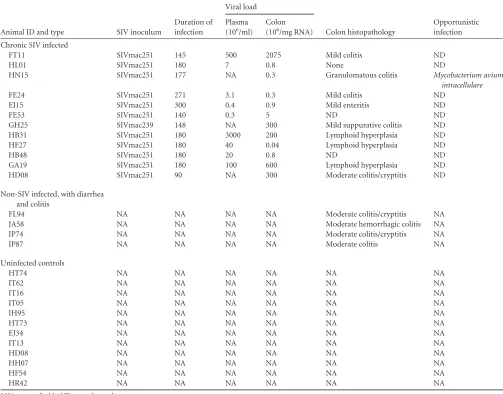
Animals and experimental design.Jejunum and colon tissues were collected from 32 Indian-origin rhesus macaques, including 16 animals infected with SIVmac251 or SIVmac239 and 16 uninfected macaques. Animal identifiers (IDs), SIV inoculum, duration of infection, plasma and intestinal viral loads, and intestinal histopathology in all SIV-infected and uninfected macaques with diarrhea and colitis are provided inTables 1
and2. Serial resection segments (⬃6 to 8 cm long) of jejunum were col-lected from eight macaques (Table 1) before infection and again at 21 and 90 dpi and necropsy (180 dpi) and were used for the initial TaqMan low-density array (TLDA) microRNA profiling. An additional eight chronic SIV-infected and 12 control macaques (Table 2) were included for quantitative reverse transcription-PCR (qRT-PCR) confirmation studies. Colon resection segments (⬃5 cm long) were collected from four macaques (HD08, HH07, HF54, and HR42) to be used as controls (Table 2). Among the 16 uninfected animals we included four that were necrop-sied for chronic diarrhea unresponsive to treatment (non-SIV infected, with diarrhea and colitis) (15,18,19) (Table 2). These animals were in-cluded to determine whether miR-150 downregulation was in response to immune activation or a consequence of CD4⫹T-cell depletion that gen-erally occurs in HIV/SIV infection. Peripheral blood (EDTA) was col-TABLE 1Viral loads and intestinal histopathology in SIV-infected rhesus macaques used for TLDA miRNA profilinga
Animal
ID Viral inoculum
Viral load in:
Intestinal histopathology Plasma (106/ml) Jejunum (106/mg RNA) Colon (106/mg RNA)
21 dpi 90 dpi 180 dpi 21 dpi 90 dpi 180 dpi 21 dpi 90 dpi 180 dpi Jejunum Colon
HC36 SIVmac251 20 0.1 1 2 ND 100 1 0.2 NA ND ND
HB31 SIVmac251 10 70 3,000 1 0.97 10,000 2 7 200 Lymphoid hyperplasia Lymphoid hyperplasia
HF27 SIVmac251 9 10 40 5 2 30 0.06 40 0.04 Lymphoid hyperplasia Lymphoid hyperplasia
HB48 SIVmac251 40 20 20 6 100 10 300 0.1 0.8 Mild enteritis ND
GK31 SIVmac251 2 30 30 0.04 0.05 2,000 2 1 3 ND ND
HR57 SIVmac251 6 80 NA 1 4 NA 0.4 5 NA NA NA
GA19 SIVmac251 2 100 100 0.5 0.04 800 10 2 600 ND Lymphoid hyperplasia
HV95 SIVmac251 2 7 10 0.5 0.08 4 0.2 0.5 0.1 ND Moderate colitis
aAll 8 macaques were infected intravenously with 100 TCID
50SIVmac251. NA, not available. ND, none detected.
on November 7, 2019 by guest
http://jvi.asm.org/
[image:2.585.41.544.78.205.2]lected from 13 additional uninfected macaques to determine the effect of ⌬9-THC on CD8⫹T-cell activation and proliferation and on miR-150 and IRAK1 protein expression.
At necropsy, all tissues were collected in RNAlater (Ambion, TX) for total RNA extraction and qRT-PCR. For histopathologic evaluation, in-testinal tissues were fixed in 10% neutral buffered formalin, embedded in paraffin, sectioned at 7m, and stained with hematoxylin and eosin for analysis.
Intestinal epithelial and lamina propria cell isolation.The protocol and purity of epithelial leukocytes and LPLs isolated from surgical resec-tion segments collected before and at 21, 90, and 180 dpi were described previously (20,21). Briefly, surgical resection segments (6 to 8 cm long) for miRNA profiling studies first were incubated with vigorous shaking in Ca2⫹Mg2⫹-free Hanks’ balanced salt solution (HBSS) containing 1 mM EDTA for two 30-min incubations at 37°C to separate the intestinal epi-thelial cells. Following incubation, the epiepi-thelial cells in the supernatant were harvested by centrifugation at 500⫻gfor 10 min, followed by sub-jecting the cells to Percoll density gradient centrifugation to separate in-traepithelial lymphocytes. After dislodging the epithelial cells the tissue segments were incubated twice for a 30-min duration in RPMI 1640 con-taining 20 U of collagenase per ml while rapidly shaking at 37°C to sepa-rate LPLs from the fibrovascular stroma. The tissue homogenates were
subjected again to Percoll density gradient centrifugation to separate LPLs from the fibrovascular stroma. The purified LPLs then were used for flow cytometry and miRNA profiling as indicated below.
Intestinal resections were collected from SIV-infected macaques in our previous studies (15,16,20,21); the animals tolerate this procedure extremely well. The three resections (preinfection and 21 and 90 days post-SIV infection) were spaced wide apart from one another (⬃2.5 to 3 months), and complete healing occurs within 2 to 3 weeks. The animals were treated with antibiotics only on the day of surgery; therefore, neither surgery nor antibiotic treatment is expected to have any marked effects on the reported changes in miRNA expression profiles. LPLs from three pre-infection (GK31, GA19, and HV95), one 90-dpi (GK31), and three 180-dpi (HC36, HR57, and HV95) samples did not yield the required concen-tration of total RNA per microliter (120 ng/l) for TLDA microRNA profiling and, as a result, were excluded.
Flow cytometry to quantify T-cell dynamics in intestine and periph-eral blood.LPLs from duodenal pinch biopsies were isolated as described in the previous section and adjusted to a concentration of 107/ml. Forin
[image:3.585.40.543.78.472.2]vivoT-cell andin vitroCD8⫹T-cell immunophenotyping,⬃100-l ali-quots were stained with appropriately diluted, directly conjugated mono-clonal antibodies to CD3 (Pacific blue, SP34-2), CD4 (SK3, peridinin chlorophyll protein-Cy5.5), and CD8 (phycoerythrin-Texas red, 3B5), TABLE 2Viral loads and colon histopathology in chronic SIV-infected and uninfected rhesus macaques with diarrhea and colitisa
Animal ID and type SIV inoculum
Duration of infection
Viral load
Colon histopathology
Opportunistic infection Plasma
(106/ml)
Colon (106/mg RNA)
Chronic SIV infected
FT11 SIVmac251 145 500 2075 Mild colitis ND
HL01 SIVmac251 180 7 0.8 None ND
HN15 SIVmac251 177 NA 0.3 Granulomatous colitis Mycobacterium avium
intracellulare
FE24 SIVmac251 271 3.1 0.3 Mild colitis ND
EI15 SIVmac251 300 0.4 0.9 Mild enteritis ND
FE53 SIVmac251 140 0.3 5 ND ND
GH25 SIVmac239 148 NA 300 Mild suppurative colitis ND
HB31 SIVmac251 180 3000 200 Lymphoid hyperplasia ND
HF27 SIVmac251 180 40 0.04 Lymphoid hyperplasia ND
HB48 SIVmac251 180 20 0.8 ND ND
GA19 SIVmac251 180 100 600 Lymphoid hyperplasia ND
HD08 SIVmac251 90 NA 300 Moderate colitis/cryptitis ND
Non-SIV infected, with diarrhea and colitis
FL94 NA NA NA NA Moderate colitis/cryptitis NA
JA58 NA NA NA NA Moderate hemorrhagic colitis NA
IP74 NA NA NA NA Moderate colitis/cryptitis NA
IP87 NA NA NA NA Moderate colitis NA
Uninfected controls
HT74 NA NA NA NA NA NA
IT62 NA NA NA NA NA NA
IT16 NA NA NA NA NA NA
IT05 NA NA NA NA NA NA
IH95 NA NA NA NA NA NA
HT73 NA NA NA NA NA NA
EJ34 NA NA NA NA NA NA
IT13 NA NA NA NA NA NA
HD08 NA NA NA NA NA NA
HH07 NA NA NA NA NA NA
HF54 NA NA NA NA NA NA
HR42 NA NA NA NA NA NA
aNA, not applicable; ND, none detected.
on November 7, 2019 by guest
http://jvi.asm.org/
CD69 (FN50 and V450), and Ki67 (556026, fluorescein isothiocyanate) (BD Biosciences, San Jose, CA). For surface markers, samples were stained for 30 min in the dark at room temperature. The samples then were per-meabilized with a BD Cytofix/Cytoperm fixation/permeabilization solu-tion kit (554714; BD Biosciences) and stained for the intracellular marker Ki67 for 25 min in the dark at room temperature. Once staining was complete, the samples were fixed in BD stabilizing fixative buffer (338036; BD Biosciences) and stored in the dark at 4°C overnight for acquisition the next day. Samples were acquired on LSR II flow cytometry equipment (BD Biosciences) and analyzed with Flow Jo software (Tree Star Inc., Ashland, OR). The cells first were gated on singlets followed by lymphocytes, CD3⫹ T cells, and then CD3⫹CD4⫹and CD3⫹CD8⫹T-cell subsets. Forin vitro
CD8⫹T-cell immunophenotyping, cells first were gated on singlets fol-lowed by lymphocytes, CD3⫹T cells, and then CD3⫹ CD4⫹, CD3⫹ CD8⫹, CD3⫹CD8⫹CD69⫹, and CD3⫹CD8⫹Ki67⫹T-cell subsets.
Global microRNA profiling using TLDA.Approximately 350 ng of total RNA from LPLs first was reverse transcribed, preamplified, and loaded onto TLDA plates and processed as described previously (15,16). Total RNA was extracted from LPL samples using the miRNeasy total RNA isolation kit (Qiagen Inc., CA). RNA integrity was assessed by run-ning an aliquot on a denaturing agarose gel followed by stairun-ning with ethidium bromide to visualize intact 28S and 18S rRNA bands. For TLDA miRNA profiling,⬃350 ng of total RNA first was reverse transcribed by following the ABI microRNA TLDA reverse transcription reaction proto-col. Briefly, two master mixes were prepared for each RNA sample repre-senting either TLDA panel (panel A or panel B) and consisted of the following reaction mixture components: 0.80l MegaPlex RT primers (10⫻), 0.20l deoxynucleoside triphosphate (dNTP) with dTTP (100 mM), 1.50l MultiScribe reverse transcriptase (50 U/l), 0.80l 10⫻RT buffer, 0.90l MgCl2(25 mM), 0.10l RNase inhibitor, and 0.20l nuclease-free water (20 U/l). Three microliters of total RNA (350 ng) was loaded into appropriate wells of a 96-well plate containing 4.5l of the RT reaction mix and after a brief 5-min incubation on ice was sub-jected to the following thermal cycling conditions on the ABI 7900 HT Fast PCR system: standard or max ramp speed, 16°C for 2 min, 42°C for 1 min, 50°C for 1 s (40 cycles), and 85°C for 5 min (hold).
Approximately 2.5l of the resulting cDNA from each sample was mixed with a total of 22.5l of preamplification reaction mix consisting of 12.5l TaqMan PreAmp master mix (2⫻), 2.5l Megaplex PreAmp primers (10⫻), 7.5l nuclease-free water and was preamplified on the ABI 7900 HT Fast PCR system according to the TLDA miRNA preampli-fication protocol outlined by the manufacturer (Life Technologies). The preamplification thermal cycling conditions were the following: hold at 95°C for 10 min, hold at 55°C for 2 min, hold at 72°C for 2 min, and 12 cycles at 95°C for 15 s and 60°C for 4 min.
The preamplified product first was diluted 4-fold with 75l of 0.1⫻ Tris-EDTA, pH 8.0, and mixed, following which 9l of the diluted Pre-Amp product was mixed with 450l of 2⫻TaqMan universal PCR master mix with no UNG (AmpErase) and 441l of nuclease-free water to bring the final volume to 1 ml. After proper mixing and centrifuging, 100l of the PCR mix was loaded into each port of the TaqMan array human microRNA A⫹B card set, v3.0. The TLDA cards then were centrifuged, sealed, and processed on the ABI 7900 HT sequence detection system using 384-well TLDA default thermal cycling conditions.
Quantitative real-time TaqMan stem-loop microRNA RT-PCR.The expression of a select list of differentially expressed (DE) miRNAs at 21, 90, and 180 dpi was further confirmed in both intestinal LPLs (⬃100 ng total RNA) and epithelium (⬃250 ng total RNA) using the TaqMan microRNA predesigned and preoptimized assays (Life Technologies) as described previously (15,16). Briefly, total RNA was reverse transcribed using the stem-loop primers provided in the predesigned kit in a total volume of 15l. Approximately 4l of cDNA was subjected to 40 cycles of PCR in a total volume of 20l on the ABI 7900 HT fast PCR system (Life Technologies) using the following thermal cycling conditions: 95°C for 10 min, followed by 40 repetitive cycles of 95°C for 15 s and 60°C for 1
min. As a normalization control for RNA loading, parallel reactions in duplicate wells to amplify snoU6 were run in the same or a different multiwell plate. Comparative real-time PCR was performed in duplicate wells, including no-template controls, and relative changes in gene ex-pression were calculated using the comparative threshold cycle (⌬⌬CT)
method. PCR efficiency analysis was performed using serial 10-fold RNA dilutions (500, 50, 5, and 0.5 ng for all target miRNAs) (40, 4, 0.4, and 0.04 ng for RNU48 and snoU6). The amplification curves for all assays were linear and based on slope values (⫺3.09 to⫺3.12). All assays had 103 to 107% efficiency.
Immunofluorescence for cellular localization of IRAK1 in colon.
Immunofluorescence studies for the detection of IRAK1 (9F3 at 1:750) (Abcam) was done as described earlier (18,19). Formalin-fixed, paraffin-embedded tissues were sectioned at 7m and stained with the appropri-ate primary and secondary antibody as well as hematoxylin and eosin to microscopically assess the histological status of the tissue. Briefly, slides were blocked with 100 to 200l of blocking buffer (10 mM Tris-HCl, pH 7.5, 150 mM NaCl, 3% bovine serum albumin [BSA], 10% normal goat serum, and 0.1% Triton X-100) for 45 min to 1 h followed by 1 h of incubation at 37°C with rabbit polyclonal IRAK1 primary antibody (9F3 at 1:750) (Abcam). The slides were washed three times in buffer (10 mM Tris-HCl, pH 7.5, 150 mM NaCl, and 0.1% Triton X-100) followed by the addition of goat anti-rabbit secondary antibody conjugated to Alexa Fluor 488 (1:1,000) (Invitrogen Corp., CA). This was followed by mouse anti-CD8 (IgG1 at 1:10) (Dako Laboratories) at room temperature for 1 h. The slides were washed three times and incubated for 1 h with goat anti-mouse secondary antibody conjugated with Alexa Fluor 568 (1:1,000). Confocal microscopy was performed using a Leica TCS SP2 confocal microscope equipped with three lasers (Leica Microsystems, Exton, PA). Individual optical slices represent 0.2m, and 32 to 62 optical slices were collected at 512- by 512-pixel resolution. NIH Image (version 1.62) and Adobe Pho-toshop (version 7.0) were used to assign colors to the three channels collected: Alexa 568 (Invitrogen Corp) is red, Alexa 488 (Invitrogen Corp) is green, and the differential interference contrast (DIC) image is in gray-scale. The three channels were collected simultaneously. The colocaliza-tion of antigens is demonstrated by the addicolocaliza-tion of colors as indicated in the figure legends.
Immunophenotyping of IRAK1-positive cells was done using CD8 (1:10) (Dako, Denmark) and appropriate Alexa Fluor-conjugated sec-ondary antibodies (Lifetech Corp). Images from all macaques were cap-tured using the same laser (red and green) strength.
Quantitative image analysis.Quantitation of cells and regions of in-terest (ROI) labeled by IRAK1 was performed using Volocity 5.5 software (PerkinElmer Inc., MA, USA) after capturing images on a Leica confocal microscope. Several ROI were hand drawn on the epithelial and LPL re-gions in the images captured from colon of chronic SIV-infected and uninfected macaques and processed utilizing the same brightness, density, and black level settings. The data first were graphed and then analyzed using Mann-Whitney U test employing the Prism v5 software (GraphPad software).P⬍0.05 was considered statistically significant.
Cloning of 3=UTRs of CD69, IRAK1 mRNA, and Dual-Glo luciferase reporter gene assay.The 3=untranslated region (UTR) of the rhesus CD69 mRNA contains three highly conserved predicted binding sites for miR-92a (TargetScan 6.2) (22) (see Table S1 in the supplemental mate-rial). Similarly, miR-150 has up to 4 predicted binding sites on the 3=UTR of IRAK1 mRNA that are conserved in the human, chimpanzee, and rhe-sus macaque (see Table S2) (22). Oligonucleotide design (containing wild-type [WT] and deleted miRNA binding sites), synthesis, processing, pmirGLO vector cloning, and Dual Glo luciferase reporter assay were performed as described previously (15,16). Briefly, a short 42- to 44-nucleotide-long sequence representing the 3=UTR containing the pre-dicted miRNA binding site was synthesized (IDT DNA Technologies Inc., IA) for cloning into the pmirGLO dual-luciferase vector (Promega Corp., Madison, WI). A second oligonucleotide with the binding site deleted also was synthesized to serve as a negative control. Both oligonucleotide
on November 7, 2019 by guest
http://jvi.asm.org/
quences were synthesized with a PmeI site on the 5=end and an XbaI site on the 3=end for directional cloning. The pmirGLO vector first was cut with PmeI and XbaI restriction enzymes, gel purified, and ligated with either wild-type (WT) sequence containing the miRNA binding site or deleted (Del) sequence. HEK293 cells were plated at a density of 5⫻104 cells per well of a 96-well plate. At 50% confluence, cells were cotrans-fected with⬃100 ng WT or Del UTR miRNA luciferase reporter vector and 100 nM miRNA mimic using the DharmaFECT duo transfection reagent (ThermoFisher Scientific). In separate wells, cells also were trans-fected with pmirGLO vector (Promega Corp) as a normalization control. After 48 h, the Dual-Glo luciferase assay was performed according to the manufacturer’s recommended protocol using the BioTek H4 Synergy plate reader (BioTek, Winooski, VT). The normalizedFirefly/Renillaratio was calculated to determine the relative reporter activity. Experiments were performed in 6 replicates and repeated thrice.
Peripheral blood CD8ⴙ T-cell isolation and culture. Peripheral blood mononuclear cells (PBMCs) were isolated from EDTA blood by density gradient centrifugation using lymphocyte separation medium (LSM) as previously described (15). Briefly, after the removal of plasma, reconstituted blood was layered onto LSM for the collection of lympho-cytes. Red blood cell contamination was removed by lysis with ACK buf-fer, and cells were washed prior to resuspension in complete RPMI 1640 containing 5% heat-inactivated fetal bovine serum,L-glutamine, and pen-icillin-streptomycin. CD8⫹T cells were purified from PBMCs (3.9⫻107 to 14.2⫻107cells/animal) using a magnetic activated cell sorting CD8⫹ T-cell isolation kit, nonhuman primate version (Miltenyi Biotec), by fol-lowing the manufacturer’s protocol. CD8⫹T-cell yields ranged from 4⫻ 106to 14⫻106/ml.⌬9-THC was provided by the National Institute on Drug Abuse (NIDA; Rockville, MD), supplied as a solution of 200 mg/ml in absolute ethanol, and stored at⫺20°C.⌬9-THC was concentrated with a Vacufuge (Eppendorf, Hamburg, Germany) to remove ethanol and re-suspended in dimethyl sulfoxide (DMSO). Purified CD8⫹T cells (⬃4⫻ 106to 14⫻106cells) from each animal were resuspended in complete RPMI 1640 and preincubated with either 15M⌬9-THC or an equal volume of vehicle (DMSO) for 30 min, followed by activation with 40 nM PMA (phorbol 12-myristate 13-acetate)– 0.5M ionomycin as described previously by Kaplan et al. (24). For each animal, isolated CD8⫹T cells were split equally between the two treatments.⌬9-THC or vehicle was present throughout the 24-h incubation period.
Transient overexpression of miR-150.HEK293 cells were cultured in 6-well plates in 2 ml of complete Eagle’s minimum essential medium containing 10% fetal bovine serum (FBS). At 80% confluence, cells were transfected with 2g of pEP-miR-150 plasmid (Cell Biolabs, San Diego, CA, USA) for primary miR-150 overexpression or pEP-Null vector (con-trol plasmid) in duplicate wells using Dharmfect Duo transfection reagent as described previously (15) and cultured for 96 h.
Immunoprecipitation and Western blotting.Total protein from HEK293 cells (pEP-Null or pEP-miR-150 transfected) and CD8⫹T cells (vehicle or⌬9-THC treated) was extracted using a lysis buffer (Cell Sig-naling Technology, Inc., Beverly, MA) containing 20 mM Tris-HCl (pH 7.5), 150 mM NaCl, 1 mM Na2EDTA, 1 mM EGTA, 1% Triton, 2.5 mM sodium pyrophosphate, 1 mM beta-glycerophosphate, 1 mM Na3VO4, 1 g/ml leupeptin, protease inhibitor cocktail, and phosphatase inhibitor cocktail (Sigma Chemical Company, MO). Total protein was quantified using the Pierce bicinchoninic acid (BCA) protein assay kit (Thermo Fisher Scientific, Waltham, MA). Approximately 150 to 300g of total protein extract was immunoprecipitated with⬃5l of a rabbit polyclonal antibody against IRAK1 (Santa Cruz Biotechnologies, CA) overnight at 4°C, followed by incubation with 25l (50%, wt/vol) of protein G agarose beads (Invitrogen Corp., CA) at 4°C for 4 to 5 h. Identical protein con-centrations (CD8⫹T cells) representing both treatments (vehicle versus THC) from the same animal were used for immunoprecipitation. The supernatant was removed and transferred to a separate 1.5-ml microcen-trifuge tube and immunoprecipitated using goat polyclonal antibody (⬃5 l) (Santa Cruz Biotechnologies, CA) to either-actin or ribosomal
pro-tein L5 (RPL5) at 4°C overnight on a shaker. Immunoprecipitated IRAK1, -actin, and RPL5 proteins were heat denatured for 5 min at 100°C in sample loading buffer containing 62.5 mM Tris-HCl, 5% 2-mercaptoeth-anol, 10% glycerol, 2% SDS, and bromophenol blue, resolved on 8 to 12% SDS-PAGE gels, and transferred to 0.2-m polyvinylidene difluoride (PVDF) membranes (Bio-Rad Laboratories, CA). The membranes were probed with a rabbit polyclonal primary antibody against IRAK1 (Cell Signaling Technologies, MA) and rabbit polyclonal antibody to-actin (Santa Cruz) or ribosomal protein L5 (RPL5) (Cell Signal, MA), followed by the appropriate horseradish peroxidase (HRP)-conjugated secondary antibody (Santa Cruz, CA). Membranes were treated with West-Dura chemiluminescent substrate (Pierce Biotechnology Inc., Rockford, IL) for 5 min, and the signal was captured using the FluorChem-R imaging sys-tem (ProteinSimple) and quantified using ImageJ software (NIH). Since CD8⫹T cells were harvested on different days, immunoprecipitation/ Western blotting was performed separately when the cells were available. Hence,Fig. 9Bshows three separate images.
Quantitation of plasma and mucosal viral loads.Total RNA samples (plasma and intestine) from all SIV-infected animals were subjected to a quantitative real-time TaqMan two-step RT-PCR analysis to determine the viral load as described earlier (15,16). Total RNA samples from all SIV-infected animals were subjected to a quantitative real-time TaqMan two-step RT-PCR analysis to determine the viral load in SIV-infected colon and jejunum samples. Briefly, primers and probes specific to the SIV long terminal repeat sequence were designed and used in the real-time TaqMan PCR assay. Probes were conjugated with a fluorescent reporter dye (6-carboxyfluorescein) at the 5=end and a quencher dye at the 3=end. Fluorescence signal was detected with an ABI 7900 HT fast PCR system (Life Technologies). Data were captured and analyzed with Sequence De-tector software (PE Applied Biosystems). The viral copy number was de-termined by plottingCTvalues against a standard curve (y⫽ ⫺3.351x⫹
40.377) (r2⫽0.998) generated within vitro-transcribed RNA represent-ing known viral copy numbers.
Data analysis.TLDA and individual miRNA qRT-PCR data analyses were performed as described before (15,16). miRNA expression data were normalized to a combination of two endogenous controls (snoU6 and RNU48). Given the exploratory nature of the study with a small sample size, we decided not to apply multiple-comparison correction (Benja-mini-Hochberg method for false discovery rate) mainly to avoid type-II errors (false negatives). However, to avoid type I errors (false positives), we confirmed the expression of several miRNAs using qRT-PCR at 21, 90, and 180 dpi.
For LPL qRT-PCR confirmation studies, miRNA fold changes were calculated using an average of all control animal⌬CTvalues. For the quantification of miR-150 in LPLs of SIV-uninfected macaques with di-arrhea and colitis (see Fig. S1 in the supplemental material) and vehicle-or THC-treated CD8⫹T cells (Fig. 9A), one uninfected control macaque or THC-treated CD8⫹T-cell sample with the lowest⌬CTvalue served as
the calibrator/reference and was assigned a value of 1. miR-150 fold changes in all other macaques, including THC- and vehicle-treated CD8⫹ T-cell samples, are shown as ann-fold difference relative to the sample. The stepwise calculation of fold change using this approach is shown in Table S3. We used this approach as it facilitated graphing all samples so that the variation within both groups can be displayed. Individual LPL miRNA qRT-PCR data were analyzed using Wilcoxon’s rank-sum test using the RealTime StatMiner package (Integromics). Intestinal CD4⫹ and CD8⫹T-cell data at 21, 90, and 180 dpi were analyzed using Kruskal-Wallis test, andpost hocanalysis was done using Dunn’s multiple-group comparison (Prism v5 software; GraphPad Software, La Jolla, CA).P
values of⬍0.05 were considered significant. Quantitative image analysis data were analyzed using Mann-Whitney U test (Prism v5 software). Fire-fly/Renillaratios were analyzed using an unpaired t test. Data related to the effect of THC on CD8⫹T-cell activation, proliferation, miR-150 ex-pression, and IRAK1 protein quantification were analyzed using the Wil-coxon matched-pairs signed-rank test (Prism v5 software).
on November 7, 2019 by guest
http://jvi.asm.org/
Microarray data accession number.TLDA miRNA data were depos-ited in the GEO database under accession numberGSE77134.
RESULTS
Mucosal immunophenotyping, viral loads, and intestinal
histo-pathology.
All SIV-infected macaques used for TLDA miRNA
profiling had substantial plasma and intestinal viral loads at 21, 90,
and 180 dpi (
Table 1
). As shown in
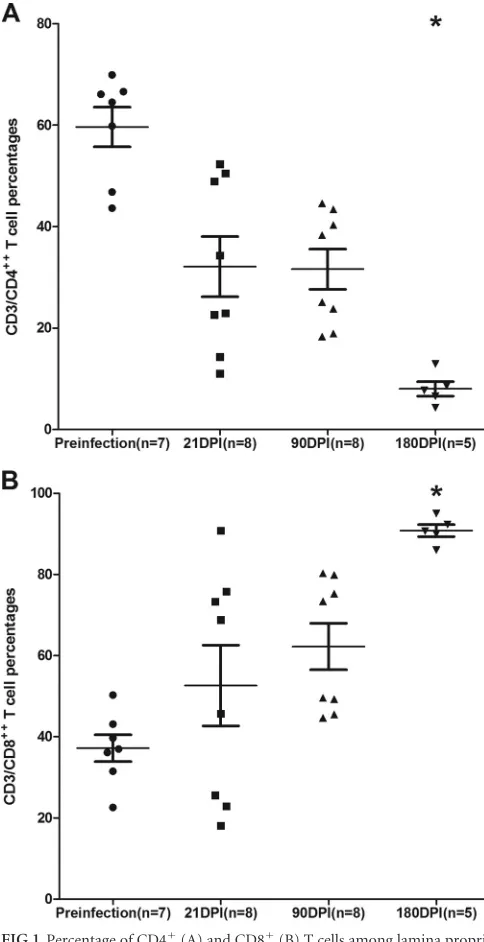
Fig. 1A
, a statistically
signifi-cant reduction in intestinal CD4
⫹T-cell percentages was observed
at 180 dpi. The CD4
⫹T-cell data were included in a previous
publication (
15
), as these animals were used in that study. We have
included these data once again for the convenience of the reader.
In contrast to CD4
⫹, intestinal CD8
⫹T-cell percentages increased
at all three time points (
Fig. 1B
). Similar to CD4
⫹, CD8
⫹T-cell
increases only at the 180-dpi time point showed statistical
signif-icance (
Fig. 1B
).
Histologic evaluation of colon sections (
Table 2
) from all but
three chronic SIV-infected macaques revealed the presence of
mild to severe colitis, including lesions such as crypt
abscess/cryp-titis (
Table 2
). Opportunistic pathogens such as
Mycobacterium
avium intracellulare
were detected in only 1 out of the 12 chronic
SIV-infected macaques (
Table 2
).
miRNAs associated with CD8
ⴙT-cell expansion,
macro-phage activation, and viral replication showed marked
altera-tions at 21 dpi.
To identify differentially expressed (DE) miRNAs
in LPLs during the course of SIV infection, we obtained serial
jejunal resections mainly due to the higher LPL yields than those
from colon samples. miRNA expression profiling of LPLs at 21 dpi
identified 29 DE miRNAs (
Fig. 2A
and
B
). Out of these, 20 showed
increased and 9 showed decreased expression (
Fig. 2A
and
B
). The
notable miRNAs that were upregulated included 18a,
miR-363, miR-212, and miR-190b. Strikingly, miR-18a and miR-miR-363,
which belong to the miR-17-92 cluster, and its paralog,
miR-106a-363, were significantly upregulated. Previous studies in mice had
identified a role for the miR-17-92 cluster in early CD8
⫹T-cell
proliferation and clonal expansion (
25
,
26
). Although flow
cytom-etry data (
Fig. 1B
) showed increased CD8
⫹T-cell percentages in
LPLs at 21 dpi compared to that at the preinfection time point,
future studies are needed to confirm whether increased expression
of miRNAs belonging to the miR-17-92 cluster during acute HIV/
SIV infection is due to CD8
⫹T-cell proliferation and expansion.
Similarly, miR-212 previously was linked to macrophage
activa-tion (
27
), and its upregulation may be an early indication of
mac-rophage activation during acute SIV infection. Interestingly,
miR-150, an important miRNA known to be downregulated during
T-cell (
28–30
) and B-cell (
31
,
32
) activation, showed significantly
reduced expression (
Fig. 2B
), providing early evidence of immune
activation. The finding that miR-150 expression also decreased in
LPLs isolated from non-SIV-infected macaques with diarrhea and
colitis (see Fig. S1 in the supplemental material) suggests that its
downregulation is not due to CD4
⫹T-cell depletion but likely is
due to T-cell activation, as these animals had moderate colitis
(
Table 2
) but no CD4
⫹T-cell depletion (
15
,
18
,
19
). Further,
miR-150 is a lymphoid-enriched miRNA, and the low
C
Tvalue
of
⬃
11 to 12 (
Fig. 2B
) provides strong evidence that the LPLs
are highly enriched for lymphocytes. As reported previously in
colon tissue from irritable bowel syndrome (IBS) patients (
33
),
miR-199a-5p and miR-199b-5p showed decreased expression
in LPLs at 21 dpi. The downregulation of both miRNAs may be
in response to mucosal inflammation that is common to both
IBS and HIV/SIV infection. qRT-PCR studies confirmed the
significantly reduced expression of miR-150 and miR-199a-5p
(
Fig. 2C
). In contrast, miR-18a (
P
⫽
0.18), miR-363 (
P
⫽
0.219), and miR-212 (
P
⫽
0.0726) expression was increased yet
did not reach statistical significance (
Fig. 2C
). Interestingly, the
significantly enhanced expression of miR-190b at 21 dpi (
Fig.
2A
and
B
) further confirms our recent demonstration that its
FIG 1Percentage of CD4⫹(A) and CD8⫹(B) T cells among lamina propria leukocytes (LPLs) isolated at different time points after SIV infection. The cells were first gated on singlets followed by lymphocytes and CD3, and then they were gated on CD3⫹CD4⫹and CD3⫹CD8⫹T-cell subsets. Data analysis using Kruskal-Wallis test identified significant differences among the different groups for both CD4 (P⫽0.0003) and CD8 (P⫽0.0020) T cells.Post hocanalysis using Dunn’s multiple-group comparison identified both CD4⫹and CD8⫹T cells at 180 dpi to be significantly different from the preinfection group. *,P⬍0.05. The error bars represent standard errors of means for CD4⫹ or CD8⫹T-cell percentages within each group.
on November 7, 2019 by guest
http://jvi.asm.org/
[image:6.585.298.540.67.538.2]upregulation is driven in response to viral replication and not
immune/inflammatory responses (
15
). Collectively, miRNA
profiles at 21 dpi in LPLs show selective upregulation of miRNAs
previously associated with early CD8
⫹T-cell proliferation
(miR-17-92 cluster), macrophage activation (miR-212), and
SIV replication (miR-190b), and the concurrent
downregula-tion of miR-150 may be an early indicadownregula-tion of T-cell and,
pos-sibly, B-cell activation.
A four-miRNA signature linked to T-cell activation is
con-sistently downregulated at viral set point (90 dpi) and in
chronic SIV infection (180 dpi).
In contrast to results at 21 dpi,
at the viral set point (90 dpi), 65 miRNAs showed differential
expression (
Fig. 3A
and
B
). Sixty of the 65 DE miRNAs (92%)
showed significantly decreased expression (
Fig. 3A
and
B
).
Compared to results at 21 dpi, the number of downregulated
miRNAs at 90 dpi increased
⬃
7-fold (
n
⫽
60). At 180 dpi, 44
DE miRNAs were identified. Similar to results at 90 dpi, the
majority (
⬃
75%) of the DE miRNAs at 180 dpi were
down-regulated (
n
⫽
33) and 25% (
n
⫽
11) were upregulated (
Fig. 4A
and
B
), suggesting that as disease progresses the miRNAome is
downregulated.
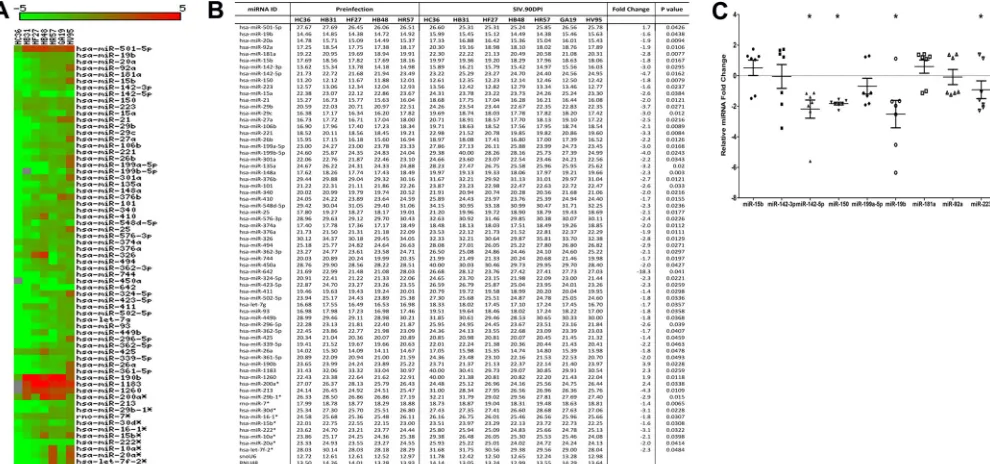
At 90 and 180 dpi, several miRNAs belonging to the miR-17-92
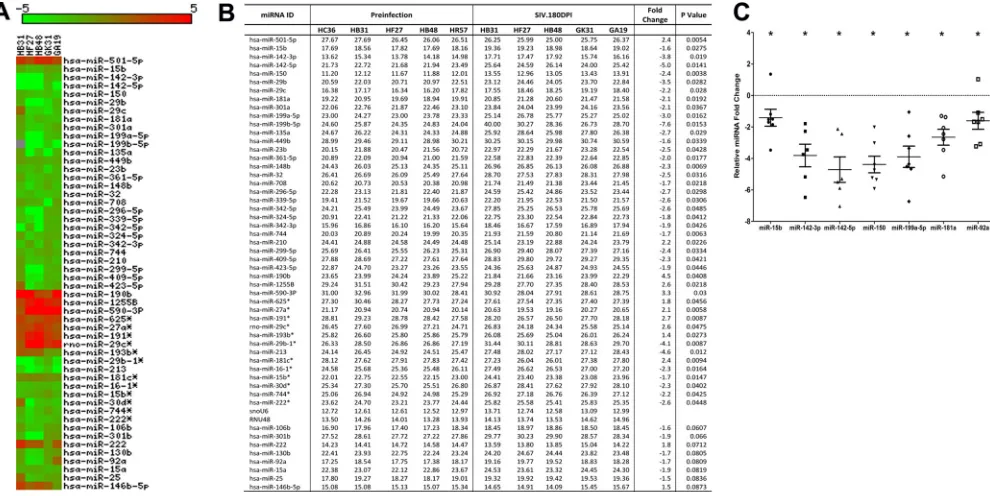
FIG 2Changes in miRNA expression in intestinal LPLs of rhesus macaques at 21 days post-SIV infection compared to the preinfection time point. (A) The heat map shows all differentially expressed (P⬍0.05) miRNAs in intestinal LPLs of rhesus macaques at 21 dpi. (B) Table shows rawCT, fold change, andPvalues forall differentially expressed miRNAs in LPLs at 21 dpi. miRNA species originating from the opposite arm of the precursor are denoted with an asterisk. (C) qRT-PCR confirmation of select differentially expressed miRNAs at 21 dpi (n⫽8) relative to preinfection samples (n⫽5). Data were analyzed using the nonparametric Wilcoxon’s rank-sum test for independent samples. The error bars represent standard errors of means of fold changes within each group. A single asterisk indicates statistical significance (P⬍0.05) compared to preinfection controls.
FIG 3Changes in miRNA expression in intestinal LPLs of rhesus macaques at 90 days post-SIV infection compared to the preinfection time point. (A) Heat map shows all differentially expressed (P⬍0.05) miRNAs in intestinal LPLs of rhesus macaques at 90 dpi. (B) Table shows rawCT, fold change, andPvalues for all
differentially expressed miRNAs in LPLs at 90 dpi. miRNA species originating from the opposite arm of the precursor are denoted with an asterisk. (C) qRT-PCR confirmation of select differentially expressed miRNAs at 90 dpi (n⫽7) relative to preinfection samples (n⫽5). Data were analyzed using the nonparametric Wilcoxon’s rank-sum test for independent samples. The error bars represent standard errors of means of fold changes within each group. A single asterisk indicates statistical significance (P⬍0.05) compared to preinfection controls.
on November 7, 2019 by guest
http://jvi.asm.org/
[image:7.585.43.544.67.211.2] [image:7.585.45.540.432.664.2]cluster, namely, miR-19b, miR-20a, miR-17, miR-18a, miR-20b,
and miR-92a, were significantly downregulated. These
in vivo
findings are consistent with three previous reports that showed the
downregulation of the miR-17-92 cluster during CD8
⫹T-cell
dif-ferentiation and activation
in vitro
(
25
,
26
,
34
,
35
). Interestingly,
miR-181a expression decreased at both 90 and 180 dpi. More
im-portantly, the expression of four miRNAs (miR-15b, miR-142-3p,
miR-142-5p, and miR-150), previously shown to be associated
with T-cell activation (
28
,
29
), was significantly downregulated in
LPLs at 90 and 180 dpi. Further, miR-223, previously associated
with NK-cell activation, also showed decreased expression at 90
dpi (
36
,
37
). Furthermore, the expression of the Th17-enriched
miR-301a (
38
) was significantly decreased at both time points,
possibly be due to the virus-induced depletion of these cells (
1
,
2
).
Figure S2 in the supplemental material shows the expression of 12
differentially expressed miRNAs in five animals compared
longi-tudinally to their preinfection levels.
qRT-PCR studies confirmed the statistically significant
down-regulation of miR-150, miR-142-5p, miR-19b, and miR-223 in
LPLs at 90 dpi (
Fig. 3C
). In contrast, the expression of miR-142-3p
(
P
⫽
0.072), miR-15b (
P
⫽
0.072), miR-92a (
P
⫽
0.29), and
miR-181a (
P
⫽
0.29) did not show statistical significance (
Fig.
3C
). However, at 180 dpi, qRT-PCR confirmed statistically
signif-icant downregulation of miR-15b, miR-142-3p, miR-142-5p,
miR-150, miR-199a-5p, and miR-181a (
Fig. 4C
). At 180 dpi,
al-though miR-92a downregulation based on TLDA profiling did
not show statistical significance (
P
⫽
0.0809), qRT-PCR
confir-mation demonstrated statistical significance (
Fig. 4C
). Similar to
results at 21 dpi, the expression of the SIV-induced miR-190b was
significantly elevated at 90 and 180 dpi (
Fig. 3
and
4
), confirming
our previous report showing its persistent elevation throughout
SIV infection (
15
).
At 180 dpi, miR-146b-5p, a lipopolysaccharide
(LPS)-respon-sive miRNA in THP-1 monocytes (
39
), showed a statistically
non-significant (
P
⫽
0.0873) (
Fig. 4B
) increase, suggesting that its
ele-vated expression is triggered by translocated intestinal bacteria
and their products. To test this possibility, we isolated (
15
) and
treated
in vitro
-cultured primary intestinal and bone
marrow-de-rived macrophages from macaques necropsied for diarrhea and
colitis with LPS. Unlike resident intestinal macrophages, recently
emigrated monocytes from blood (
40
) and inflammatory
macro-phages in the intestine adhere to culture flasks (
41
), proliferate
(
15
), and express high levels of the LPS coreceptor CD14 (
40
,
41
),
which makes them responsive to LPS treatment
in vitro
. As shown
in
Fig. 5
, miR-146b-5p expression increased significantly in
intes-tinal (
P
⫽
0.0313) (
Fig. 5A
) and bone marrow-derived
macro-phages (
P
⫽
0.0156) (
Fig. 5B
) 16 h after LPS treatment. Overall,
the miRNA expression profiles in LPLs at 90 and 180 dpi were
dominated by downregulated miRNAs, and the attenuated
ex-pression of members of the 17-92 cluster, 15b,
miR-142-3p, miR-142-5p, and miR-150, in LPLs is suggestive of
chronic persistent T-cell activation, a hallmark of untreated HIV/
SIV infection.
miR-92a can directly target the lymphocyte proliferation and
activation marker CD69.
As T-cell activation is associated with
enhanced gene expression, it is logical to assume that miRNA
downregulation may be necessary to relax the repression of genes
that control their effector functions. One such gene is CD69, a
C-type lectin and an early activation marker required for
lympho-cyte proliferation, migration, and regulation of immune
re-FIG 4Changes in miRNA expression in intestinal LPLs of rhesus macaques at 180 days post-SIV infection compared to the preinfection time point. (A) Heat map shows all differentially expressed (P⬍0.05) miRNAs in intestinal LPLs of rhesus macaques at 180 dpi. (B) Table shows rawCT, fold change, andPvaluesfor all differentially expressed miRNAs in LPLs at 180 dpi. miRNA species originating from the opposite arm of the precursor are denoted with an asterisk. (C) qRT-PCR confirmation of select differentially expressed miRNAs at 180 dpi (n⫽6) relative to preinfection samples (n⫽5). Data were analyzed using the nonparametric Wilcoxon’s rank-sum test for independent samples. The error bars represent standard errors of means of fold changes within each group. A single asterisk indicates statistical significance (P⬍0.05) compared to preinfection controls.
on November 7, 2019 by guest
http://jvi.asm.org/
[image:8.585.45.540.67.315.2]sponses (
42
). Moreover, marked increases in the levels of CD8
⫹CD69
⫹T cells were detected in the intestine after SIV infection
(
43
). Using the TargetScan algorithm (
22
), predicted binding sites
for
⬃
10 downregulated miRNAs (miR-15a, miR-15b, miR-20a,
miR-20b, miR-106b, miR-301a, miR-181a, miR-92a, miR-21, and
miR-142-5p) were identified on the 3
=
UTR of the rhesus macaque
CD69 mRNA (see Table S1 in the supplemental material). Since
miR-92a had three predicted conserved binding sites on the 3
=
UTR of CD69 mRNA, we further tested its ability to bind the 3
=
UTR using the luciferase reporter assay. As shown in
Fig. 5C
,
cotransfection of HEK293 cells with CD69 WT vector and
miR-92a mimic reduced
Firefly/Renilla
ratios by
⬃
50% compared to
those of cells transfected with the CD69 Del vector in three
inde-pendent experiments. These results demonstrate that miR-92a
can posttranscriptionally regulate CD69 expression by physically
interacting with its 3
=
UTR during T-cell activation, and its
de-creased expression is consistent with the assumption that the
miRNA-mediated posttranscriptional silencing needs to be shut
down during T-cell activation to relieve the repression of genes (
7
)
required to fulfill their effector functions.
IRAK1 is a direct target of miR-150, and its protein
expres-sion is markedly elevated in colonic epithelium and LPLs during
chronic SIV infection.
To understand the biological significance
of miRNA downregulation associated with T-cell activation, we
focused on the predicted targets of miR-150, as its expression has
been confirmed by multiple studies to be rapidly and extremely
FIG 5miR-146b-5p, an LPS-responsive miRNA, is significantly elevated in primary intestinal (A) and bone marrow-derived (B) macrophages in response toin vitroLPS treatment (100 ng) for 24 h. (C) miR-92a can physically bind to the 3=UTR of rhesus macaque CD69 mRNA and downregulate its expression (P⫽0.0001). HEK293 cells were cotransfected with 50 nM miR-92a mimic and 100 ng of luciferase reporter constructs containing wild-type (WT) or deleted (Del) CD69 3=UTR sequences.FireflyandRenillaluciferase activities were detected using the Dual-Glo luciferase assay system 72 h after transfection. The ratio of luciferase activities (Firefly/Renilla) was calculated and normalized to the wells transfected with only unmanipulated pmir-GLO vector. (D) miR-150 and miR-142-3p showed statistically significant downregulation in colonic LPLs from chronically SIV-infected macaques compared to uninfected control (Cont) macaques. Data were analyzed using the nonparametric Wilcoxon’s rank-sum test. The error bars represent standard errors of the means of fold changes within each group.
on November 7, 2019 by guest
http://jvi.asm.org/
[image:9.585.78.511.65.477.2]downregulated during T-cell activation (
28
,
29
). Further and
more importantly, miR-150 showed reduced expression at all
three time points in LPLs from jejunum (
Fig. 2C
,
3C
, and
4C
) and
colon (
Fig. 5D
). Similar to miR-150, miR-142-3p also showed
statistically significant downregulation in colonic LPLs of
chron-ically SIV-infected macaques (
Fig. 5D
). Since translocating
micro-bial products from a disrupted intestinal epithelial barrier can
activate LPLs via the TLR pathway, we focused on IRAK1, a serine/
threonine protein kinase and a critical component of the IL-1
receptor and TLR signaling pathways (
23
) predicted to be a direct
target of miR-150 (
22
). Specifically, miR-150 has four predicted
binding sites on the 3
=
UTR of IRAK1 mRNA that are conserved in
the human, chimpanzee, and rhesus macaque (see Table S2 in the
supplemental material) (
22
). Interestingly, miR-142-3p also has a
single predicted binding site on the 3
=
UTR of IRAK1 mRNA that
is highly conserved across several mammalian species (see Table
S2 in the supplemental material) (
22
). As shown in
Fig. 6A
,
cotransfection of pmirGLO-wtIRAK1 with 150 and
miR-142-3p mimic resulted in significant reduction (
⬃
40% for
miR-150 and
⬃
51% for miR-142-3p) in
Firefly/Renilla
ratios (
P
⫽
0.0001). In contrast, the cotransfection of pmirGLO-delIRAK1, in
which the predicted miR-150 and miR-142-3p binding sites were
deleted, abolished their inhibitory effect on IRAK1 (
Fig. 6A
)
re-porter gene activity. These results provide indirect evidence that
mml-miR-150 and mml-miR-142-3p can physically bind to the 3
=
UTR of IRAK1 and negatively regulate its expression. Although
both miRNAs showed significantly decreased expression, we
de-cided to focus on miR-150 over miR-142-3p owing to its high
relative abundance (
C
Tof 11 for miR-150 versus 13 for
miR-142-3p) (
Fig. 3B
and
4B
) in LPLs and the presence of multiple
pre-FIG 6(A) IRAK1 is a direct target of miR-150. Luciferase reporter vectors containing all four miR-150 binding sites (seed region) on the rhesus macaque 3=UTR of IRAK1 mRNA or the corresponding construct with the binding sites deleted were cotransfected into HEK293 cells with 50 nM miRNA mimic.FireflyandRenillaluciferase activities were detected using the Dual-Glo luciferase assay system 72 h after transfection. The ratio of luciferase activities (Firefly/Renilla) was calculated and normalized to the wells transfected with only unmanipulated pmir-GLO vector. Triple asterisks indicate statistical significance (P⬍0.001) compared to cells transfected with pmirGLO-delIRAK1 vector. IRAK1 protein expression is markedly elevated in the colon of chronic SIV-infected rhesus macaques (B and C) compared to that of the uninfected control macaque (D). Panels B, C, and D involve double labels with IRAK1 (green) and CD8 (red) for T cells. The gray channel represents differential interference contrast (DIC) to reveal tissue architecture. Colocalizations of green (IRAK1) and red (CD8) appear light yellow (arrows). In panels B and C, note the intense IRAK1 staining in the epithelium and lamina propria and markedly increased numbers of CD8⫹ IRAK1⫹T cells (white arrowheads) in the colon of the SIV-infected macaques. In contrast, panel D shows that IRAK1 staining is extremely weak in the colonic epithelium and LPLs of the control macaque. All panels are⫻40 magnification. Quantification of cells and regions of interest (ROI) labeled by IRAK1 was performed using Volocity 5.5 software after capturing images on a Leica confocal microscope. (E) Several ROI were hand drawn on the epithelial and LPL regions in the images from colon. Image analysis data were analyzed using nonparametric Wilcoxon’s rank-sum test. (F) miR-150 can negatively regulate IRAK1 protein expression. Representative Western blot (F) and quantification (G) show the reduction in protein expression of IRAK1 (⬃80 kDa) 96 h posttransfection of HEK293T cells with pre-miR-150-expressing plasmid (pEP-miR-150) (duplicate wells) compared to those transfected with pEP-Null control vector (duplicate wells). Kal is a marker (Bio-Rad kaleidoscope prestained marker).
on November 7, 2019 by guest
http://jvi.asm.org/
[image:10.585.41.540.63.401.2]dicted binding sites on the IRAK1 mRNA 3
=
UTR (
22
).
Accord-ingly, we next hypothesized that the decreased expression of
miR-150 in the LPLs would relieve the translational repression exerted
on IRAK1, resulting in their elevated protein expression. As
shown in
Fig. 6B
and
C
, IRAK1 protein expression was
signifi-cantly elevated in LPLs of chronically SIV-infected macaques.
Further, immunoprecipitation/Western blotting revealed
in-creased IRAK1 protein expression in colon and jejunum
longitu-dinally as disease progressed (see Fig. S3 in the supplemental
ma-terial). Using double labeling, CD8
⫹T cells were found to strongly
express IRAK1 (
Fig. 6B
and
C
). Image analysis also identified a
higher number of CD8
⫹T cells in the colonic lamina propria of
chronic SIV-infected macaques that also expressed IRAK1
com-pared to control macaques (45.4
⫾
7.8 versus 22.7
⫾
2.6). In
addition, elevated IRAK1 protein expression also was detected in
cells other than CD8
⫹T cells, possibly macrophages, B cells, and
dendritic cells (
Fig. 6B
and
C
). In contrast, IRAK1 protein
expres-sion was significantly weaker in the control macaque (
Fig. 6D
).
Further, image analysis clearly demonstrated quantitative
differ-ences in protein expression (
Fig. 6E
). While markedly elevated
IRAK1 protein expression was detected in both colon and
jeju-num, we have shown data from the colon, as it represents a major
contributor to microbial translocation owing to its large
concen-tration of bacterial (10
11to 10
12cells/g of intestinal contents) and
other microbial flora (
44
). Finally, the overexpression of miR-150
significantly reduced IRAK1 protein expression (
⬃
80 kDa),
strongly underscoring the possibility that miR-150 directly targets
IRAK1 through a negative feedback loop, and its downregulation
in LPLs during SIV infection may facilitate the persistence of a
chronic inflammatory environment in the intestine.
miR-150 and miR-142-3p expression is significantly
de-creased in both jejunal and colonic epithelium during chronic
SIV infection.
In addition to LPLs, the significantly elevated
IRAK1 protein expression in the colonic epithelium (
Fig. 6B
and
C
) prompted us to determine if similar reductions in miR-150 and
miR-142-3p expression occurred in the intestinal epithelium. As
shown in
Fig. 7A
and
B
, miR-150 and miR-142-3p expression
decreased significantly in both colonic and jejunal epithelium.
These findings suggest that as disease progresses, the diminished
expression of miR-150 and possibly miR-142-3p reduce the
con-straints exerted on IRAK1 protein translation, leading to its
ele-vated expression and in turn resulting in persistent inflammation,
inflammatory cytokine production, epithelial barrier disruption,
microbial translocation, and disease progression.
In vitro
blockade of peripheral blood CD8
ⴙT-cell activation
and proliferation with
⌬
9-THC significantly inhibited miR-150
downregulation and IRAK1 upregulation.
We recently
demon-strated that chronic
⌬
9-THC administration induced the
expres-sion of several anti-inflammatory miRNAs in the intestines of
SIV-infected macaques compared to those receiving vehicle (
45
).
In the same study, THC treatment prevented the downregulation
of miR-150 (
45
), indirectly suggesting that THC inhibits immune
activation by modulating miRNA expression. Although the
find-ings demonstrated translational relevance, it was unclear whether
THC exerted these effects directly or indirectly (
46
). To address
this question, we isolated and pretreated peripheral blood CD8
⫹T
cells with 15
M THC or vehicle (DMSO) for 30 min, followed by
activation
in vitro
with 40 nM PMA– 0.5
M ionomycin and
cul-ture for 24 h (
23
). This concentration of THC previously has been
shown to inhibit B-cell activation
in vitro
without reducing cell
viability (
46
). As shown in
Fig. 8
, THC treatment significantly
reduced the percentage of CD3
⫹CD8
⫹CD69
⫹(
Fig. 8 A
,
B
, and
D
) and CD3
⫹CD8
⫹Ki67
⫹(
Fig. 8C
and
E
) cells compared to the
level of vehicle (DMSO)-treated controls, suggesting strong
inhi-bition of T-cell activation and proliferation. The inhibitory effects
of THC on T-cell activation and proliferation are clearly visible in
Fig. 8F
, as evidenced by the presence of individual cells compared
to numerous cellular clumps (activation-induced adherence) in
vehicle-treated controls (
Fig. 8G
). Interestingly, pretreatment of
CD8
⫹T cells with THC also prevented the downregulation of
miR-150 (
Fig. 9A
; also see Table S3 in the supplemental material),
suggesting a direct effect. Note that in all 8 animals, the miR-150
C
Tvalues (see Table S3) are greater in vehicle-treated cells than in
cells treated with THC, suggesting rapid downregulation in
re-sponse to activation. Accordingly, we next hypothesized that
THC-mediated inhibition of miR-150 downregulation in CD8
⫹T
cells will prevent the upregulation of its predicted target, IRAK1.
We chose this immunomodulatory strategy to examine the
rela-tionship between miR-150 and its target, IRAK1, because of its
strong translational feasibility. As evidenced in
Fig. 9B
and
C
, the
prevention of miR-150 downregulation in THC-treated cells
re-sulted in reduced IRAK1 protein expression compared to that of
vehicle-treated controls, where IRAK1 protein showed
signifi-cantly elevated expression. Note that within each animal, IRAK1
expression is clearly higher in cells treated with vehicle than THC.
Overall, these findings strongly confirm miR-150 downregulation
in LPLs to be associated with immune cell activation and are not a
consequence of CD4
⫹T-cell depletion. Finally and most
impor-tantly, the ability of
⌬
9-THC to prevent miR-150 downregulation
and IRAK1 upregulation highlights the strong therapeutic
poten-tial of cannabinoids for the management of chronic immune
ac-tivation/inflammation, a hallmark of HIV/SIV infection.
DISCUSSION
The GI tract and intestinal immune system suffer significant
structural and functional damage during the course of HIV/SIV
infection. The LPL compartment, which is the effector arm of the
GI immune system, is enriched for viral target cells and
conse-quently is a major site of viral replication, CD4
⫹T-cell depletion,
and dissemination. Additionally, active viral replication in this
compartment stimulates increased proinflammatory cytokine/
chemokine production, which, in addition to amplifying the
in-flammatory reaction, also disrupts the intestinal epithelial barrier,
facilitating microbial translocation and chronic local and systemic
immune activation/inflammation (
1
,
2
). Consequently, the
nu-merous effector cells that traffic into this compartment directly
interact with cytokines and translocated microbial products,
re-sulting in their persistent hyperactivation, thus setting up a vicious
cycle involving viral replication, immune
activation/inflamma-tion, epithelial barrier disrupactivation/inflamma-tion, and microbial translocation
that eventually leads to AIDS progression. To better understand
the molecular pathological networks/mechanisms underlying
HIV/SIV-induced GI disease/dysfunction, we recently described
differential gene expression separately in LPLs and epithelial cells
at 21 and 90 dpi (
20
,
21
). While differential gene expression is
central to immune cell differentiation and activation, it is
regu-lated in a synchronized fashion with contributions from
tran-scription factors, histone-modifying enzymes, DNA methylation,
chromatin remodeling complexes, chromatin-interacting protein
kinases, and so on. Recently, miRNAs have emerged as potent
on November 7, 2019 by guest
http://jvi.asm.org/
posttranscriptional regulators of gene expression, and increasing
evidence suggests a critical role for these small regulatory RNAs in
controlling several aspects of the immune/inflammatory response
(
5–8
). To investigate the posttranscriptional regulation of the
im-mune/inflammatory response to SIV infection in the intestine, we
collected serial jejunal resection segments and isolated and
pro-filed miRNA expression exclusively in LPLs at 21, 90, and 180 dpi.
This approach helped identify several miRNAs previously linked
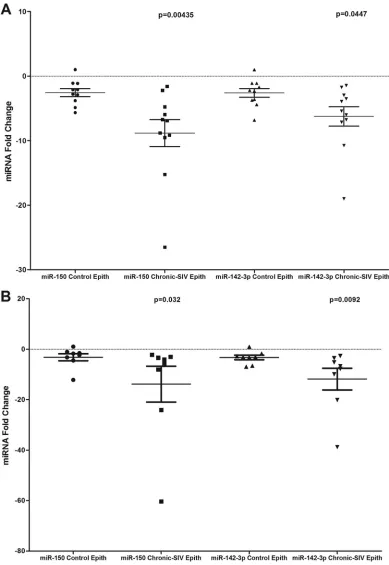
FIG 7miR-150 and miR-142-3p expression is significantly (P⬍0.05) downregulated in colonic (A) and jejunal (B) epithelium (Epith) of chronically SIV-infected rhesus macaques compared to those of uninfected controls. Data were analyzed using the nonparametric Wilcoxon’s rank-sum test. The error bars represent standard errors of the means of fold changes within each group.on November 7, 2019 by guest
http://jvi.asm.org/
[image:12.585.97.486.65.630.2]to innate and adaptive immune responses, including the reduced
expression of at least four miRNAs previously associated with
T-cell activation in the intestine at 90 and 180 dpi. Further, CD69
was validated as a direct target of miR-92a, and miR-150 and
miR-142-3p expression was significantly downregulated in both
LPLs and epithelium during chronic SIV infection. Decreased
miR-150 expression was associated with elevated protein
expres-sion of IRAK1 in both colonic epithelium and LPLs, highlighting a
very important link between perturbations in miRNA levels and
the establishment of persistent inflammation/immune activation
in the intestine.
Among the 22 DE miRNAs identified in LPLs at 21 dpi,
miR-18a and miR-363, belonging to the miR-17-92 and miR-106a-363
cluster, showed enhanced expression and previously were linked
to early CD8
⫹T-cell proliferation and clonal expansion (
25
,
26
).
In addition, the induction of miR-212 was shown to occur during
macrophage activation (
27
). In contrast, at 90 and again at 180
dpi,
ⱖ
75 to 86% of the DE miRNAs showed decreased expression.
At least four miRNAs, miR-15b, miR-142-3p, miR-142-5p, and
miR-150, previously shown to be significantly decreased during
CD4
⫹and CD8
⫹T-cell activation (
28
,
29
), showed consistent
downregulation at both 90 and 180 dpi. Further, other members
of the miR-17-92 cluster and their paralogs, miR-18a, miR-19b,
miR-20a, miR-20b, miR-92a, and miR-106a, showed significantly
reduced expression at 90 or 180 dpi or both. Interestingly,
miR-146b-5p (
P
⫽
00873), an LPS-responsive miRNA, showed
statis-tically nonsignificant elevation at 180 dpi. Recent
in vitro
studies
showed miR-146b-5p to be significantly upregulated following
LPS treatment of THP monocytes; however, they showed delayed
kinetics (
39
). This raised the question of whether translocated
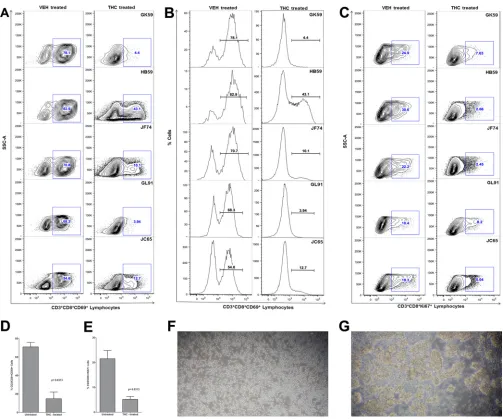
FIG 8THC inhibits CD8⫹T-cell activationin vitro. THC-treated CD8⫹T cells show significantly reduced expression of the lymphocyte activation marker CD69 (A and B) and proliferation marker Ki67 (C). Note the significantly reduced percentage of CD3⫹CD8⫹CD69⫹and CD3⫹CD8⫹Ki67⫹cells in all five animals 24 h afterin vitroactivation with PMA-ionomycin. Mean percentages of CD8⫹CD69⫹(D) and CD8⫹Ki67⫹(E) are significantly lower in THC-treated than in vehicle (VEH)-treated cells. THC-mediated inhibition ofin vitroCD8⫹T-cell activation (A and B) and proliferation (C) in response to PMA-ionomycin stimulation is evidenced by the absence of cellular clumps (F) compared to cells treated with vehicle (DMSO) (G). The error bars represent standard errors of the means of fold changes within each group.on November 7, 2019 by guest
http://jvi.asm.org/
[image:13.585.41.544.63.482.2]luminal bacteria and their products in the lamina propria (
47
) are
triggering miR-146b-5p upregulation. To address this question,
we isolated intestinal and bone marrow macrophages and found
significantly elevated miR-146b-5p expression following a 16-h
LPS treatment
in vitro
. At all time points, 501-5p and
190b showed elevated expression. We recently characterized
miR-190b in the intestine and found its expression to be significantly
upregulated throughout SIV infection (
15
). Further, we also
dem-onstrated its upregulation to be driven by viral replication and not
immune/inflammatory responses accompanying viral
replica-tion (
15
). Similarly, miR-150, miR-199a-5p, and miR-199b-5p
showed differential expression at all time points but at a
signifi-cantly reduced level. The downregulation of miR-150, particularly
in CD4
⫹T-cell activation (
29
), also may promote viral
replica-tion, as it has been demonstrated to exert anti-HIV effects by
directly targeting HIV (
48
) and, possibly, SIV RNA. Similar to
several previous studies that have linked miR-150 downregulation
to T-cell (
28–30
) and B-cell (
31
,
32
) activation, a recent study in
IBS patients found decreased miR-199a-5p and miR-199b-5p to
result in chronic visceral pain and nociception (
33
). The study also
suggested that the downregulation of both miRNAs is driven in
response to colonic inflammation (
33
). Unlike colon (
16
), we did
not detect elevated miR-34a expression in jejunum LPLs. This
may be due to our previous finding that HIV/SIV impacts the
colon more severely than the jejunum (
18
,
19
). Overall, these
find-ings are novel, as they identify a potential role for specific miRNAs
in key pathogenic events during HIV/SIV infection, such as
im-mune activation (15b, 142-3p, 142-5p, and
miR-150) and microbial translocation (miR-146b-5p). Finally and
more importantly, these findings would not have been possible
had we used intact intestinal segments.
Previous and more recent studies have demonstrated that with
the exception of a few (miR-155 and miR-29b), the expression of
most miRNAs is downregulated during T-cell activation (
6
). This
global miRNA downregulation was shown to be caused by
selec-tive ubiquitylation and proteosomal degradation of AGO2
(Argo-naute proteins), a critical component of the miRNA processing
machinery (
29
). Additionally, to evade the silencing effect of a few
upregulated miRNAs (miR-155 and miR-29b), activated T cells
have been shown to transcribe mRNAs with shortened 3
=
UTRs
through alternative polyadenylation (
49
). A shortened 3
=
UTR can
protect mRNAs from miRNA-mediated silencing, as most