Research, part of a Special Feature on Programme on Ecosystem Change and Society (PECS): Knowledge for Sustainable Stewardship of Social-ecological Systems
Elasticity in ecosystem services: exploring the variable relationship between
ecosystems and human well-being
Tim M. Daw 1, Christina C. Hicks 2,3,4, Katrina Brown 5, Tomas Chaigneau 5, Fraser A. Januchowski-Hartley 6, William W. L. Cheung 7, Sérgio Rosendo 8,9, Beatrice Crona 1,10, Sarah Coulthard 11, Chris Sandbrook 12,13, Chris Perry 6, Salomão Bandeira 14, Nyawira A. Muthiga 15,16, Björn Schulte-Herbrüggen 1, Jared Bosire 17 and Tim R. McClanahan 15
ABSTRACT. Although ecosystem services are increasingly recognized as benefits people obtain from nature, we still have a poor understanding of how they actually enhance multidimensional human well-being, and how well-being is affected by ecosystem change. We develop a concept of “ecosystem service elasticity” (ES elasticity) that describes the sensitivity of human well-being to changes in ecosystems. ES Elasticity is a result of complex social and ecological dynamics and is context dependent, individually variable, and likely to demonstrate nonlinear dynamics such as thresholds and hysteresis. We present a conceptual framework that unpacks the chain of causality from ecosystem stocks through flows, goods, value, and shares to contribute to the well-being of different people. This framework builds on previous conceptualizations, but places multidimensional well-being of different people as the final element. This ultimately disaggregated approach emphasizes how different people access benefits and how benefits match their needs or aspirations.
Applying this framework to case studies of individual coastal ecosystem services in East Africa illustrates a wide range of social and ecological factors that can affect ES elasticity. For example, food web and habitat dynamics affect the sensitivity of different fisheries ecosystem services to ecological change. Meanwhile high cultural significance, or lack of alternatives enhance ES elasticity, while social mechanisms that prevent access can reduce elasticity.
Mapping out how chains are interlinked illustrates how different types of value and the well-being of different people are linked to each other and to common ecological stocks. We suggest that examining chains for individual ecosystem services can suggest potential interventions aimed at poverty alleviation and sustainable ecosystems while mapping out of interlinkages between chains can help to identify possible ecosystem service trade-offs and winners and losers. We discuss conceptual and practical challenges of applying such a framework and conclude on its utility as a heuristic for structuring interdisciplinary analysis of ecosystem services and human well-being.
Key Words: coastal ecosystems; conceptual framework; East Africa; environmentalists’; fisheries; mangroves; paradox;
INTRODUCTION
The Millennium Ecosystem Assessment (MA) conceptualized ecosystem services as contributions from nature to human well-being and drew on the “capability approach” proposed by scholars such as Amartya Sen (MA 2003, Robeyns 2005). This provided a broad conceptualization of well-being, including security, material assets, health, social relations, and freedom. In their recent review of well-being frameworks, Agarwala et al. (2014) describe how, in the context of ecosystem services, interest in the concept of multidimensional well-being evolved in response to limited mono-dimensional assessments, which were largely monetary and value-based. They argue that this is analagous to the development of a multidimensional understanding of poverty (Alkire 2007), which represents the opposite to well-being. They also acknowledge the challenge of engaging with such a more
complex vision of people’s lives. The concept of well-being is becoming increasingly central to research and policy on ecosystem services, and sustainability in general (Bizikova 2011). As Milner-Gulland et al. (2014) posit, engaging with human well-being may enable better outcomes for nature conservation by taking account of a broader spectrum of gains and losses as well as greater incorporation of people’s views and needs. Although many different frameworks exist for the study of well-being (e.g., OECD 2011, Oxfam 2013), there seems to be consensus that any measure of well-being should include both an objective measure of a person’s welfare, alongside a subjective evaluation of how a person thinks and feels about the quality of life they are experiencing (Gough and McGregor 2007, UN 2012). This clearly calls for integrative approaches combining quantitative and qualitative data (McGregor et al. 2015). Despite this interest and
1Stockholm Resilience Centre, Stockholm University, Stockholm, Sweden, 2Lancaster Environment Centre, Lancaster University, UK, 3Center for
Ocean Solutions, Stanford University, Monterey, California, USA, 4ARC Center of Excellence for Coral Reef Studies, James Cook University,
Townsville, Queensland, Australia, 5Environment and Sustainability Institute, University of Exeter, Penryn, Cornwall, UK, 6Geography, College of
Life and Environmental Sciences, University of Exeter, Exeter, UK, 7Nippon Foundation-Nereus Program, Institute for the Oceans and Fisheries,
The University of British Columbia, Vancouver, B.C., Canada, 8School of International Development, University of East Anglia, Norwich, UK, 9Centro Interdisciplinar de Ciências Sociais - Faculdade de Ciências Sociais e Humanas - Universidade Nova de Lisboa (CICS.NOVA.FCSH/UNL),
Lisbon, Portugal, 10Global Economic Dynamics and the Biosphere, Royal Swedish Academy of Science, Stockholm, Sweden, 11Northumbria
University, Newcastle upon Tyne, UK, 12United Nations Environment Programme World Conservation Monitoring Centre, Cambridge, UK, 13Department of Geography, University of Cambridge, Cambridge, UK, 14Department of Biological Sciences, Universidade Eduardo Mondlane,
Maputo, Mozambique, 15Wildlife Conservation Society, Marine Program, Bronx, New York, USA, 16Wildlife Conservation Society, Marine Program
conceptual progress, significant gaps remain in our understanding of how ecosystems actually contribute to different people’s well-being (Butler and Oluoch-Kosura 2006, Carpenter et al. 2009) and to alleviation of multidimensional and dynamic poverty (Alkire 2007). This lack of understanding has particular implications for poor people who are often more reliant on ecosystems for their food, physical security, and livelihoods (Duraiappah 2004, Bizikova 2011) and disproportionately affected by changes in ecosystem services.
The ecosystem service concept alludes to a positive relationship between ecosystem quality and human well-being[1]. However, this
relationship is complex and often indirect with the result that the well-being of people in particular places and times can be more or less coupled to ecosystem quality. For example, although it is clear at the aggregate global scale and in the long run, that humanity depends on the biosphere for survival (Dasgupta 2001), aggregate indicators of human well-being at the global scale appear to show that well-being has improved over recent years despite the ongoing degradation of ecosystems, a phenomenon referred to as the “environmentalist’s paradox'” (Raudsepp-Hearne et al. 2010). At smaller scales, people may experience improvements in well-being in the face of ecosystem degradation, when this enhances the opportunities for human development (e.g., Wunder 2001). Conversely, conservation may enhance ecosystems with little benefit, or even harm to the well-being of local people, for example by exclusion from reserves (Dowie 2011, Kamat 2014) or where “ecosystem disservices” such as crop raiding by wild animals impact local farmers (Woodroffe et al. 2005). Such examples of a negative relationship between ecosystem health and human well-being may represent temporal or spatial effects, either that degradation will impact the well-being of people in the future, or in other places, or that benefits from ecological enhancement take time to materialize or are enjoyed by distant beneficiaries. However, what these examples demonstrate is that in particular places and times, and for particular people, the relationship between ecosystem quality and human well-being is variable and complex.
We can refer to the human-well-being impacts of ecological change using the concept of “elasticity,” which captures the responsiveness of one variable to changes in another (York et al. 2003). For example, in economics, the price elasticity of demand captures how much demand will change in response to a change in price. Here we apply the concept of elasticity to ecosystem services and explore the elasticity of human well-being to ecosystem change (henceforth “ES elasticity”), i.e., how human well-being changes in response to increases or declines in ecosystem quality. We propose that studying ES elasticity challenges us to engage with the complexities and context dependency of the ecosystem-well-being relationship, and can facilitate a better understanding of the role of ecosystem services in human well-being.
INTRODUCING ES ELASTICITY
Elasticity describes how one variable changes in relation to changes in another, and thus ES elasticity can be formally represented as the following:
ES Elasticity = change in well-being / change in ecosystem stocks
Thus high, positive elasticity means that human well-being is strongly coupled to changes in ecosystem quality and people strongly benefit when ecosystem quality improves and suffer when quality declines. Examples of high, positive elasticity include when
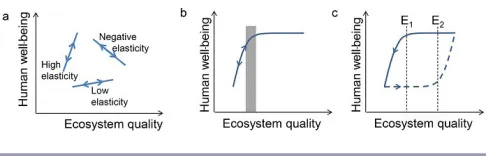
[image:2.612.315.558.324.402.2]the loss of storm protection services from mangroves severely impacts coastal people’s security (e.g., Das and Vincent 2009), or when successful conservation of charismatic species promotes the livelihoods of tour guides. Meanwhile, low elasticity means that changing ecosystem quality has minor or negligible impacts on well-being, for example, when people are decoupled from the ecosystem because of alternatives or substitutes. Negative ES elasticity describes situations, like the environmentalist’s paradox, in which people’s well-being actually improves as ecosystem quality declines or people suffer as ecosystem quality improves (Fig. 1a). For the rest of this paper we use the term “high ES elasticity” to refer to high positive ES elasticity.
Fig. 1. The ecosystem quality elasticity of human well-being (ES elasticity). (a) Examples of high, low, positive, and negative elasticities. (b) A threshold (shaded) in the ecosystem quality-well-being relationship leading to different elasticities at different levels of ecosystem quality. (c) Hysteresis in the ecosystem quality-well-being relationship such that elasticity is different when ecosystem quality is declining from when ecosystem quality is increasing.
ES Elasticity will vary depending on the nature of the ecosystem-well-being link such that explaining or even forecasting ES elasticity challenges us to better understand both ecological and social dimensions, and context of such linkages. Elasticity has important implications for environmental management and poverty alleviation. Prescriptions for community-based conservation presuppose a self-evident and universally experienced positive elasticity that creates the necessary incentives for conservation (Roe et al. 2012). However, this may overlook or underplay the importance of delayed effects, trade-offs, and social disparities in terms of who benefits. Where conservation efforts are characterized by low or negative ES elasticity for some people, they may resist or sabotage such efforts. An example is the widespread low compliance with fisheries regulations and marine protected areas in the tropics (Wood et al. 2008). Thus failure to recognize or address low or negative ES elasticity can ultimately lead to failures in conservation initiatives (McClanahan 1999, Pascual et al. 2014).
ES Elasticity is also core to understanding human vulnerability to environmental change and factors that are critical to adaptation. Low elasticity for example, would be desirable, for example, where climate change impacts degrade ecosystems, to minimize the harm experienced by people as a result of this degradation. Conversely, high elasticities would be desirable in situations of ecological rehabilitation and recovery, so that people benefit as much as possible from improving ecosystem services and are also incentivized to support continued rehabilitation.
(Fig. 1a), there is little evidence to suggest that this relationship will be a straight line. Rather, research into social-ecological systems has shown nonlinear relationships and thresholds to be common (Liu et al. 2007, Barbier et al. 2008, Barrett and Constas 2014). For example, people’s well-being may be relatively unaffected by initial losses of ecosystem quality, but below a certain threshold, further degradation leads to the breakdown of critical functions impacting well-being. This results in a nonlinear relationship in which elasticity is low when ecosystem condition is good but increases sharply (steeper line) when ecosystem condition is below a certain threshold (Fig. 1b).
Hysteresis and path dependency are also common features of complex social-ecological systems (Scheffer et al. 2001). For example, Figure 1c could illustrate a situation in which well-being benefits from a cultural ecosystem service, which in turn depends on skills and other intellectual assets that are lost when ecosystem quality falls below some threshold level (E1). Subsequent recovery
of ecosystem quality would not contribute to improving well-being in the absence of these assets, which may only recover (if at all) at higher levels (E2) of ecosystem quality. Thus the
expectation of nonlinear changes in social-ecological systems emphasizes the importance of context and history. ES elasticity may depend not only on the current state of ecosystems but also recent history.
ES elasticity can be applied to different units of analysis and at different scales. The environmentalist’s paradox has been investigated as an aggregate system-level attribute at a global scale, but given the importance of individual experiences and circumstances for the understanding of well-being (Coulthard et al. 2011), research will also be needed that can capture the differences between groups of people, based in terms of their relationship to, and dependence on, different processes or components of the ecosystem. For example, ES elasticity will be higher for people with ecosystem-based livelihoods than people not directly dependent on local ecosystems. These individual elasticities will be affected by the range of individual assets and the institutional arrangements that determine how individuals and groups benefit from nature (e.g., Leach et al. 1999, Ribot and Peluso 2003, Hicks and Cinner 2014). When there are improvements in ecological quality people endowed with “mechanisms of access” (Ribot and Peluso 2003) stand to benefit more than those denied access. Thus disaggregated analysis of ES elasticity is likely to show contrasting patterns for different groups of people. Such that high positive and negative ES elasticity may be found among different stakeholders within the same system creating trade-offs and dilemmas in policy choices.
Although much research has focused on factors affecting the supply of ecosystem services, less attention has been given to the demand side (Lele et al. 2013, García-Nieto et al. 2013). Elasticity will be affected by these contextual factors, such as the availability of and access to alternatives to ecosystem services, such as nonecosystem-based employment, imported foods, technological innovations, or nonecosystem based social practices, that may compensate for declines in local ecosystem services (MA 2003)[2]
and will reduce ES elasticity for people who have access to them. Additionally, many ecosystem services may only contribute to well-being under particular circumstances (Andersson et al. 2015). For example, wild foods may only be important during
times of food shortage, storm protection during storms, and cultural services in the context of a culture that regards them as significant. In such cases, ES elasticity would only be high when circumstances supporting the demand side of ecosystem services are present.
A CONCEPTUAL FRAMEWORK TO INTERROGATE ELASTICITY
The previous section highlighted that ES elasticity can be determined by a range of social, ecological, historical, or contextual factors. Thus advancing understanding of ES elasticity requires an interdisciplinary effort that integrates the strengths of existing literature on production, trade-offs, and valuation of ecosystem services and the growing literature on human well-being and its connection to natural resources. Taken alone, each of these branches of the ecosystem services literature is insufficient to explain ES elasticity because of a partial view over the ecosystem-well-being relationship. For example landscape-scale modeling of ecosystem services has led to an improved understanding of generation of different ecosystem services (e.g., Goldstein et al. 2012) but has generally not evaluated how these services actually contribute to people’s well-being. Ecosystem service valuations based on aggregate measures of willingness-to-pay such as market prices, provide indications of the welfare value of ecosystem services, but are criticized for downplaying nonmonetary aspects of well-being, failing to disaggregate to reflect how benefits are distributed in society, and being based on market prices that are skewed to reflect preferences of the wealthy. Meanwhile frameworks for the study of well-being are now being applied to assess specific ecosystem service contributions to different aspects of life (e.g., Abunge et al. 2013), and the impacts of conservation (Milner-Gulland et al. 2014), but the majority of well-being research has limited appreciation for ecological dynamics and change. Meanwhile, studies that explicitly relate well-being to ecological change are often correlational and lack a specific theory of causation or experimental evidence of how particular ecosystem services actually contribute to well-being (e.g., McNally et al. 2011).
This section presents a conceptual framework that explicitly maps out the social and ecological links between ecosystems and well-being for different beneficiaries, and aims to understand how the well-being contribution of ecosystem services is shaped by people’s individual condition and context over time. We acknowledge that a plethora of ecosystem service conceptual frameworks (e.g., Costanza et al. 2007, Bateman et al. 2011, Fisher et al. 2013, Reyers et al. 2013, Díaz et al. 2015) have been developed to facilitate thinking about the complex reality of ecosystem services. However, most frameworks generally have focused on specification of the ecological generation of ecosystem services to the detriment of understanding how they actually contribute to well-being (Fisher et al. 2013).
Fisher et al. (2014) but incorporate these into a more linear flow like the cascade, while maintaining an emphasis on the disaggregation of beneficiaries (Daw et al. 2011).
[image:4.612.315.555.152.426.2]This framework shown in Figure 2 represents a chain of elements (a-f) that link from Ecosystem Stocks to Well-being Contribution. These are listed in Table 1. (For clarity, references to elements and multipliers are formatted as bold and italics, respectively). Each element has an influence on the next and the degree of this influence can be conceptualized as a component of ES elasticity. This breaks down overall ES elasticity between ecological stocks and well-being into subelasticities between each pair of elements. For example, elasticity of Flow (b) to Ecosystem Stocks (a) can be represented as the change in Flows (b) divided by change in Ecosystem Stocks (a).
Fig. 2. A framework to interrogate ecosystem-well-being relationships and shed light on factors affecting ecosystem service elasticity. Ecosystem services are represented as a chain of elements (a-f) that link ecosystem stocks to well-being (See Table 1 for definitions, Table 2 for examples, and text for further elaboration).
Eb,a = Δb / Δa
and the product of the elasticities between elements ultimately determines how people’s well-being is influenced by changes to Ecosystem Stocks, i.e., overall ES elasticity:
ES elasticity (Ef,a) = Eb,a x Ec,b x Ed,c x Ee,d x Ef,e = Δf / Δa
This explicitly acknowledges that ES elasticity can be affected by any of the biophysical or social processes along this chain.
Elasticity between the elements (a-f) is influenced by five “multipliers” (i-v) that represent the things that explain or parameterize the relationship between adjacent elements. For example Flows (b) interact with Human Inputs (ii) to determine the quantity of Goods (c):
Goods (c) = f ( Flows [b], Human inputs [ii] )
Thus the multipliers are critical for determining the elasticity between adjacent elements and together, the ES elasticity of the overall chain between Ecosystem Stocks and Well-being Contribution.
The framework follows the cascade and MA frameworks, with arrows and an implied causality running from left (ecology) to right (well-being). This reflects our focus on elasticity and how ecosystem change can affect well-being. However, as emphasized in more social-ecological conceptualizations of ecosystem services (e.g., Reyers et al. 2013), causal influences in the other direction (“feedbacks” in Fig. 2), are important for the development of ecosystem quality and human well-being over
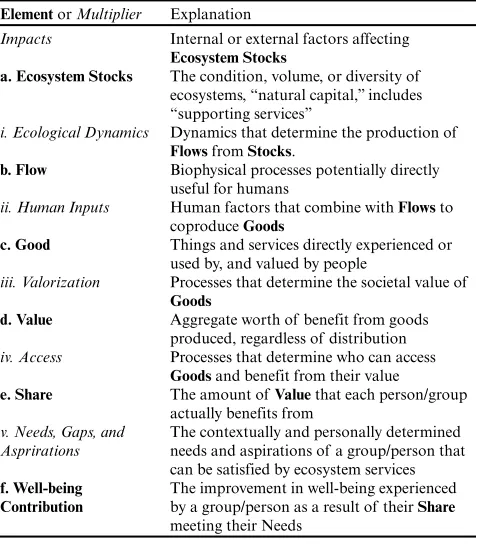
Table 1. Explanations and examples for the elements and multipliers. For clarity, references to elements and multipliers are formatted as bold and italics, respectively. See Table 2 for examples.
Element or Multiplier Explanation
Impacts Internal or external factors affecting
Ecosystem Stocks
a. Ecosystem Stocks The condition, volume, or diversity of ecosystems, “natural capital,” includes “supporting services”
i. Ecological Dynamics Dynamics that determine the production of
Flows from Stocks.
b. Flow Biophysical processes potentially directly
useful for humans
ii. Human Inputs Human factors that combine with Flows to
coproduce Goods
c. Good Things and services directly experienced or
used by, and valued by people
iii. Valorization Processes that determine the societal value of
Goods
d. Value Aggregate worth of benefit from goods
produced, regardless of distribution
iv. Access Processes that determine who can access
Goods and benefit from their value
e. Share The amount of Value that each person/group
actually benefits from v. Needs, Gaps, and
Asprirations
The contextually and personally determined needs and aspirations of a group/person that can be satisfied by ecosystem services
f. Well-being Contribution
The improvement in well-being experienced by a group/person as a result of their Share meeting their Needs
time. For example, extraction of Goods impacts Ecosystem Stocks, while Valorization incentivizes and thus drives Human Inputs.
Ecosystem Stocks (a) represent natural capital or ecological assets (Bateman et al. 2011), affected by a wide range of impacts that may be external to this particular chain, such as climate change-driven disturbance or infrastructure development, or that represent feedback from within the chain, such as extraction of Goods. Stocks could be represented by a single indicator of ecosystem quality, e.g., live coral cover, but it may be more appropriate to include a range of processes and interactions within Stocks. For example, supporting services that maintain structure and functionality of ecosystems (Mace et al. 2012) would be included within Ecosystem Stocks because they do not directly contribute to well-being.
Flows (b), the biophysical processes that are potentially directly useful for humans are equivalent to Mace et al.’s (2012) “final services.” They are generated by, but are importantly distinct from Ecological Stocks (Vira and Adams 2009). The complex and multifaceted relationship between the two (Mace et al. 2012) is represented by the multiplier Ecological Dynamics (i), which encompasses variable production functions or biodiversity-ecosystem service relationships (Mora et al. 2014).
[image:4.612.55.294.335.441.2]biophysical, but are coproduced from Flows by Human Inputs (ii) (Lele et al. 2013) such as labor, capital, or the presence of people to appreciate or benefit from them.
The Value (d) of Goods is an aggregate indication of the total value of benefits generated by an ecosystem service, as calculated by standard valuation, although it could also be calculated in nonmonetary terms. Value is determined by societal process of Valorization (iii), such as the structure of markets, or cultural norms (Bateman et al. 2011). As such, Valorization represents the demand side of ecosystem services at an aggregate level and the contextual conditions that lead Goods to be of more or less interest and/or use to society in general.
Ecological Stocks, Flows, Goods, and Value (a-d) generally reflect the cascade model used for ecosystem service valuation (de Groot et al. 2010, Bateman et al. 2011) and are aggregate quantities. In contrast to the cascade model, Value (an aggregate quality) is not the final outcome, but is further mediated by Share and Well-being Contribution that focus on who accesses Value and how it contributes to their well-being (Coulthard et al. 2011, Daw et al. 2011). Thus the aggregate processes of Valorization are distinguished from the disaggregated processes of Access, and Needs, Gaps, and Aspirations that determine the Well-being Contribution of ecosystem services for different kinds of people.
Valorization may in some cases reflect the Needs, Gaps, and Aspirations of the same local people who benefit from Well-being Contribution. For example, in an assessment of local cultural ecosystem services Valorization is linked to both Access, and Needs, Gaps, and Aspiration of the same local people benefiting from the cultural ecosystem service (see sense of place example in Table 2). In contrast, Valorization of traded ecosystem services reflects motivations and aspirations of a different and often distant group of people. For example the market price of aquarium fish is determined by the aspirations of distant consumers as well as the availability of substitutes from other regions or aquaculture. This case illustrates why, for a disaggregated analysis, Valorization is considered independently from the Needs, Gaps, and Aspirations, of local people.
Share (e) is an explicit expression of the absolute amounts of Value received by different people, and is determined by the Access (iv), which represents the assets, institutions, laws, social norms, and structures (such as class, gender, ethnicity) that give people the ability to benefit from ES (Leach et al. 1999, Ribot and Peluso 2003). Access reflects power dynamics, for example as people compete to capture Shares or when governance structures impose limits on Access to reduce impacts on Ecosystem Stocks.
Well-being Contribution (f), reflects how an ecosystem service actually translates into well-being outcomes for an individual or group of beneficiaries. Well-being Contribution incorporates an assessment of the well-being of different beneficiaries (size of the circles in Fig. 2) as well as the proportional contribution to well-being from ecosystem services. In this framework, well-well-being is portrayed as the combination of needs met (a quantitative measure of the extent to which an individual, within a household, is able to sufficiently meet a predetermined list of basic needs) and life satisfaction (the person’s subjective evaluation of how they are doing); the latter is captured methodologically through life satisfaction scoring, and more in-depth interviews.
Assessment of a person’s well-being, even combined with an assessment of Shares is not sufficient to evaluate how ecosystem services actually contribute to well-being. This requires understanding of the individual circumstances that mean that a Share translates into a Well-being Contribution. As emphasized by the capability approach of Sen and others, “different people need different amounts of and different kinds of goods to reach the same levels of well-being” (Robeyns 2005:97). Hence Needs, Gaps, and Aspirations (v) constitute the multiplier between Share and Well-being Contribution and aims to capture the individual circumstances that determine whether a Share contributes to well-being. Needs, Gaps, and Aspirations incorporates objective and subjective dimensions that are affected by internal factors, such as personal illness or disability and individual preferences, as well as external factors such as substitutes, e.g., imported food, and events, e.g., storms, that affect what an individual or group needs from ecosystems. Needs, Gaps, and Aspirations thus reflect the demand side of ecosystem services on a more individual basis than Valorization.
The distinction between Access and Needs, Gaps, and Aspirations are illustrated by comparing a rich person with Access to wild foods but who does not benefit because they have no Need for them to a poor person who has a Gap in their nutritional security, but lacks Access to wild foods and hence has no Share. In both cases, wild foods make a limited contribution to well-being, but this is due to Needs, Gaps, and Aspirations in one case and Access in the other. In this sense Access represents the ability of people to benefit from Share, whether or not that ability is realized, and echoes Sen’s (2001) concept of capabilities as distinct from functionings. Where Needs, Gaps, and Aspirations are low, patterns of Access may not be obvious. However, if Needs, Gaps, and Aspirations increase, e.g., during a food shortage, patterns of Access may become more obvious as people struggle to benefit from the available Value.
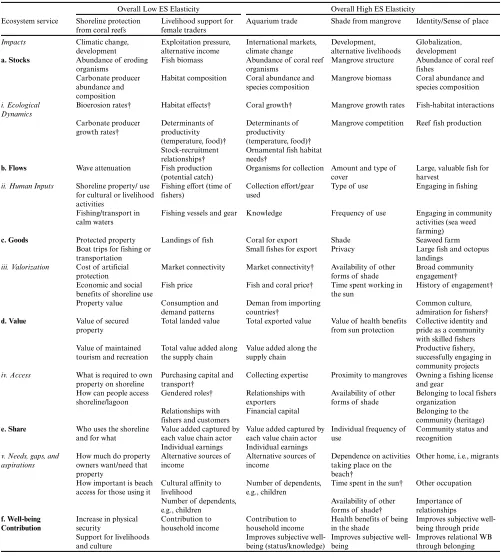
Table 2. Five coastal ecosystem services from East Africa (see Box 1) mapped out using the chain framework, with examples of low and high ES elasticity deriving from different parts of each chain. Multipliers contributing to low or high overall ES elasticity are marked with †.
Overall Low ES Elasticity Overall High ES Elasticity Ecosystem service Shoreline protection
from coral reefs
Livelihood support for female traders
Aquarium trade Shade from mangrove Identity/Sense of place
Impacts Climatic change,
development Exploitation pressure, alternative income International markets, climate change Development, alternative livelihoods Globalization, development
a. Stocks Abundance of eroding
organisms
Fish biomass Abundance of coral reef organisms
Mangrove structure Abundance of coral reef fishes
Carbonate producer abundance and composition
Habitat composition Coral abundance and species composition
Mangrove biomass Coral abundance and species composition
i. Ecological Dynamics
Bioerosion rates† Habitat effects† Coral growth† Mangrove growth rates Fish-habitat interactions
Carbonate producer growth rates† Determinants of productivity (temperature, food)† Determinants of productivity (temperature, food)†
Mangrove competition Reef fish production
Stock-recruitment relationships†
Ornamental fish habitat needs†
b. Flows Wave attenuation Fish production
(potential catch)
Organisms for collection Amount and type of cover
Large, valuable fish for harvest
ii. Human Inputs Shoreline property/ use
for cultural or livelihood activities
Fishing effort (time of fishers)
Collection effort/gear used
Type of use Engaging in fishing
Fishing/transport in calm waters
Fishing vessels and gear Knowledge Frequency of use Engaging in community activities (sea weed farming)
c. Goods Protected property Landings of fish Coral for export Shade Seaweed farm
Boat trips for fishing or transportation
Small fishes for export Privacy Large fish and octopus landings
iii. Valorization Cost of artificial
protection
Market connectivity Market connectivity† Availability of other forms of shade
Broad community engagement† Economic and social
benefits of shoreline use
Fish price Fish and coral price† Time spent working in the sun
History of engagement†
Property value Consumption and demand patterns
Deman from importing countries†
Common culture, admiration for fishers†
d. Value Value of secured
property
Total landed value Total exported value Value of health benefits from sun protection
Collective identity and pride as a community with skilled fishers Value of maintained
tourism and recreation
Total value added along the supply chain
Value added along the supply chain
Productive fishery, successfully engaging in community projects
iv. Access What is required to own
property on shoreline
Purchasing capital and transport†
Collecting expertise Proximity to mangroves Owning a fishing license and gear
How can people access shoreline/lagoon
Gendered roles† Relationships with exporters
Availability of other forms of shade
Belonging to local fishers organization
Relationships with fishers and customers
Financial capital Belonging to the community (heritage)
e. Share Who uses the shoreline
and for what
Value added captured by each value chain actor
Value added captured by each value chain actor
Individual frequency of use
Community status and recognition
Individual earnings Individual earnings v. Needs, gaps, and
aspirations
How much do property owners want/need that property
Alternative sources of income
Alternative sources of income
Dependence on activities taking place on the beach†
Other home, i.e., migrants
How important is beach access for those using it
Cultural affinity to livelihood
Number of dependents, e.g., children
Time spent in the sun† Other occupation
Number of dependents, e.g., children
Availability of other forms of shade†
Importance of relationships
f. Well-being Contribution
Increase in physical security
Contribution to household income
Contribution to household income
Health benefits of being in the shade
Improves subjective well-being through pride Support for livelihoods
and culture
Improves subjective well-being (status/knowledge)
Improves subjective well-being
of alternative shade. Identity and sense of place of fishers would be sensitive to an inability to maintain catches of large fish because of Valorization by the community (high Goods-Value elasticity) particularly for fishers whose identity and standing within the community depends on fishing (Access) and who lack alternative sources of pride or respect (lack of alternatives leading to high Share-Well-being Contribution elasticity).
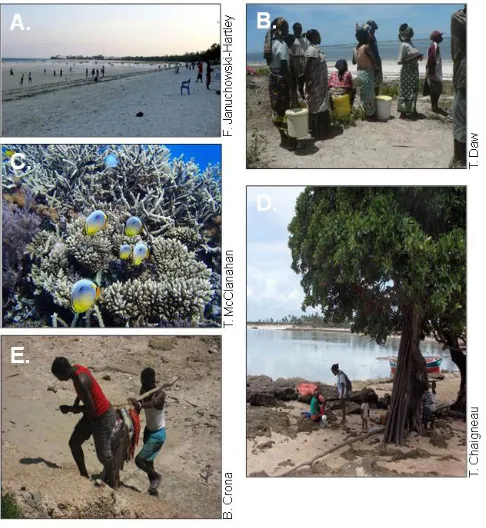
Fig. 3. Images representing the five ecosystem services in Table 2. (A) The wave attenuation provided by the coral reef offshore at Bamburi beach, Mombasa, provides calm waters and beachfront for recreation in the evenings. (B) Female fish traders buying fish from fishers in Kenya. (C) Colorful corals and associated fishes of high value in international aquaria trade. (D) People resting in the shade of a tree in Vamizi, Mozambique. (E) Fishermen bringing large reef fish ashore.
Box 1:
ES Elasticity in East African coastal ecosystem services
Shoreline protection service
Between three and four million people on the East African coast likely benefit from shoreline protection because of coral reefs (Ferrario et al. 2014). The degree of wave attenuation is affected by the height of the reef as well as the species composition and abundance of live coral, relative to the abundance of eroding organisms, such as parrotfishes or urchins (Perry et al. 2008). The balance between these determines if a reef grows or erodes such that impacts such as coral bleaching can result in reefs starting to erode away. Nevertheless, ES elasticity of shoreline protection is low in the short term (Sheppard et al. 2005) because a high proportion of wave energy is dissipated by historically accreted
reef (Ferrario et al. 2014), and because skeletons of complex corals remain after they have died. Over time coral skeletons do break down as a result of biological erosion or storms (Graham et al. 2007), leading to increased wave energy reaching the shore (Sheppard et al. 2005). ES elasticity would therefore be low at first, and increases in the elasticity may be avoided through management of bioeroding populations on the reef, or through natural recovery of corals.
Livelihood support for female traders
The roles of people in the coastal Kenyan fishery are highly gendered. Women do not participate in catching finfish and their primary role is buying, frying, and selling low-value fish to local consumers (Yang 2013, Matsue et al. 2014). In sites around Mombasa, competition between traders to access fish can be high, particularly when catches are low. Male traders, who tend to have greater capital and access to transport such as bicycles (Yang 2013) have priority access to larger and higher value species. Heavy fishing effort by illegal beach seines, although damaging to the ecosystem, generate high volumes of low-value fish (McClanahan et al. 2008), while protected areas, enforcement against illegal gears, and lower fishing effort increases catch rates, fish size, and individual fishers’ revenues (McClanahan 2010). However, the gendered access conditions suggests that such ecological improvements might negatively impact the livelihoods of female traders because of lower total catches and a shift in catch composition to high-value species favored by male traders (Daw et al. 2015).
Shade from mangroves service
The way that mangroves are valued by people is influenced by culture, and the level of dependence on mangroves for livelihoods and well-being (James et al. 2013). Even within households, men and women value resources differently based on gendered resource use practices (UNEP-WCMC 2014). The apparently insignificant small stand of mangrove trees (low Ecosystem Stock) adjacent to Lalane village in northern Mozambique contributes to the well-being of certain groups. Women gleaners for example, spend many hours in the sun at low tide collecting shells. With little or no alternative shade in the vicinity, the mangroves improve gleaners’ subjective well-being by providing a cool sanctuary from the heat, which increases enjoyment of the activity and improves social relations. Thus this service demonstrates a high ES elasticity despite the very limited Ecosystem Stocks; the removal of these trees would negatively impact on the well-being of gleaners because the shade they offer is accessible to gleaners (Access) and because of gleaners’ need for, and lack of alternatives to (Needs and Gaps) the shade from these mangroves.
Aquarium trade:
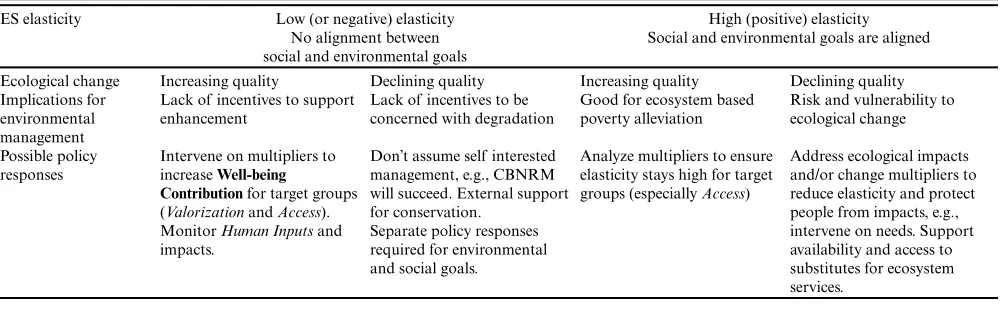
Table 3. Implications of high and low ES elasticities for policy and environmental management. CBNRM, community-based natural resource management.
ES elasticity Low (or negative) elasticity No alignment between social and environmental goals
High (positive) elasticity Social and environmental goals are aligned
Ecological change Increasing quality Declining quality Increasing quality Declining quality Implications for
environmental management
Lack of incentives to support enhancement
Lack of incentives to be concerned with degradation
Good for ecosystem based poverty alleviation
Risk and vulnerability to ecological change
Possible policy responses
Intervene on multipliers to increase Well-being
Contribution for target groups
(Valorization and Access). Monitor Human Inputs and impacts.
Don’t assume self interested management, e.g., CBNRM will succeed. External support for conservation.
Separate policy responses required for environmental and social goals.
Analyze multipliers to ensure elasticity stays high for target groups (especially Access)
Address ecological impacts and/or change multipliers to reduce elasticity and protect people from impacts, e.g., intervene on needs. Support availability and access to substitutes for ecosystem services.
relatively small changes in overall ecosystem health (Ecosystem Stocks).
Identity
People often develop an identity associated with a place as a result of the activities and relationships that people engage with there (Stedman 2002). For example, the emergence of place-based identities may be associated with the benefits and activities that are realized from the presence or utilization of ecosystem services, such as fisheries goods or through the use of the environment for recreation (supported by the coastal protection service) or shelter (provided by mangroves). For example, individuals from a fishing community may strongly identify with the reputation of having skilled fishers, from a close and supportive community, who engage in successful community conservation initiatives, and boast a productive and reliable fishery. The identity in this case is based on the same Ecosystem Stocks, Flows and Goods as a fisheries livelihood service. But, identity is also dependent on specific attributes of the Good, i.e., consistently large landings, and gain meaning (Valorization) through a history of social or community engagement. Individuals who are fishers and who belong to the community have Access to this identity. How important fishing, community, and recognition is to them and the extent to which they feel a sense of identity or belonging to another social group (Needs, Gaps, and Aspirations) will determine how this pride, identity, and sense of belonging contributes to their subjective and relational well-being. Because of the dependence of this identity on environmental quality and social engagement, a drop in environmental quality or social participation can rapidly affect the validity of a person’s place-based identity, suggesting a high ES elasticity.
The linear arrangement of this conceptual framework, draws specific attention to the connections and elasticity between ecosystems and human well-being. However it also risks a linear and isolated representation of different ecosystem services and blindness to complexity created by feedbacks and interactions between different ecosystem services as Norgaard (2010) warns. In reality ecosystem services are interlinked and bundled as shown
by Figure 3, which illustrates the differential impact of coral bleaching on different fisheries and how food fish landings generate different kinds of Value (income, food) and how different groups Access different Shares of that Value and benefit to different extents.
Mapping how different types of benefits accrue to different people in this way is essential for understanding linkages and trade-offs. For example an increase in the price of fish in Figure 4 would represent an increase in Valorization of fish for income but would also decrease Access of poor consumers to fish for food.
Multiplier effects in local economies may indirectly benefit multiple beneficiaries, such as tourism enhancing prices for local producers who can in turn hire more labor. In some cases such indirect benefits may be important for the well-being of many people (e.g., Ashley and Mitchell 2007) in which case they would need to be included in the aggregate calculation of Value. Value chain analysis can then identify how different people have Access to different shares of this Value.
POLICY RELEVANCE OF ANALYSING CHAINS AND ELASTICITY
We suggest ES elasticity can be applied to understanding vulnerability of different social actors to change in ecosystems, and to identify and assess the opportunities and potential interventions to improve well-being. The policy implications depend on the particular circumstance, specifically if the ES elasticity is high or low (or negative) and whether ecosystem quality is declining or improving (Table 3). Vulnerabilities of people result from high elasticities to ecological decline, or from processes that change multipliers and reduce elasticity, e.g., loss of access. Opportunities occur in situations of high elasticities when ecological enhancement is possible or where interventions can change multipliers to increase the Well-being Contribution of ecosystem services (Table 3).
Fig. 4. The branching of an ecosystem services-well-being chain by consideration of multiple flows from a given stock, multiple values of a good, and multiple groups of people receiving different shares of that value that contributes to each’s well-being dependent on their needs, gaps, and aspirations. The aquarium fish chain is only illustrated as far as the flow. Arrows between each element highlight high or low elasticity between elements along the chain.
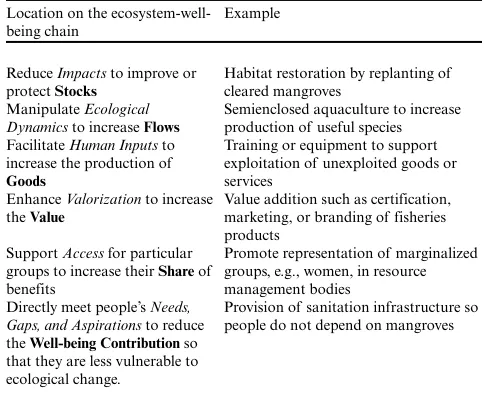
and to evaluate the relative impact of interventions affecting different parts of the chain. The framework broadly suggests six different classes of interventions to increase well-being described and exemplified in Table 4.
Second, understanding the elasticities within different chains and distribution of benefits as illustrated in Figure 4 facilitates an assessment of trade-offs linked to different interventions. This information can be analyzed with decision makers, for example, through use of scenarios exercises or “toy models” and other interactive techniques (e.g., Daw et al. 2015), to discuss the trade-offs associated with different courses of action. This is particularly relevant to interventions such as Payments for Ecosystem Services, or Community-based Conservation, where simplistic assumptions about benefits and their distribution may lead to negative outcomes in terms of compliance and negate “success” in ecological and social terms (Pascual et al. 2014).
Application of this framework clearly poses challenges. The data requirements for populating the chains to analyze elasticities are considerable, requiring a coordinated interdisciplinary effort incorporating ecologists and a diversity of social scientists. In addition, practical application of the elasticity concept may be challenging in highly dynamic settings where elements and multipliers change very rapidly. In such circumstances, the framework may be best used as a frame to guide rapid, qualitative,
Table 4. Interventions to improve well-being suggested by the ecosystem-well-being chain conceptual framework.
Location on the ecosystem-well-being chain
Example
Reduce Impacts to improve or protect Stocks
Habitat restoration by replanting of cleared mangroves
Manipulate Ecological Dynamics to increase Flows
Semienclosed aquaculture to increase production of useful species Facilitate Human Inputs to
increase the production of
Goods
Training or equipment to support exploitation of unexploited goods or services
Enhance Valorization to increase the Value
Value addition such as certification, marketing, or branding of fisheries products
Support Access for particular groups to increase their Share of benefits
Promote representation of marginalized groups, e.g., women, in resource management bodies
Directly meet people’s Needs, Gaps, and Aspirations to reduce the Well-being Contribution so that they are less vulnerable to ecological change.
[image:9.612.312.554.515.718.2]and participatory diagnoses of ES elasticity and the resulting opportunities. An outstanding challenge remains in linking ecosystem quality and well-being at different scales. Although dependency and ES elasticity may be reduced at one scale, alternatives are frequently based on ES from further afield so that well-being is sensitive to aggregate Ecological Stocks and multipliers at larger scales beyond the scope of most place-based assessments.
Modeling, particularly recent innovation and development of “end-to-end” models (Fulton 2010), may provide an opportunity to synthesize diverse types of information (from biophysical to social), to explore how patterns of elasticity emerge and can be modified. Modeling approaches range from simple empirical relationships between Ecosystem Stocks, Flows, and Goods and some measure of well-being, to simulation models that have explicit representation of socioeconomic and ecological processes and their temporal and spatial dynamics. Existing modeling approaches mostly focus on the biophysical dynamics, with only simple representation of Goods, e.g., catches, and Values, e.g., net economic profits, and occasionally Share for different groups or sectors, e.g., along the value chain (Christensen et al. 2011). The subjective and context-dependent nature of well-being suggests that participatory modeling may provide a means to better represent the right-hand side of the chain from Value to Well-being Contribution. For example, to explore the trade-offs between different stakeholders under scenarios of fisheries management in coastal Mombasa, outputs from ecological models were linked to a rule-based model describing the interactions between different groups of fishers, fish traders, and their well-being (Daw et al. 2015). Other modeling approaches such as agent-based modeling (Murray-Rust et al. 2013) also offer potential for disaggregating individual Shares and Well-being Contribution.
CONCLUSION
Given the complex and as yet poorly understood linkages between ecosystem services and human well-being, ES elasticity is proposed as a core concept that informs these critical relationships. These relationships are expected to be nonlinear, complex, and context dependent.
Our heuristic framework of an ecosystem service chain is designed to help analysis of elasticities of different ecosystem services. This framework promotes and facilitates a structured assessment of ecosystem services-well-being relationships as a common starting point for interdisciplinary analysis and should provide important insights into trade-offs and possible policy levers. It can facilitate a pro-poor and well-being-explicit approach to understanding different mechanisms along the chain that determine who is able to derive what benefits from changes in ecosystems. This adds to existing ecosystem services frameworks that may overlook critical issues of access, needs, and aspirations or ecological dynamics. Applying this framework across different ecosystem services, contexts, and for different people to explore patterns of ES elasticity could advance both ecosystem services theory and provide practical guidelines for pursuing environmental management for human well-being.
__________
[1] We acknowledge that “ecosystem quality” implies a value-laden
assumption of quality that depends on what aspects of an
ecosystem are desirable (Robards et al. 2011). We do not discuss this in this paper and assume that some dimension of ecosystem quality is applicable in practise, as indicated by the frequent use of proxies such as indicators of forest cover, biodiversity, or fish biomass.
[2] In practise these substitutes are often also ecosystem services,
e.g., imported food, from elsewhere but in many cases this represents a subsidy from ecosystems outside the scope of the system under study.
Responses to this article can be read online at:
http://www.ecologyandsociety.org/issues/responses.
php/8173
Acknowledgments:
This paper results from the project Sustainable Poverty Alleviation from Coastal Ecosystem Services (SPACES) project number NE-K010484-1, funded by the Ecosystem Services for Poverty Alleviation (ESPA) programme. The ESPA programme is funded by the Department for International Development (DFID), the Economic and Social Research Council (ESRC), and the Natural Environment Research Council (NERC). We are grateful for the comments of two anonymous reviewers which greatly improved the manuscript.
LITERATURE CITED
Abunge, C., S. Coulthard, and T. M. Daw. 2013. Connecting marine ecosystem services to human well-being: insights from participatory well-being assessment in Kenya. Ambio 42 (8):1010-1021. http://dx.doi.org/10.1007/s13280-013-0456-9 Agarwala, M., G. Atkinson, B. P. Fry, K. Homewood, S. Mourato, J. M. Rowcliffe, G. Wallace, and E. J. Milner-Gulland. 2014. Assessing the relationship between human well-being and ecosystem services: a review of frameworks. Conservation and Society 12(4):437-449. http://dx.doi.org/10.4103/0972-4923.155592
Alkire, S. 2007. The missing dimensions of poverty data: introduction to the special issue. Oxford Development Studies 35 (4):347-359. http://dx.doi.org/10.1080/13600810701701863 Andersson, E., T. McPhearson, P. Kremer, E. Gomez-Baggethun, D. Haase, M. Tuvendal, and D. Wurster. 2015. Scale and context dependence of ecosystem service providing units. Ecosystem Services 12:157-164. http://dx.doi.org/10.1016/j.ecoser.2014.08.001
Ashley, C., and J. Mitchell. 2007. Can tourism offer pro-poor pathways to prosperity. Briefing Paper 22, Overseas Development Institute, London, UK.
Barbier, E. B., E. W. Koch, B. R. Silliman, S. D. Hacker, E. Wolanski, J. Primavera, E. F. Granek, S. Polasky, S. Aswani, L. A. Cramer, D. M. Stoms, C. J. Kennedy, D. Bael, C. V. Kappel, G. M. E. Perillo, and D. J. Reed. 2008. Coastal ecosystem-based management with nonlinear ecological functions and values. Science 319(5861):321-323. http://dx.doi.org/10.1126/science.1150349
of the National Academy of Sciences 111(40):14625-14630. http:// dx.doi.org/10.1073/pnas.1320880111
Bateman, I. J., G. M. Mace, C. Fezzi, G. Atkinson, and K. Turner. 2011. Economic analysis for ecosystem service assessments. Environmental and Resource Economics 48(2):177-218. http://dx. doi.org/10.1007/s10640-010-9418-x
Bizikova, L. 2011. Understanding the contribution of the environment to human well-being: a review of literature. International Institute for Sustainable Development, Winnipeg, Manitoba, Canada.
Braat, L. C., and R. de Groot. 2012. The ecosystem services agenda:bridging the worlds of natural science and economics, conservation and development, and public and private policy. Ecosystem Services 1(1):4-15. http://dx.doi.org/10.1016/j. ecoser.2012.07.011
Butler, C. D., and W. Oluoch-Kosura. 2006. Linking future ecosystem services and future human well-being. Ecology and Society 11(1):30. [online] URL: http://www.ecologyandsociety. org/vol11/iss1/art30/
Carpenter, S. R., H. A. Mooney, J. Agard, D. Capistrano, R. S. DeFries, S. Díaz, T. Dietz, A. K. Duraiappah, A. Oteng-Yeboah, H. M. Pereira, C. Perrings, W. V. Reid, J. Sarukhan, R. J. Scholes, and A. Whyte. 2009. Science for managing ecosystem services: beyond the Millennium Ecosystem Assessment. Proceedings of the National Academy of Sciences 106(5):1305-1312. http://dx. doi.org/10.1073/pnas.0808772106
Christensen, V., J. Steenbeek, and P. Failler. 2011. A combined ecosystem and value chain modeling approach for evaluating societal cost and benefit of fishing. Ecological Modelling 222 (3):857-864. http://dx.doi.org/10.1016/j.ecolmodel.2010.09.030 Costanza, R., B. Fisher, S. Ali, C. Beer, L. Bond, R. Boumans, N. L. Danigelis, J. Dickinson, C. Elliott, J. Farley, D. E. Gayer, L. M. Glenn, T. Hudspeth, D. Mahoney, L. McCahill, B. McIntosh, B. Reed, S. A. T. Rizvi, D. M. Rizzo, T. Simpatico, and R. Snapp. 2007. Quality of life: an approach integrating opportunities, human needs, and subjective well-being. Ecological Economics 61 (2-3):267-276. http://dx.doi.org/10.1016/j.ecolecon.2006.02.023 Coulthard, S., D. Johnson, and J. A. McGregor. 2011. Poverty, sustainability and human wellbeing: a social wellbeing approach to the global fisheries crisis. Global Environmental Change 21 (2):453-463. http://dx.doi.org/10.1016/j.gloenvcha.2011.01.003 Das, S., and J. R. Vincent. 2009. Mangroves protected villages and reduced death toll during Indian super cyclone. Proceedings of the National Academy of Sciences of the United States of America 106(18):7357-7360. http://dx.doi.org/10.1073/pnas.0810440106
Dasgupta, P. 2001. Human well-being and the natural environment. Oxford University Press, Oxford, UK. http://dx.doi.
org/10.1093/0199247889.001.0001
Daw, T., K. Brown, S. Rosendo, and R. Pomeroy. 2011. Applying the ecosystem services concept to poverty alleviation: the need to disaggregate human well-being. Environmental Conservation 38 (04):370-379. http://dx.doi.org/10.1017/s0376892911000506 Daw, T. M., S. Coulthard, W. W. L. Cheung, K. Brown, C. Abunge, D. Galafassi, G. D. Peterson, T. R. McClanahan, J. O. Omukoto,
and L. Munyi. 2015. Evaluating taboo trade-offs in ecosystems services and human well-being. Proceedings of the National Academy of Sciences 112(22):6949-6954. http://dx.doi.org/10.1073/ pnas.1414900112
de Groot, R., B. Fisher, M. Christie, J. Aronson, L. Braat, J. Gowdy, R. Haines-Young, E. Maltby, A. Neuville, S. Polasky, R. Portela, and I. Ring. 2010. Integrating the ecological and economic dimensions in biodiversity and ecosystem service valuation. Chapter 1 in P. Kumar, editor. The Economics of Ecosystems and Biodiversity (TEEB): Ecological and Economic Foundations Geneva, Switzerland.
Díaz, S., S. Demissew, J. Carabias, C. Joly, M. Lonsdale, N. Ash, A. Larigauderie, J. R. Adhikari, S. Arico, A. Báldi, A. Bartuska, I. A. Baste, A. Bilgin, E. Brondizio, K. M. A. Chan, V. E. Figueroa, A. Duraiappah, M. Fischer, R. Hill, T. Koetz, P. Leadley, P. Lyver, G. M. Mace, B. Martin-Lopez, M. Okumura, D. Pacheco, U. Pascual, E. S. Pérez, B. Reyers, E. Roth, O. Saito, R. J. Scholes, N. Sharma, H. Tallis, R. Thaman, R. Watson, T. Yahara, Z. A. Hamid, C. Akosim, Y. Al-Hafedh, R. Allahverdiyev, E. Amankwah, S. T. Asah, Z. Asfaw, G. Bartus, L. A. Brooks, J. Caillaux, G. Dalle, D. Darnaedi, A. Driver, G. Erpul, P. Escobar-Eyzaguirre, P. Failler, A. M. M. Fouda, B. Fu, H. Gundimeda, S. Hashimoto, F. Homer, S. Lavorel, G. Lichtenstein, W. A. Mala, W. Mandivenyi, P. Matczak, C. Mbizvo, M. Mehrdadi, J. P. Metzger, J. B. Mikissa, H. Moller, H. A. Mooney, P. Mumby, H. Nagendra, C. Nesshover, A. A. Oteng-Yeboah, G. Pataki, M. Roué, J. Rubis, M. Schultz, P. Smith, R. Sumaila, K. Takeuchi, S. Thomas, M. Verma, Y. Yeo-Chang, and D. Zlatanova. 2015. The IPBES conceptual framework - connecting nature and people. Current Opinion in Environmental Sustainability 14:1-16. http:// dx.doi.org/10.1016/j.cosust.2014.11.002
Dowie, M. 2011. Conservation refugees: the hundred-year conflict between global conservation and native peoples. MIT Press, Cambridge, Massachusetts, USA.
Duraiappah, A. K. 2004. Exploring the links: human well-being, poverty & ecosystem services. United Nations Environment Programme and International Institute for Sustainable Development, Winnipeg, Canada.
Ferrario, F., M. W. Beck, C. D. Storlazzi, F. Micheli, C. C. Shepard, and L. Airoldi. 2014. The effectiveness of coral reefs for coastal hazard risk reduction and adaptation. Nature Communications 5:3794. http://dx.doi.org/10.1038/ncomms4794 Fisher, J. A., G. Patenaude, K. Giri, K. Lewis, P. Meir, P. Pinho, M. D. A. Rounsevell, and M. Williams. 2014. Understanding the relationships between ecosystem services and poverty alleviation: a conceptual framework. Ecosystem Services 7:34-45. http://dx. doi.org/10.1016/j.ecoser.2013.08.002
Fisher, J. A., G. Patenaude, P. Meir, A. J. Nightingale, M. D. A. Rounsevell, M. Williams, and I. H. Woodhouse. 2013. Strengthening conceptual foundations: analysing frameworks for ecosystem services and poverty alleviation research. Global Environmental Change 23(5):1098-1111. http://dx.doi.org/10.1016/ j.gloenvcha.2013.04.002
García-Nieto, A. P., M. García-Llorente, I. Iniesta-Arandia, and B. Martín-López. 2013. Mapping forest ecosystem services: from providing units to beneficiaries. Ecosystem Services 4:126-138. http://dx.doi.org/10.1016/j.ecoser.2013.03.003
Goldstein, J. H., G. Caldarone, T. K. Duarte, D. Ennaanay, N. Hannahs, G. Mendoza, S. Polasky, S. Wolny, and G. C. Daily. 2012. Integrating ecosystem-service tradeoffs into land-use decisions. Proceedings of the National Academy of Sciences 109 (19):7565-7570. http://dx.doi.org/10.1073/pnas.1201040109 Gough, I., and J. A. McGregor. 2007. Wellbeing in developing countries: from theory to research. Cambridge University Press, Cambridge, UK. http://dx.doi.org/10.1017/cbo9780511488986 Gough, I. R., and J. A. McGregor. 2007. Wellbeing in developing countries: new approaches and research strategies. Cambridge University Press, Cambridge, UK.
Graham, N. A. J., S. K. Wilson, S. Jennings, N. V. C. Polunin, J. Robinson, J. P. Bijoux, and T. M. Daw. 2007. Lag effects in the impacts of mass coral bleaching on coral reef fish, fisheries, and ecosystems. Conservation Biology 21(5):1291-1300. http://dx.doi. org/10.1111/j.1523-1739.2007.00754.x
Grey, M., A.-M. Blais, and A. C. J. Vincent. 2005. Magnitude and trends of marine fish curio imports to the USA. Oryx 39 (04):413-420. http://dx.doi.org/10.1017/s0030605305000967 Haines-Young, R., and M. Potschin. 2010. The links between biodiversity, ecosystem services and human well-being. Pages 110-139 in D. G. Raffaelli and C. L. J. Frid, editors. Ecosystem ecology: a new synthesis. Cambridge University Press, Cambridge, UK. http://dx.doi.org/10.1017/cbo9780511750458.007 Hicks, C. C., and J. E. Cinner. 2014. Social, institutional, and knowledge mechanisms mediate diverse ecosystem service benefits from coral reefs. Proceedings of the National Academy of Sciences 111(50):17791-17796. http://dx.doi.org/10.1073/pnas.1413473111
James, G. K., J. O. Adegoke, S. Osagie, S. Ekechukwu, P. Nwilo, and J. Akinyede. 2013. Social valuation of mangroves in the Niger Delta region of Nigeria. International Journal of Biodiversity Science, Ecosystem Services & Management 9(4):311-323. http:// dx.doi.org/10.1080/21513732.2013.842611
Kamat, V. 2014. “The ocean is our farm”: marine conservation, food insecurity, and social suffering in southeastern Tanzania. Human Organization 73(3):289-298. http://dx.doi.org/10.17730/ humo.73.3.f43k115544761g0v
Leach, M., R. Mearns, and I. Scoones. 1999. Environmental entitlements: dynamics and institutions in community-based natural resource management. World Development 27(2):225-247. http://dx.doi.org/10.1016/s0305-750x(98)00141-7
Lele, S., O. Springate-Baginski, R. Lakerveld, D. Deb, and P. Dash. 2013. Ecosystem services: origins, contributions, pitfalls, and alternatives. Conservation and Society 11(4):343-358. http:// dx.doi.org/10.4103/0972-4923.125752
Liu, J., T. Dietz, S. R. Carpenter, M. Alberti, C. Folke, E. Moran, A. N. Pell, P. Deadman, T. Kratz, J. Lubchenco, E. Ostrom, Z. Ouyang, W. Provencher, C. L. Redman, S. H. Schneider, and W. W. Taylor. 2007. Complexity of coupled human and natural systems. Science 317(5844):1513-1516. http://dx.doi.org/10.1126/ science.1144004
Loya, Y., K. Sakai, K. Yamazato, Y. Nakano, H. Sambali, and R. Van Woesik. 2001. Coral bleaching: the winners and the losers. Ecology Letters 4(2):122-131. http://dx.doi.org/10.1046/ j.1461-0248.2001.00203.x
Mace, G. M., K. Norris, and A. H. Fitter. 2012. Biodiversity and ecosystem services: a multilayered relationship. Trends in Ecology & Evolution 27(1):19-26. http://dx.doi.org/10.1016/j.tree.2011.08.006
Máñez, K. S., L. Dandava, and W. Ekau. 2014. Fishing the last frontier: the introduction of the marine aquarium trade and its impact on local fishing communities in Papua New Guinea. Marine Policy 44:279-286. http://dx.doi.org/10.1016/j.marpol.2013.09.018
Matsue, N., T. Daw, and L. Garrett. 2014. Women fish traders on the Kenyan coast: livelihoods, bargaining power, and participation in management. Coastal Management 42 (6):531-554. http://dx.doi.org/10.1080/08920753.2014.964819 McClanahan, T. R. 1999. Is there a future for coral reef parks in poor tropical countries? Coral Reefs 18(4):321-325. http://dx.doi. org/10.1007/s003380050205
McClanahan, T. R. 2010. Effects of fisheries closures and gear restrictions on fishing income in a Kenyan coral reef. Conservation Biology 24(6):1519-1528. http://dx.doi.org/10.1111/j.1523-1739.2010.01530. x
McClanahan, T. R., C. C. Hicks, and E. S. Darling. 2008. Malthusian overfishing and efforts to overcome it on Kenyan coral reefs. Ecological Applications 18(6):1516-1529. http://dx. doi.org/10.1890/07-0876.1
McGregor, J. A., L. Camfield, and S. Coulthard. 2015. Competing interpretations: human wellbeing and the use of quantitative and qualitative methods. Chapters 10 in K. Roelen and L. Camfield, editors. Mixed methods research in poverty and vulnerability: sharing ideas and learning lessons. Palgrave MacMillan, London, UK. http://dx.doi.org/10.1057/9781137452511.0017
McNally, C. G., E. Uchida, and A. J. Gold. 2011. The effect of a protected area on the tradeoffs between short-run and long-run benefits from mangrove ecosystems. Proceedings of the National Academy of Sciences 108(34):13945-13950. http://dx.doi. org/10.1073/pnas.1101825108
Millennium Ecosystem Assessment (MA). 2003. Ecosystems and human being. Pages 71-84 in Ecosystems and human well-being: a framework for assesment. Island Press, Washington, D. C., USA.
Milner-Gulland, E. J., J. A. Mcgregor, M. Agarwala, G. Atkinson, P. Bevan, T. Clements, T. Daw, K. Homewood, N. Kümpel, J. Lewis, S. Mourato, B. Palmer Fry, M. Redshaw, J. M. Rowcliffe, S. Suon, G. Wallace, H. Washington, and D. Wilkie. 2014. Accounting for the impact of conservation on human well-being. Conservation Biology 28(5):1160–1166. http://dx.doi.org/10.1111/ cobi.12277
Murray-Rust, D., V. Rieser, D. T. Robinson, V. Miličič, and M. Rounsevell. 2013. Agent-based modelling of land use dynamics and residential quality of life for future scenarios. Environmental Modelling & Software 46:75-89. http://dx.doi.org/10.1016/j. envsoft.2013.02.011
Norgaard, R. B. 2010. Ecosystem services: from eye-opening metaphor to complexity blinder. Ecological Economics 69 (6):1219-1227. http://dx.doi.org/10.1016/j.ecolecon.2009.11.009 Organisation for Economic Co-operation and Development (OECD). 2011. How’s life?: Measuring well-being. OECD, Paris, France.
Oxfam. 2013. The Oxfam humankind index: the new measure of Scotland’s prosperity, second results. Oxfam, Oxford, UK.
Pascual, U., J. Phelps, E. Garmendia, K. Brown, E. Corbera, A. Martin, E. Gomez-Baggethun, and R. Muradian. 2014. Social equity matters in payments for ecosystem services. BioScience 64 (11):1027-1036. http://dx.doi.org/10.1093/biosci/biu146 Perry, C. T., T. Spencer, and P. S. Kench. 2008. Carbonate budgets and reef production states: a geomorphic perspective on the ecological phase-shift concept. Coral Reefs 27(4):853-866. http:// dx.doi.org/10.1007/s00338-008-0418-z
Raudsepp-Hearne, C., G. D. Peterson, M. Tengö, E. M. Bennett, T. Holland, K. Benessaiah, G. K. MacDonald, and L. Pfeifer. 2010. Untangling the environmentalist’s paradox: why is human well-being increasing as ecosystem services degrade? BioScience 60(8):576-589. http://dx.doi.org/10.1525/bio.2010.60.8.4 Reyers, B., R. Biggs, G. S. Cumming, T. Elmqvist, A. P. Hejnowicz, and S. Polasky. 2013. Getting the measure of ecosystem services: a social-ecological approach. Frontiers in Ecology and the Environment 11(5):268-273. http://dx.doi.org/10.1890/120144
Ribot, J. C., and N. L. Peluso. 2003. A theory of access. Rural Sociology 68(2):153-181. http://dx.doi.org/10.1111/j.1549-0831.2003. tb00133.x
Robards, M. D., M. L. Schoon, C. L. Meek, and N. L. Engle. 2011. The importance of social drivers in the resilient provision of ecosystem services. Global Environmental Change 21 (2):522-529. http://dx.doi.org/10.1016/j.gloenvcha.2010.12.004 Robeyns, I. 2005. The capability approach: a theoretical survey. Journal of Human Development 6:93-117. http://dx.doi. org/10.1080/146498805200034266
Roe, D., J. Elliott, C. Sandbrook, and M. Walpole. 2012. Biodiversity conservation and poverty alleviation: exploring the evidence for a link. John Wiley & Sons, London, UK. http://dx. doi.org/10.1002/9781118428351
Scheffer, M., S. Carpenter, J. A. Foley, C. Folke, and B. Walker. 2001. Catastrophic shifts in ecosystems. Nature 413 (6856):591-596. http://dx.doi.org/10.1038/35098000
Sen, A. 2001. Development as freedom. New edition. Oxford University Press, Oxford, UK.
Sheppard, C., D. J. Dixon, M. Gourlay, A. Sheppard, and R. Payet. 2005. Coral mortality increases wave energy reaching
shores protected by reef flats: examples from the Seychelles. Estuarine, Coastal and Shelf Science 64(2-3):223-234. http://dx. doi.org/10.1016/j.ecss.2005.02.016
Stedman, R. C. 2002. Toward a social psychology of place predicting behavior from place-based cognitions, attitude, and identity. Environment and Behavior 34(5):561-581. http://dx.doi. org/10.1177/0013916502034005001
United Nations. 2012. Human well-being for a planet under pressure. Rio+20 Policy Brief #6 in Planet under pressure: new knowledge towards solutions. UN, New York, New York, USA.
United Nations Environment Programme World Conservation Monitoring Centre (UNEP-WCMC). 2014. The importance of mangroves to people: a call to action. UNEP-WCMC, Cambridge, UK.
Vira, B., and W. M. Adams. 2009. Ecosystem services and conservation strategy: beware the silver bullet. Conservation Letters 2(4):158-162. http://dx.doi.org/10.1111/j.1755-263x.2009.00063. x
Wood, L. J., L. Fish, J. Laughren, and D. Pauly. 2008. Assessing progress towards global marine protection targets: shortfalls in information and action. Oryx 42:340–351. http://dx.doi. org/10.1017/S003060530800046X
Woodroffe, R., S. Thirgood, and A. Rabinowitz. 2005. People and wildlife, conflict or co-existence? Cambridge University Press, Cambridge, UK. http://dx.doi.org/10.1017/CBO9780511614774 Wunder, S. 2001. Poverty alleviation and tropical forests—What scope for synergies? World Development 29(11):1817-1833. http:// dx.doi.org/10.1016/S0305-750X(01)00070-5
Yang, A. 2013. The sustainability of trading fish: evaluating the socioeconomic impacts of illegal beach seines on small-scale fish traders on the coast of Kenya. Thesis, Edinburgh University, Edinburgh, UK.