Profiling Identify Key Genes and Pathways Involved in Cellular
Transformation by a Marek’s Disease Virus Oncoprotein, Meq
Sugalesini Subramaniam,a,bJohn Johnston,cLikit Preeyanon,dC. Titus Brown,dHsing-Jien Kung,eHans H. Chengb
Comparative Medicine and Integrative Biology Program, College of Veterinary Medicine, Michigan State University, East Lansing, Michigan, USAa
; USDA, ARS, Avian Disease and Oncology Laboratory, East Lansing, Michigan, USAb
; Department of Biochemistry and Molecular Biology, Michigan State University, East Lansing, Michigan, USAc
; Department of Microbiology and Molecular Genetics, Michigan State University, East Lansing, Michigan, USAd
; Department of Biochemistry and Molecular Medicine, University of California—Davis School of Medicine, Sacramento, California, USAe
Marek’s disease (MD) is an economically significant disease in chickens that is caused by the highly oncogenic Marek’s disease virus (MDV). A major unanswered question is the mechanism of MDV-induced tumor formation. Meq, a bZIP transcription factor discovered in the 1990s, is critically involved in viral oncogenicity, but only a few of its host target genes have been de-scribed, impeding our understanding of MDV-induced tumorigenesis. Using chromatin immunoprecipitation-sequencing (ChIP-seq) and microarray analysis, a high-confidence list of Meq binding sites in the chicken genome and a global transcrip-tome of Meq-responsive genes were generated. Meq binding sites were found to be enriched in the promoter regions of upregu-lated genes but not in those of downreguupregu-lated genes. ChIP-seq was also performed for c-Jun, a known heterodimeric partner of Meq. The close location of binding sites of Meq and c-Jun was noted, suggesting cooperativity between these two factors in mod-ulating transcription. Pathway analysis indicated that Meq transcriptionally regulates many genes that are part of several signal-ing pathways includsignal-ing the extracellular signal-regulated kinase /mitogen-activated protein kinase (ERK/MAPK), Jak-STAT, and ErbB pathways, which are critical for oncogenesis and/or include signaling mediators involved in apoptosis. Meq activates onco-genic signaling cascades by transcriptionally activating major kinases in the ERK/MAPK pathway and simultaneously repressing phosphatases, as verified using inhibitors of MEK and ERK1/2 in a cell proliferation assay. This study provides significant in-sights into the mechanistic basis of Meq-dependent cell transformation.
M
arek’s disease (MD), which is caused by the highly onco-genic alphaherpesvirus Marek’s disease virus (MDV), is one of the most economically significant diseases affecting poultry (1). Currently, the main strategy to control MD is vaccination (2,3). Although current MD vaccines reduce the incidence of tumor formation, they do not confer protection against MDV infection and replication or prevent horizontal spread of infection. Also, despite the widespread use of MD vaccines, field strains of MDV continue to evolve with increased virulence in vaccinated flocks (4,5). Concern regarding MD is further enhanced by the unpre-dictable and spontaneous vaccine breaks that can result in devas-tating losses to poultry farms (6). Worldwide annual losses from MD due to carcass condemnation and reduced egg production exceed $2 billion (7). The cost of MD may be even larger since this figure has not been revised to reflect new disease outbreaks or MDV-induced immunosuppression. The inability to obtain com-plete control necessitates a better understanding of MDV-host interactions, not only to elucidate the events in pathogenesis but also to develop strategies to combat infection.One of the major unanswered questions in the pathogenesis of MD is the mechanism underlying tumorigenesis (8). Among sev-eral MDV genes, oncogenic properties are attributed primarily to Meq (9). Meq is uniquely expressed in oncogenic serotypes of MDV (10), and recombinant MDVs lacking Meq displayed no oncogenicity in chickens (11) while retaining their ability to rep-licate. Furthermore, knockdown of Meq using small interfering RNA (siRNA) resulted in reduced colony formation in MSB-1, an MDV-transformed cell line (12). In addition, analysis of MDV
tumors and transformed cells revealed consistent expression of Meq as a latent and oncogenic component of MDV (11,13).
Meq belongs to the bZIP family of transcription factors (TFs), which are characterized by having an N-terminal basic DNA bind-ing domain adjacent to a leucine zipper (9). Meq has been shown to homodimerize with itself or form heterodimers with other bZIP proteins, though the most stable heterodimers were found to be with c-Jun (13,14). Meq has been shown to bind to both viral and chicken genomes and to regulate gene expression (8,15). A limited number of genes regulated by Meq such asJTAP-1,JAC,
andHB-EGF, which belong to thev-Juntransforming pathway,
have been described (13,16). However, a global understanding of the role of Meq in regulating the host gene expression thereby resulting in cellular transformation is lacking.
Our major objective in this study was to gain a comprehensive understanding of host genes that are directly regulated by Meq. Identification of the binding sites of Meq and the corresponding Meq-responsive genes would provide valuable information re-garding the biologic pathways influenced by Meq. In addition to
Received2 May 2013Accepted31 May 2013
Published ahead of print5 June 2013
Address correspondence to Hans H. Cheng, [email protected]. Supplemental material for this article may be found athttp://dx.doi.org/10.1128 /JVI.01163-13.
Copyright © 2013, American Society for Microbiology. All Rights Reserved.
doi:10.1128/JVI.01163-13
on November 7, 2019 by guest
http://jvi.asm.org/
characterizing Meq-responsive genes, we also aim to analyze genes that are coregulated by Meq and c-Jun. Using a virus-free, spon-taneously immortalized chicken embryo fibroblast cell line (17) stably transfected with Meq as a model system (16), we employed both chromatin immunoprecipitation followed by high-through-put sequencing (ChIP-seq) and transcriptome profiling. The re-sulting list of Meq-regulated genes has been integrated with their proximal Meq binding sites revealing biological pathways, includ-ing that of MAPK, whose effect on cell proliferation was further validated. Our results indicate that Meq controls critical transcrip-tional programs that promote transformation through both pos-itive and negative gene regulation.
MATERIALS AND METHODS
Cell culture.DF-1, a chicken embryo fibroblast cell line (17), and Meq-DF-1 clone 5G (16), DF-1 stably expressing Meq driven by the cytomeg-alovirus (CMV) promoter, were cultured in Lebowitz’s L-15 and McCoy 5A media with 15% inactivated fetal bovine serum and 100 U of penicillin per ml and maintained at 37°C.
ChIP-seq.Meq-DF-1 cells (107) were cross-linked with 1%
formalde-hyde and incubated for 10 min at 37°C. After briefly washing the cells twice with ice-cold phosphate-buffered saline (PBS) containing a protease inhibitor cocktail (Cell Signaling Technology, Danvers, MA), ChIP was performed using the chromatin immunoprecipitation assay kit protocol according to the manufacturer’s instructions (Upstate Biotechnology, Lake Placid, NY). Briefly, cells were lysed using the provided lysis buffer and sonicated to yield 50- to 200-bp chromatin fragments, followed by overnight incubation at 4°C with agarose-salmon sperm DNA for pre-clearing to avoid nonspecific background. The supernatant fraction was collected from the pelleted agarose by brief centrifugation, followed by incubation overnight with 5g of antibody at 4°C. The antibodies used were anti-Meq polyclonal antibody (a kind gift from Lucy Lee), anti-c-Jun antibody (Upstate Biotechnology), or rabbit IgG (Cell Signaling Technol-ogy). The immune complexes were pulled down using salmon sperm DNA-protein A agarose beads and then pelleted by brief centrifugation. The samples were then washed and the immune complexes eluted. Cross-linking was reversed by addition of 5 M NaCl to a final concentration of 0.3 M to the eluted sample and incubated in a 65°C water bath for 4 h. After proteinase K digestion, the DNA was recovered by phenol-chloro-form extraction. DNA was quantified using a Nanodrop 1000 (Thermo Scientific, Wilmington, DE). The relative enrichment was determined by quantitative PCR (qPCR) using ABI 7500 (Applied Biosystems, Foster City, CA) and Power SYBR green Master mix (Applied Biosystems) with the following parameters: 95°C for 10 min followed by 40 cycles of 95°C for 15 s and 60°C for 1 min. The primers used for the ChIP assay are listed in Table S1 in the supplemental material. The fluorescence was expressed as threshold cycle (CT) values. The data are expressed as percent input,
calculated as 2(CTinput⫺CTMeq antibody), where DNA before
immunopre-cipitation was used as input DNA. Replicates from each sample were sub-jected to high-throughput sequencing at the Michigan State University Research Technology Support Facility (MSU RTSF [www.rtsf.msu.edu]) using the Illumina Genome Analyzer II (San Diego, CA) platform. Bowtie (18) was employed to map the validated sequences to the chicken genome (version galGal3) using standard options to filter out extremely short reads and ambiguous nucleotides.
Analysis of ChIP-seq data.ChIP-seq data were analyzed using the peak calling software QuEST (19). Peaks with high confidence were de-fined by ChIP enrichment of more than 3-fold with a 10% false-discovery rate (FDR). For computational motif prediction, DNA sequences of 200 bp in length (100 bp around each peak) and MEME (20,21) were used for investigatingde novomotifs with default parameters to yield consensus motifs in each data set.
Luciferase assays for Meq motifs.Custom reporter plasmids contain-ing a proprietary minimal promoter region and three repeats of motif 1
(TGACTCA, AP-1 like) or motif 2 (CACACAGC, MERE-II like) up-stream of the luciferase coding region were ordered from Genecopoeia (Rockville, MD). Meq-DF-1 cells were plated in 96-well plates at a density of 5,000 cells/well and transfected with 50 to 100 ng of empty vector or luciferase constructs with motif 1 or 2, respectively. Luciferase activity was measured with the Secrete-Pair dual luminescence assay kit (Geneco-poeia) 48 h after transfection using a microplate luminometer (Turner Biosystems, Sunnyvale, CA).
RNA extraction and microarray analysis.Total RNA was extracted using the Absolutely RNA Miniprep kit (Stratagene, Santa Clara, CA). The quality and the quantity of the RNA were verified using an Agilent Bio-analyzer 2100 (Santa Clara, CA). High-quality RNA was labeled using Affymetrix (Santa Clara, CA) One-Cycle Target Labeling and Control reagents. The Affymetrix chicken and pathogen GeneChips have probe sets to query 32,773 chicken transcripts including all 17,179 chicken uni-genes, Ensembl-predicted uni-genes, and reporter genes. Hybridization and scanning were performed by the MSU RTSF.
Pathway analysis.Gene accession numbers were imported into the Ingenuity Pathway Analysis (IPA) version 8.0 software (Mountain View, CA) along with Chicken Affymetrix identifiers and corresponding expres-sion values (P⬍0.05). The “core analysis” function included in IPA was used to interpret data in the context of biological processes, pathways, and networks.
Validation of microarray data by qRT-PCR.Total RNA was ex-tracted from DF-1 and Meq-DF-1 cells using the Absolutely RNA Miniprep kit (Stratagene). First-strand cDNA was synthesized by re-verse transcribing 250 ng of total RNA using the Superscript III First strand synthesis Supermix for quantitative reverse transcription-PCR (qRT-PCR) (Invitrogen, Carlsbad, CA). The qRT-PCR mixture con-sisted of SYBR green PCR Super Mix (Applied Biosystems) and 300 nM forward and reverse primers. The primers used for the ChIP assay are listed in Table S2 in the supplemental material. The reactions were performed in an ABI 7500 (Applied Biosystems) with the following settings: 50°C for 2 min and 95°C for 10 min, followed by 40 cycles of 60°C for 1 min and 95°C for 15 s. At the end of amplification, a disso-ciation curve analysis was performed to confirm the presence of a single amplification product. Each sample was run in duplicate to obtain averageCTvalues. For negative controls, no reverse
transcrip-tase controls were used as the template in place of single-stranded cDNA in the qRT-PCR. Expression of each gene was normalized to the expression of-actin, and results were compared to the data obtained from the control group according to the 2⫺⌬⌬CTmethod.
siRNA transfection and analysis.DF-1 and Meq-DF-1 cells were transfected with nontargeting siRNA (NT1) or siRNA-targeting Meq (Dharmacon, Lafayette, CO) using the TransIT-TKO transfection reagent (Mirus, Madison, WI). Cells were harvested 48 h after transfection and used for RNA extraction. Knockdown at the mRNA level was confirmed by qPCR. The following primers were used for Meq: forward, 5=-AGTGC GTTTGTTGACGGAAA-3=, and reverse, 5=-CTATATACGCCCTGCGC AC-3=, and the qPCR conditions were the same as those described above. Data were generated from three independent experiments.
Cell proliferation.Cell proliferation was measured by using a Cell-Titer 96 AQueous Non-Radioactive Cell Proliferation assay (Promega, Madison, WI) according to the manufacturer’s instructions. Briefly, cells were plated at a density of 10,000 cells/well in 96-well microtiter plates. After overnight incubation, the cells were switched to serum-free medium and treated with pathway inhibitors for 24 h. PD98059 (50M) and FR180204 (1M) (Sigma, St. Louis, MO) were used to inhibit MEK and ERK, respectively, based on previously published reports (22, 23). At the end of the treatment period, a combined MTS [3-(4,5-dimethylthiazol-2yl)-5-(3-carboxymethoxyphenyl)-2-(4-sulfophenyl)-2H-tetrazolium]-phenozine methosulfate (Promega) solution (20l/well) was added. After incubation for 40 min at 37°C, the absorbance was measured at 490 nm by using an enzyme-linked immunosorbent assay plate reader (Molecular Devices, Sunnyvale, Genome-Wide Analysis of MDV Meq Regulation
on November 7, 2019 by guest
http://jvi.asm.org/
CA). Data were derived from two independent experiments with 4 wells in each experiment.
Statistical analysis.One-way analysis of variance (ANOVA) followed by Fisher’s test,ttest, and chi-square analysis were used as necessary. AP
value of 0.05 was used as a cutoff for statistical significance.
Microarray sequence accession number.Microarray and ChIP-seq data have been submitted to NCBI Gene Express Omnibus (GEO) under accession numberGSE47191.
RESULTS
ChIP-seq analysis of Meq and c-Jun binding sites in the chicken
genome. To identify all the binding sites occupied by Meq
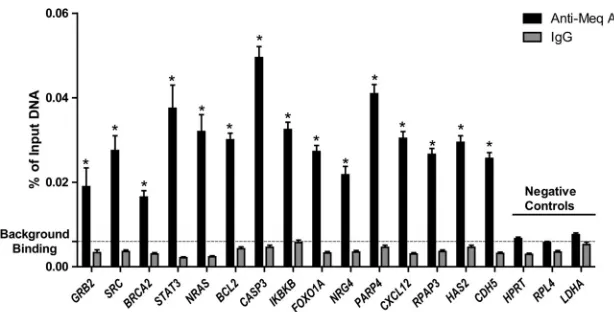
and/or c-Jun within the chicken genome, ChIP was performed using polyclonal antibodies directed against Meq, c-Jun (the preferred dimerization partner for Meq), or IgG (control) in Meq-DF-1 cells followed by massively parallel sequencing of the enriched DNA fragments. There were 23 and 21.5 million reads enriched for Meq binding but 19.6 and 18.5 million reads for c-Jun binding from replicates 1 and 2, respectively; our control using nonspecific IgG antibody had 0.75 and 0.69 mil-lion reads for the two replicates, indicating a relatively low nonspecific background. Only those reads that uniquely mapped to the chicken genome were used for further analysis. Peak calling was performed using the statistical program Quantitative Enrichment of Sequence Tags (QuEST) (19) un-der high-stringency conditions at 10% FDR. The degree of overlap was computed using a Python script that compared peaks in replicates. Based on this script, we noted that there was high overlap (85% and 80% for Meq and c-Jun, respectively) between the two biological replicates, indicating good repro-ducibility. For further analysis of the binding sites, the peaks were merged and used to generate a total of 15,576 peaks for Meq and 8,545 peaks for c-Jun. To support these findings, we performed qPCR analysis from two independently generated ChIP experiments using primers for 15 high-confidence bind-ing sites from top biological networks and three negative-con-trol regions. As shown inFig. 1, all the 15 Meq bound sites were significantly enriched compared to IgG controls.
The location of the binding sites relative to the transcrip-tional start site (TSS) can provide insights into how the tran-scription factor regulates trantran-scription. To examine the fre-quency distribution of Meq and c-Jun binding sites relative to
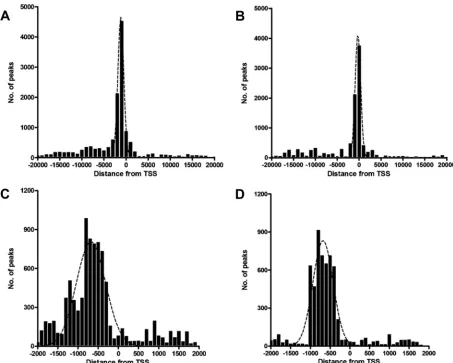
TSS, peaks located ⫾20 kb relative to the nearest TSS were organized into 1-kb bins. Genome-wide distance correlation analysis revealed that about 60% and 55% of Meq and c-Jun binding sites, respectively, were located within⫾2 kb of a TSS (Fig. 2AandB). To further analyze the distribution of binding sites within⫾2 kb of TSS, peaks were organized into 100-bp bins. Meq binding sites (41% of all binding sites) peaked in the region between⫺300 bp and ⫺800 bp (Fig. 2C). Similarly, about 44% of all c-Jun binding sites were between⫺400 bp and
⫺1,000 bp relative to the proximal TSS (Fig. 2D).
There were a total of 1,490 and 778 genes with binding sites within 2 kb upstream of the nearest TSS for Meq and c-Jun, re-spectively. In our analyses, we also identified 204 genes that have both Meq and c-Jun binding sites in their promoter regions. To explore the similarities in Meq and c-Jun binding sites, we ana-lyzed binding sites within 150 bp upstream of the TSS in genes with both Meq and c-Jun binding sites. The distance between binding sites was less than 25 bp in 96% of these genes, suggesting that Meq and c-Jun bound as a heterodimer in these regions (see Fig. S1 in the supplemental material).
To verify if Meq and c-Jun binding sites were concentrated in a particular portion of the genome, the chicken genome was parti-tioned into the following categories: promoter (⫺2 kb to TSS), 5=
or 3=untranslated region (UTR), introns, exons, and intergenic regions. The peaks for Meq and c-Jun binding were significantly overrepresented in the promoter region (63 and 69%, respec-tively) and significantly underrepresented (P⬍0.0001 by2test) in the intergenic region (18 and 13%, respectively) compared to IgG-bound regions in the chicken genome (10% and 55% in pro-moter and intergenic regions, respectively) (Fig. 3).
To identify consensus binding motifs in the chicken genome, the enriched Meq and c-Jun binding sites were analyzed using MEME (5). The top two candidate motifs that account for 89% of the Meq binding sites are shown in Web LOGO format (Fig. 4). Motif 1 had a core sequence that was 97% similar to the previously described AP-1 consensus binding site (24) as designated by the JASPAR and TRANSFAC databases (25,26). Motif 2 had a core sequence of CACACAGC, which is similar to a putative motif referred to as MERE-II (14,24). Analysis of c-Jun binding sites revealed that an AP-1-like motif was present in 72% of the binding sites. Next, we analyzed the enriched peaks common to both Meq
FIG 1ChIP-qPCR validation of a subset of Meq binding sites from ChIP-seq data. Negative-control regions were based on housekeeping genes with no Meq peaks. Background binding level represents the mean of Meq signals in three negative-control regions. *,P⬍0.05 compared to IgG.
on November 7, 2019 by guest
http://jvi.asm.org/
[image:3.585.136.443.64.220.2]and c-Jun binding sites, which revealed that the top motif in these common peaks was identical to motif 1, described above. This corroborates previous evidence that Meq can readily dimerize with c-Jun and this Meq-Jun heterodimer preferentially binds to AP-1-like sites (14,24). Interestingly, motif 2 (MERE-II-like mo-tif) was not present in the peaks common to both Meq and c-Jun
FIG 2Distribution of Meq and c-Jun binding sites. (A and B) The distances between Meq (A) and c-Jun (B) binding sites and the nearest TSS within⫾20 kb are shown with the results binned in 1,000-bp intervals. (C and D) A more detailed view of the majority of binding sites that were within⫾2 kb of the TSS shows the frequency distribution of Meq (C) and c-Jun (D) binding sites in 100-bp intervals. The black dotted line represents a polynomial line of best fit.
FIG 3Genomic distribution of Meq binding sites. The chicken genome was partitioned into five discrete regions, and the relative distribution of Meq and c-Jun binding sites in these regions is represented (P⬍0.001 compared to IgG-bound regions in the chicken genome by the2test).
FIG 4Characterization of Meq DNA binding motifs. Meq binding sites were examined for commonly occurring motifs using MEME motif analysis soft-ware. The top two significantly overrepresented motifs within Meq binding sites are shown. The height of each letter is proportional to its frequency, with the most frequent base on top.
Genome-Wide Analysis of MDV Meq Regulation
on November 7, 2019 by guest
http://jvi.asm.org/
[image:4.585.64.517.65.428.2] [image:4.585.61.264.514.684.2] [image:4.585.300.542.581.675.2]binding sites, which supports a previous observation that Meq homodimers bind to the MERE-II motif (14).
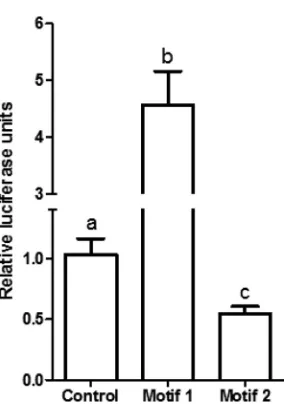
To test the relevance of these motifs, Meq-DF-1 cells, which constitutively express Meq, were transfected with control vector or luciferase constructs containing repeats of motif 1 or motif 2. As expected, there was a significant increase in luciferase activity compared to control with motif 1, suggesting transactivation. However, there was a decrease in luciferase activity compared to control vector in the motif 2 luciferase construct, suggesting tran-scriptional repression (Fig. 5).
Microarray analysis of transcriptional regulation by Meq.
We performed microarray analyses on DF-1 and Meq-DF-1 cell lines using the Affymetrix Chicken Genome Array, which pro-vides comprehensive coverage for all annotated chicken genes. Only genes that showed consistent changes at a statistical
signifi-cance ofPvalues of⬍0.001 were used for further analysis. By this criterion, there were 236 upregulated genes and 549 downregu-lated genes in Meq-DF-1 compared to DF-1 (see Table S3 in the supplemental material).
To further decipher the relationship between DNA binding by Meq and transcriptional regulation, we integrated ChIP-seq data in combination with gene expression microarray data. About 70% of the differentially expressed genes had only Meq binding sites in their promoters (generated from the list men-tioned above), indicating a significant and direct role of Meq binding in regulating gene transcription in Meq-DF-1 cells (Fig. 6A). Among genes with binding sites for both Meq and c-Jun in the promoter, 35% of all upregulated genes had bind-ing sites for both Meq and c-Jun in the promoter compared to only 10% of all downregulated genes (Fig. 6B).
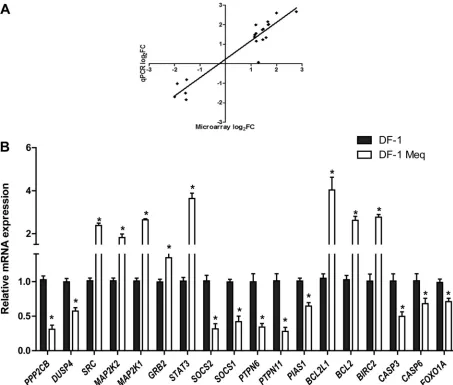
To further examine the functional categories of genes and po-tential biologic networks regulated by Meq, we analyzed the list of differentially expressed genes with Meq-only binding sites, using Ingenuity Pathway Analysis. The top five cellular pathways en-riched in this gene list were apoptosis, cell cycle, regulation of transcription, cell proliferation, and cell migration (Fig. 7A). This analysis also revealed several important cellular pathways that are regulated by Meq. For example, 21 of the 95 genes (22%) in the apoptosis signaling pathway and 31 of the 206 genes in the ERK/ MAPK pathway (15%) were differentially expressed in Meq-DF-1 cells compared to DF-1 cells (Fig. 7B). We validated the microar-ray findings using RNA from independent experiments from DF-1 and Meq-DF-1 cells. Eighteen genes from top biological net-works were used for validation. The fold change using qRT-PCR was highly correlated with the findings from the microarray data (r2⫽0.91;P⬍0.001) (Fig. 8AandB).
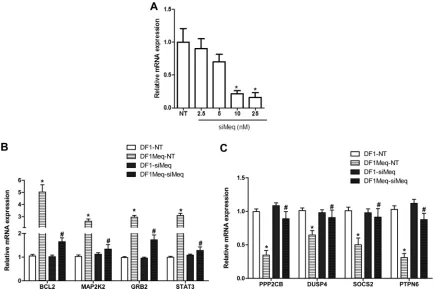
To further analyze the impact of Meq on gene expression, we employed siRNA to reduce Meq expression. In Meq-DF-1 cells, Meq-specific siRNA resulted in at least 75% reduction in mRNA expression (Fig. 9A). qRT-PCR for 4 genes each from our up- and downregulated gene list was performed in cell lines transfected with nontargeting siRNA (NT) or siMeq. These results showed that upon Meq silencing, there was significant attenuation of the Meq-induced increase in expression of genes that were
upregu-FIG 5Luciferase reporter assay depicting activity of constructs with either empty vector (control), repeats of motif 1, or repeats of motif 2. The activity was normalized to activity in the transfection control (Gaussialuciferase). Letters (a, b, and c) represent statistically significant differences atPvalues of ⬍0.05.
FIG 6Integrated analysis of expression profiling and genome occupancy data. (A) Overlap between genes with Meq binding sites identified by ChIP-seq experiments and differentially expressed genes based on microarray analysis in Meq-DF-1 cells. (B) Overlap between genes with binding sites common to both Meq and c-Jun and differential gene expression.
on November 7, 2019 by guest
http://jvi.asm.org/
[image:5.585.93.235.60.262.2] [image:5.585.115.472.516.693.2]lated and of the Meq-dependent decrease in expression of down-regulated genes (Fig. 9BandC). There was no detectable change in expression upon siRNA treatment in DF-1 control cells.
Integrated analysis of Meq binding sites and transcriptional
regulation.To determine if the location of Meq binding has any
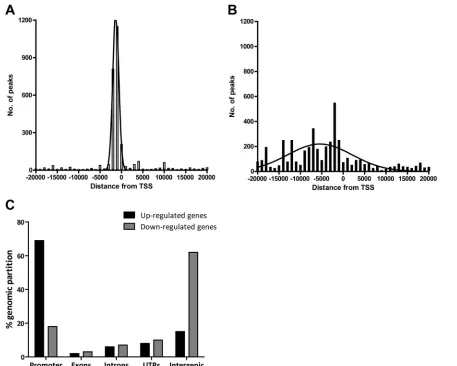
impact on differential transcriptional regulation, we analyzed the distribution of Meq binding sites of genes exhibiting up- or down-regulation. Notably, in upregulated genes (transcriptional
activa-tion), the Meq peaks were located closer to the TSS and concen-trated more narrowly (Fig. 10A) in comparison to those proximal to downregulated genes (Fig. 10B). Indeed, about 60% of tran-scriptionally activated genes contained Meq peaks within 2 kb around TSS, whereas the same proportion of transcriptionally re-pressed genes contained peaks within 15 kb. Not surprisingly, up-regulated genes showed a strong enrichment for Meq binding in the promoter region (about 70%), whereas the downregulated
FIG 7Pathway analysis of Meq-regulated genes. (A) Top 5 functional classifications based on canonical pathway analysis of differentially expressed genes with significant [⫺log (Pvalue) less than⫺1.3)] Meq binding sites using Ingenuity Pathway Analysis. (B) Overview of ERK/MAPK, Jak-STAT, and ErbB signaling pathways; the up- and downregulated genes are highlighted in green and red, respectively.
Genome-Wide Analysis of MDV Meq Regulation
on November 7, 2019 by guest
http://jvi.asm.org/
[image:6.585.71.518.68.576.2]genes had only modest enrichment in the same region (18%). In contrast, the region with strongest enrichment for Meq binding sites in downregulated genes was the intergenic region (62%) (Fig. 10C).
To investigate the role of differential binding to motifs and transcriptional regulation, we analyzed all Meq binding sites from upregulated and downregulated genes for the presence of these motifs. We found that motif 1 was overrepresented in upregulated genes while downregulated genes had a higher incidence of motif 2 (Fig. 11). Indeed, motif 1 was present in 85.6% of upregulated genes, whereas motif 2 was present in 84.1% of downregulated genes. We also investigated the possibility of contribution by other TFs to the ability of Meq to modulate transcription by analyzing overrepresented sequence motifs within the binding sites. The de-tails of these TF motifs in up- and downregulated genes along with relative abundance in differentially expressed genes are shown in Fig. 11. We found that binding motifs for other bZIP TFs like CREB1 and NFE2L2 are present in upregulated genes while motifs for TFs like Myc, BRCA1, and ZEB1 were found mostly in
down-regulated genes, which suggests additional mechanisms for coop-erativity among TF in regulating gene expression.
Differences in cellular pathways based on the presence of a certain motif were also examined by testing all genes with motif 1 or motif 2 for overrepresentation in specific canonical pathways. Among these, the ErbB signaling pathway and VEGF signaling pathway were common to both motifs. However, there were sig-naling pathways unique to each motif, as the MAPK, CDK5, and NF-B pathways were unique to motif 1 while the death receptor signaling, Jak-STAT, and telomerase signaling pathways were unique to motif 2 (Fig. 12AandB).
Functional validation of cellular pathways regulated by Meq:
effect of MAPK inhibitors on cellular proliferation.Assessment
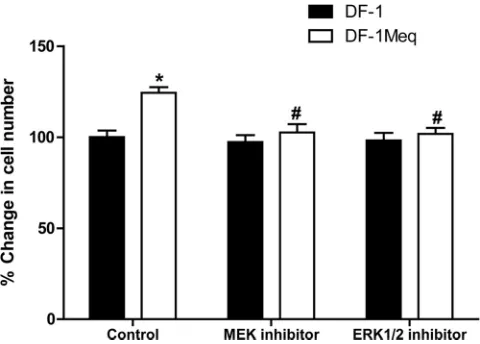
of cell proliferation is a reliable index of the transformative ability of Meq. Grown under serum-free conditions for 24 h, Meq-DF-1 cells reached a significantly higher cell number (25% increase,n⫽6;P⬍0.05) than did the parent cell line, DF-1 (Fig. 13). Furthermore, to assess the biological relevance of pathway analysis, we used specific inhibitors for some of the
FIG 8Comparison of gene expression through microarrays and qRT-PCR. (A) Correlation plot comparing differential gene expression using microarray analysis to qRT-PCR data on a subset of 20 genes in the Meq-DF-1 cell line. (B) qRT-PCR validation of microarray results of the microarray-based differentially expressed genes between Meq-DF-1 and DF-1 cells. Beta-actin was used as internal control; *,P⬍0.05 compared to DF-1 cells.
on November 7, 2019 by guest
http://jvi.asm.org/
[image:7.585.64.517.66.451.2]targets in top biological networks influenced by Meq expres-sion. Since the MAPK pathway was the top canonical pathway overrepresented in the Meq-induced transcriptome, we used inhibitors to two targets in this pathway. PD 98059, a selective and potent inhibitor of mitogen-activated protein kinase ki-nase (MAPKK/MEK), blocked the increase in cell number noted with Meq-DF-1 cells (Fig. 13). Similarly, inhibition of another downstream molecule, extracellular signal-regulated kinase (ERK), using a selective inhibitor, FR 180204, also blocked the proliferative effect of Meq (Fig. 13). This strongly supports the role of ERK/MAPK signaling in mediating the mitogenic effects of Meq.
DISCUSSION
Understanding the mechanisms involved in oncogenesis is essen-tial to develop long-term strategies to prevent and control MD. A comprehensive analysis of the target genes induced by its onco-protein, Meq, is an important first step in unraveling the mecha-nism of MDV oncogenesis. There is limited information on com-prehensive genome-wide studies examining the role of the Meq oncoprotein in transcriptional regulation of host genes. By inte-grating genome-wide chromatin occupancy data with a compre-hensive data set of Meq-induced gene expression changes, we have identified a high-confidence list of Meq target genes by correlating
in vivooccupancy and transcriptional activity in this study.
Con-sequently, these results have the potential to provide fundamental knowledge into how viral oncoproteins involved in cellular trans-formation regulate host gene regulatory networks.
ChIP-seq analysis revealed several insights into transcriptional
regulation by Meq. We generated a high-confidence list of genes that had Meq binding sites in the proximal promoter, and mRNA expression of⬃40% of them was induced or repressed in DF1-Meq in comparison to DF1. Not all genes with a DF1-Meq binding site were transcriptionally regulated based on our analyses, suggesting that binding site information alone is an insufficient predictor of transcriptional regulation. However, among the differentially ex-pressed genes, about 75% of them had evidence of Meq binding nearby. In addition, Meq binding to the chicken genome was non-random, with a strong preference for promoters (within 1 kb up-stream of the TSS) in the host genome. This result provides strong evidence that the main biochemical function of Meq is to regulate transcription.
Analysis of Meq peak locations within genes that were tran-scriptionally responsive revealed distinct functional consequences of DNA binding by Meq. Notably, in upregulated genes, the Meq peaks were located closer to the TSS and a majority of them were located within 1 kb of their promoters. This suggests that Meq acts as a transcriptional activator through short-range effects. On the other hand, Meq peaks in downregulated genes were located much farther from the TSS, on average, and located mostly in the intergenic regions. Thus, transcriptional repression by Meq could involve long-range effects and might involve other corepressor proteins and more than one mechanism, e.g., those TFs identified inFig. 11. Taken together, these findings indicate that the distinct localization of Meq binding in the chicken genome influences the nature of transcriptional activity in the host cell. Recent studies on genome-wide binding site characterization of other transcription
FIG 9Influence of Meq inhibition through siRNA. (A) Optimization of siRNA concentration and verifying efficiency of knockdown in Meq-DF-1 cells; *,P⬍
0.05 compared to no template (NT) controls. Gene expression changes after siRNA-mediated knockdown of Meq. A selected subset of upregulated (B) and downregulated (C) genes are shown; *,P⬍0.05 compared to DF-1 NT; #,P⬍0.05 compared to Meq-DF-1 NT.
Genome-Wide Analysis of MDV Meq Regulation
on November 7, 2019 by guest
http://jvi.asm.org/
[image:8.585.75.510.66.356.2]factors like Myb and PU.1 revealed a similar dependence of the location of transcription factor binding and its influence on dif-ferential regulation of transcription (27,28).
c-Jun has been shown to be an important partner for Meq in engaging cellular pathways leading to transformation (16). However, the specific involvement of this partnership in ge-nome-wide transcriptional regulation in the host has not been previously reported. We have generated a high-confidence list of genes that are coregulated by Meq. Colocalization of binding sites of Meq and c-Jun suggests cooperativity between these two factors in modulating transcription. A previous study in human erythroleukemia cells revealed that c-Jun binding sites were distributed more widely within 100 kb upstream of TSS (29). Since Meq is highly overexpressed in our model system, it is possible that the majority of c-Jun is bound with Meq to form heterodimers, and this may influence the distribution of c-Jun binding sites that we observed.
Two previously described DNA binding motifs (14,24) were confirmed in the Meq-enriched peak regions using position-weighted matrix analysis and motif discovery tools. Interestingly, the top motif in the genes that had peaks common to Meq and
c-Jun as well as the top motif among all upregulated genes was motif 1 (Fig. 11). Previous studies indicate that Meq and c-Jun form heterodimers and these heterodimers bind to AP-1-like sites, resulting in transcriptional activation, at least in the context of a few viral as well as host gene promoters (14,16,24). Although we have not directly tested the possibility of heterodimerization, the discovery of an AP-1-like motif in genes that bind to both Meq and c-Jun, as well as in upregulated genes, suggests a similar pos-sibility. Meq also has the ability to form homodimers with itself. These homodimers bind to a DNA sequence referred to as MERE-II and cause transcriptional repression (14). Motif 2 from our analysis had the core DNA binding sequence described as MERE-II, and this was the top motif found in all downregulated genes (Fig. 11). Also, this motif was not discovered in any c-Jun peaks. Taken together, these findings support the idea of Meq homodimers binding to this sequence and causing transcriptional repression.
Both heterodimers and homodimers of Meq have been shown to be necessary for transformation (30). Analysis of cellular path-ways in our study suggested that both the AP-1 and MERE-II motifs (which correspond to hetero- and homodimers,
respec-FIG 10Differential location of Meq binding sites in up- and downregulated genes. Combination of ChIP-seq data and gene expression analysis reveals a distinct localization of Meq peaks in up- and downregulated genes. Frequency distribution of Meq binding sites relative to the nearest TSS, represented in 1-kb intervals for a distance covering 20 kb in upregulated (A) and downregulated (B) genes. (C) Relative occupancy of Meq in genomic regions in upregulated and downregulated genes (P⬍0.001 compared to relative distributions in control regions by the2test).
on November 7, 2019 by guest
http://jvi.asm.org/
[image:9.585.71.528.64.430.2]tively) are involved in the regulation of genes involved in key pro-cesses like cell proliferation, cell cycle, and apoptosis. However, signaling pathways specific to genes with each motif suggest dis-tinct binding motif-dependent signatures in gene regulatory net-works. In other transcription factors like ectopic viral integration site 1 (EVI1) and PAX6, two DNA binding domains are associated with distinct motifs and regulate different sets of target genes in-volved in cellular transformation and development, respectively (31, 32). It would be interesting to further assess if the het-erodimers and homodimers of Meq regulate distinct subsets of
genes using modified constructs of Meq as utilized in some previ-ous studies (30,33,34).
The enrichment of Meq target genes for several neoplastic processes suggests that it probably acts as a multifunctional transcription factor that modulates multiple processes, includ-ing cell proliferation, apoptosis/survival, and cell migration. Some of the previous studies have described a few of the target genes modulated by Meq, involved in apoptosis and cell pro-liferation (16). However, there is little information on the reg-ulatory mechanisms through which Meq affects these features.
FIG 11Overrepresented motifs in up- and downregulated genes. Comparison of motifs along with sequence logos in up- and downregulated genes and the percentage of genes with the occurrence of each motif.
FIG 12Comparative enrichment of cellular pathways in genes with motif 1 (A) and motif 2 (B). Functional classification based on canonical pathway analysis of differentially expressed genes with significant Meq binding sites using Ingenuity Pathway Analysis. Only the top 5 pathways that reached significance [⫺log (P
value) less than⫺1.3] are shown.
Genome-Wide Analysis of MDV Meq Regulation
on November 7, 2019 by guest
http://jvi.asm.org/
[image:10.585.135.452.64.285.2] [image:10.585.138.449.474.690.2]Our analysis shows that Meq transcriptionally regulates many genes that are part of several signaling pathways, including the ERK/MAPK, Jak-STAT, and ErbB pathways, which are critical for oncogenesis (35–38).
Activation of ERK or MAPK by MEK is an essential event in mitogenic growth factor signal transduction (39). In our study, we found that Meq upregulates key players in the pathway like Ras, MEK1, and MEK2, which initiate downstream signaling leading to cell proliferation. Other tyrosine kinases like Src were also up-regulated by Meq. We also found that activating signals upstream of MAPKs, like ErbB, were upregulated. We have also functionally validated the relevance of MAPK signaling to the ability of Meq to transform cells by using specific inhibitors to MEK1/2 and ERK1/2. These inhibitors abrogated the proliferative effect of Meq, indicating that key mitogenic signals in the MAPK pathway are involved in mediating the effects of Meq on cell proliferation. Our results are in accordance with a proteomic analysis of an MDV lymphoblastoid cell line, which also indicates that signaling proteins in the ERK/MAPK pathway are involved in transforma-tion (40). The activation of Ras/ERK signals is essential for cellular transformation by LMP1, a major transforming viral oncoprotein of Epstein-Barr virus, a gammaherpesvirus (41,42). Furthermore, LMP1/2 transforms B lymphocytes by providing prosurvival sig-nals through constitutive phosphorylation of ERK/MAPK and Ras (43,44). In addition, several studies implicate the essential role of ERK/MAPK signaling in maintenance of latency (45), angiogenesis (46), and cell survival (47,48) by Kaposi’s sarcoma-associated herpesvirus. Thus, it would be of interest to further explore the possibility of convergent cellular signaling networks by which oncogenic herpesviruses regulate cellular processes and lead to transformation.
One of the major modes of regulating the MAPK pathway in-volves restriction of the magnitude and duration of activation (49). Because MAPKs are fully active only when phosphorylated, one effective mechanism of MAPK inactivation is dephosphory-lation by protein phosphatases (50). Interestingly, we found that Meq downregulated the expression of dual-specificity phosphata-ses like DUSP4, which inactivates the ERK1/2 family of MAPKs
(51, 52). Dual-specificity phosphatases, also known as MAPK phosphatases (MKPs), act as a negative regulatory feedback in modulating MAPK signaling. It has also been proposed that the integration of multiple MAPK pathways occurs at the level of MKPs (52). The role of MKPs in cancer is further underlined by the fact that decreased expression of MKPs is associated with poor prognosis in various malignancies in humans (53,54). In addi-tion, downregulation of serine/threonine phosphatases, including PP1 and PP2, which target proteins like MEK, Raf, and Akt (51, 55), was also noted. This family of phosphatases act as tumor suppressor genes that target the ERK/MAPK pathway (56). Sev-eral viral oncoproteins have been shown to induce transformation by downregulation of PP2 expression or by inhibiting its activity (57). PP2 has also been shown to be involved in inhibition of cyclin E/CDK2 complex (58), which is a key mediator in cell cycle progression. Taken together, to maintain a proliferative drive, our work suggests that Meq activates oncogenic signaling cascades by transcriptionally activating major kinases in the ERK/MAPK pathway and simultaneously repressing phosphatases. This ability of Meq appears to be a conserved mechanism of transformation by viral oncoproteins.
The ability of Meq to upregulate the expression of a mitogenic signal in a pathway and downregulate the inhibitory signal ap-pears to be a common strategy across multiple cellular pathways. For example, we found that a similar phenomenon occurs in the context of the Jak-STAT signaling pathway as well. We noted that STAT3, an oncogenic signal, was upregulated while negative reg-ulators of the pathway like SHP-1, SOCS2, and PIAS were down-regulated. STAT3 has been reported to be oncogenic in a number of malignancies in human patients (59–61). In contrast, SHP-1, SOCS, and PIAS have been shown to act as tumor suppressors (62–66). SOCS2 is an indispensable negative regulator of growth hormone (GH) actions (67), and SHP-1 negatively modulates GH-mediated signal transduction (68). It is interesting that GH is a putative MD resistance gene (69) and transformation by MDV involves negative regulation of GH downstream signaling media-tors.
Another theme that emerges from pathway analysis is the tran-scriptional regulation of key players that are involved in the regu-lation of multiple cellular pathways. Meq was noted to transcrip-tionally activate several members of the 14-3-3 protein family, which modulate the function of a diverse array of binding partners and hence function as key regulatory components of many vital cellular processes (70, 71). Cell cycle deregulation caused by changes in 14-3-3 expression has been implicated in cancer for-mation (71). 14-3-3 proteins function at several key points in the G1/S and G2/M transition by binding to regulatory proteins and modulating their function (72). In addition, these proteins also play a major role in regulating the MAPK pathway by contributing to activation of Raf, leading to cell proliferation (73,74). Meq also upregulated Grb2, an adaptor protein, which acts as a critical downstream intermediary in several oncogenic signaling path-ways. Grb2 has also been shown to link the ErbB receptor to the activation of Ras and its downstream kinases, ERK1/2 (75,76). Overexpression of Grb2 has been noted in several malignancies, including breast cancer and bladder cancer (77–79).
Dysregulation of the cellular apoptotic pathway due to a com-bination of activated antiapoptotic signals and inhibition of pro-apoptotic signals is one of the hallmarks of cancer (80). We noted that Meq manipulates several players in the apoptotic pathway to
FIG 13Functional validation of the role of ERK/MAPK signaling in Meq-mediated transformation using a cell proliferation assay. MEK or ERK inhib-itors blocked the proliferative effect of Meq; *,P⬍0.05 compared to DF-1 control; #,P⬍0.05 compared to Meq-DF-1 control.
on November 7, 2019 by guest
http://jvi.asm.org/
[image:11.585.43.283.66.238.2]shift cells toward an antiapoptotic phenotype. We found increased expression in antiapoptotic signals like Bcl-2 and Bcl-XL with a subsequent decrease in proapoptotic genes like Bid. Increased ex-pression of antiapoptotic genes like Bcl-2 and Bcl-XL by MDV has been well described previously (16,81,82). There was a decrease in expression of caspases 3 and 6, while an increase in expression of cIAP-1, an inhibitor of caspases, was noted. In MDV-transformed lymphoblastoid cell lines, a decrease in inhibitor of apoptosis (IAP) transcript levels was noted with induction of apoptosis (83). There also was a decrease in expression of AIFM1, a proapoptotic factor that induces apoptosis in a caspase-independent manner. Interestingly, we noted a relative downregulation of FOXO1A, an important transcription factor that regulates gene expression in response to tumor necrosis factor (TNF)-mediated apoptotic sig-nals (84). Thus, Meq controls several critical genes involved in apoptosis to promote transformation.
Taken together, our study using Meq-DF-1 cells as a model system for MDV-transformed CD4⫹cells provides novel insights on the mechanistic basis of how Meq and possibly other viral proteins that function as oncogenes transform cells and cause malignancies. In addition, our study provides a comprehensive analysis of how Meq interacts with host bZIP proteins like c-Jun to regulate transcription. These data implicate Meq in the regulation of the cellular ERK/MAPK, Jak-STAT, and apoptotic pathways to induce transformation, thus suggesting a novel pathogenicity mechanism for the oncogenicity of MDV. In addition, this study forms the basis for the selection of candidate genes’ allelic variation that might be involved in host genetic resistance to MD.
ACKNOWLEDGMENTS
We thank Laurie Molitor and Lonnie Milam (USDA, ARS, ADOL, East Lansing, MI) for technical assistance and Jerry Dodgson for critical input. This project was supported in part by National Research Initiative Competitive Grant no. 2009-35205-05035 from the USDA National In-stitute of Food and Agriculture.
REFERENCES
1.Osterrieder N, Kamil JP, Schumacher D, Tischer BK, Trapp S.2006. Marek’s disease virus: from miasma to model. Nat. Rev. Microbiol.4:283– 294.
2.Witter RL.1998. Control strategies for Marek’s disease: a perspective for the future. Poult. Sci.77:1197–1203.
3.Baigent SJ, Smith LP, Nair VK, Currie RJ.2006. Vaccinal control of Marek’s disease: current challenges, and future strategies to maximize protection. Vet. Immunol. Immunopathol.112:78 – 86.
4.Okazaki W, Purchase HG, Burmester BR. 1970. Protection against Marek’s disease by vaccination with a herpesvirus of turkeys. Avian Dis.
14:413– 429.
5.Witter RL.1997. Increased virulence of Marek’s disease virus field iso-lates. Avian Dis.41:149 –163.
6.Gimeno IM.2008. Marek’s disease vaccines: a solution for today but a worry for tomorrow? Vaccine26(Suppl 3):C31–C41.
7.Morrow C, Fehler F.2004. Marek’s disease: a world-wide problem, p 49 – 61.InDavison F, Nair V (ed), Marek’s disease. Academic Press, San Diego, CA.
8.Nair V, Kung HJ.2004. Marek’s disease virus oncogenicity: molecular mechanisms, p 32– 47.InDavison F, Nair V (ed), Marek’s disease. Aca-demic Press, San Diego, CA.
9.Jones D, Lee L, Liu JL, Kung HJ, Tillotson JK.1992. Marek disease virus encodes a basic-leucine zipper gene resembling the fos/jun oncogenes that is highly expressed in lymphoblastoid tumors. Proc. Natl. Acad. Sci. U. S. A.89:4042– 4046.
10. Lee LF, Wu P, Sui D, Ren D, Kamil J, Kung HJ, Witter RL.2000. The complete unique long sequence and the overall genomic organization of
the GA strain of Marek’s disease virus. Proc. Natl. Acad. Sci. U. S. A.
97:6091– 6096.
11. Lupiani B, Lee LF, Cui X, Gimeno I, Anderson A, Morgan RW, Silva RF, Witter RL, Kung HJ, Reddy SM. 2004. Marek’s disease virus-encoded Meq gene is involved in transformation of lymphocytes but is dispensable for replication. Proc. Natl. Acad. Sci. U. S. A.101:11815– 11820.
12. Xie Q, Anderson AS, Morgan RW.1996. Marek’s disease virus (MDV) ICP4, pp38, and meq genes are involved in the maintenance of transfor-mation of MDCC-MSB1 MDV-transformed lymphoblastoid cells. J. Vi-rol.70:1125–1131.
13. Kung HJ, Xia L, Brunovskis P, Li D, Liu JL, Lee LF.2001. Meq: an MDV-specific bZIP transactivator with transforming properties. Curr. Top. Microbiol. Immunol.255:245–260.
14. Qian Z, Brunovskis P, Lee L, Vogt PK, Kung HJ.1996. Novel DNA binding specificities of a putative herpesvirus bZIP oncoprotein. J. Virol.
70:7161–7170.
15. Ross NL.1999. T-cell transformation by Marek’s disease virus. Trends Microbiol.7:22–29.
16. Levy AM, Gilad O, Xia L, Izumiya Y, Choi J, Tsalenko A, Yakhini Z, Witter R, Lee L, Cardona CJ, Kung HJ.2005. Marek’s disease virus Meq transforms chicken cells via the v-Jun transcriptional cascade: a converg-ing transformconverg-ing pathway for avian oncoviruses. Proc. Natl. Acad. Sci. U. S. A.102:14831–14836.
17. Himly M, Foster DN, Bottoli I, Iacovoni JS, Vogt PK.1998. The DF-1 chicken fibroblast cell line: transformation induced by diverse oncogenes and cell death resulting from infection by avian leukosis viruses. Virology
248:295–304.
18. Langmead B, Trapnell C, Pop M, Salzberg SL. 2009. Ultrafast and memory-efficient alignment of short DNA sequences to the human ge-nome. Genome Biol.10:R25. doi:10.1186/gb-2009-10-3-r25.
19. Valouev A, Johnson DS, Sundquist A, Medina C, Anton E, Batzoglou S, Myers RM, Sidow A.2008. Genome-wide analysis of transcription factor binding sites based on ChIP-Seq data. Nat. Methods5:829 – 834. 20. Bailey TL, Williams N, Misleh C, Li WW.2006. MEME: discovering and
analyzing DNA and protein sequence motifs. Nucleic Acids Res.34:
W369 –W373.
21. Bailey TL, Boden M, Buske FA, Frith M, Grant E, Clementi L, Ren J, Li WW, Noble WS.2009. MEME SUITE: tools for motif discovery and searching. Nucleic Acids Res.37:W202–W208.
22. Scaffidi AK, Mutsaers SE, Moodley YP, McAnulty RJ, Laurent GJ, Thompson PJ, Knight DA.2002. Oncostatin M stimulates proliferation, induces collagen production and inhibits apoptosis of human lung fibro-blasts. Br. J. Pharmacol.136:793– 801.
23. Ohori M, Kinoshita T, Okubo M, Sato K, Yamazaki A, Arakawa H, Nishimura S, Inamura N, Nakajima H, Neya M, Miyake H, Fujii T.
2005. Identification of a selective ERK inhibitor and structural determina-tion of the inhibitor-ERK2 complex. Biochem. Biophys. Res. Commun.
336:357–363.
24. Levy AM, Izumiya Y, Brunovskis P, Xia L, Parcells MS, Reddy SM, Lee L, Chen HW, Kung HJ.2003. Characterization of the chromosomal binding sites and dimerization partners of the viral oncoprotein Meq in Marek’s disease virus-transformed T cells. J. Virol.77:12841–12851. 25. Wingender E, Dietze P, Karas H, Knüppel R.1996. TRANSFAC: a
database on transcription factors and their DNA binding sites. Nucleic Acids Res.24:238 –241.
26. Portales-Casamar E, Thongjuea S, Kwon AT, Arenillas D, Zhao X, Valen E, Yusuf D, Lenhard B, Wasserman WW, Sandelin A. 2010. JASPAR 2010: the greatly expanded open-access database of transcription factor binding profiles. Nucleic Acids Res.38:D105–D110.
27. Zhao L, Glazov EA, Pattabiraman DR, Al-Owaidi F, Zhang P, Brown MA, Leo PJ, Gonda TJ. 2011. Integrated genome-wide chromatin occupancy and expression analyses identify key myeloid pro-differentiation transcription factors repressed by Myb. Nucleic Acids Res.39:4664 – 4679.
28. Ridinger-Saison M, Boeva V, Rimmele P, Kulakovskiy I, Gallais I, Levavasseur B, Paccard C, Legoix-Ne P, Morle F, Nicolas A, Hupe P, Barillot E, Moreau-Gachelin F, Guillouf C.2012. Spi-1/PU. 1 activates transcription through clustered DNA occupancy in erythroleukemia. Nu-cleic Acids Res.40:8927– 8941.
29. Li M, Ge Q, Wang W, Wang J, Lu Z.2011. c-Jun binding site identifi-cation in K562 cells. J. Genet. Genomics38:235–242.
30. Suchodolski PF, Izumiya Y, Lupiani B, Ajithdoss DK, Lee LF, Kung HJ,
Genome-Wide Analysis of MDV Meq Regulation
on November 7, 2019 by guest
http://jvi.asm.org/
Reddy SM.2010. Both homo and heterodimers of Marek’s disease virus encoded Meq protein contribute to transformation of lymphocytes in chickens. Virology399:312–321.
31. Verbruggen V, Ek O, Georlette D, Delporte F, Von Berg V, Detry N, Biemar F, Coutinho P, Martial JA, Voz ML, Manfroid I, Peers B.2010. The Pax6b homeodomain is dispensable for pancreatic endocrine cell dif-ferentiation in zebrafish. J. Biol. Chem.285:13863–13873.
32. Bard-Chapeau EA, Jeyakani J, Kok CH, Muller J, Chua BQ, Gunaratne J, Batagov A, Jenjaroenpun P, Kuznetsov VA, Wei CL, D’Andrea RJ, Bourque G, Jenkins NA, Copeland NG.2012. Ecotopic viral integration site 1 (EVI1) regulates multiple cellular processes important for cancer and is a synergistic partner for FOS protein in invasive tumors. Proc. Natl. Acad. Sci. U. S. A.109:2168 –2173.
33. Brown AC, Smith LP, Kgosana L, Baigent SJ, Nair V, Allday MJ.2009. Homodimerization of the Meq viral oncoprotein is necessary for induc-tion of T-cell lymphoma by Marek’s disease virus. J. Virol.83:11142– 11151.
34. Suchodolski PF, Izumiya Y, Lupiani B, Ajithdoss DK, Gilad O, Lee LF, Kung HJ, Reddy SM.2009. Homodimerization of Marek’s disease virus-encoded Meq protein is not sufficient for transformation of lymphocytes in chickens. J. Virol.83:859 – 869.
35. Platanias LC. 2003. Map kinase signaling pathways and hematologic malignancies. Blood101:4667– 4679.
36. De Luca A, Maiello MR, D’Alessio A, Pergameno M, Normanno N.
2012. The RAS/RAF/MEK/ERK and the PI3K/AKT signalling pathways: role in cancer pathogenesis and implications for therapeutic approaches. Expert Opin. Ther. Targets16(Suppl 2):S17–S27.
37. Kiu H, Nicholson SE.2012. Biology and significance of the JAK/STAT signaling pathways. Growth Factors30:88 –106.
38. Sansone P, Bromberg J.2012. Targeting the interleukin-6/Jak/stat path-way in human malignancies. J. Clin. Oncol.30:1005–1014.
39. Zheng CF, Guan KL.1993. Properties of MEKs, the kinases that phos-phorylate and activate the extracellular signal-regulated kinases. J. Biol. Chem.268:23933–23939.
40. Buza JJ, Burgess SC.2007. Modeling the proteome of a Marek’s disease transformed cell line: a natural animal model for CD30 overexpressing lymphomas. Proteomics7:1316 –1326.
41. Roberts ML, Cooper NR.1998. Activation of a ras-MAPK-dependent pathway by Epstein-Barr virus latent membrane protein 1 is essential for cellular transformation. Virology240:93–99.
42. Dawson CW, Laverick L, Morris MA, Tramoutanis G, Young LS.2008. Epstein-Barr virus-encoded LMP1 regulates epithelial cell motility and invasion via the ERK-MAPK pathway. J. Virol.82:3654 –3664.
43. Portis T, Longnecker R.2004. Epstein-Barr virus (EBV) LMP2A mediates B-lymphocyte survival through constitutive activation of the Ras/PI3K/ Akt pathway. Oncogene23:8619 – 8628.
44. Anderson LJ, Longnecker R.2008. EBV LMP2A provides a surrogate pre-B cell receptor signal through constitutive activation of the ERK/ MAPK pathway. J. Gen. Virol.89:1563–1568.
45. Xie J, Ajibade AO, Ye F, Kuhne K, Gao SJ.2008. Reactivation of Kaposi’s sarcoma-associated herpesvirus from latency requires MEK/ERK, JNK and p38 multiple mitogen-activated protein kinase pathways. Virology
371:139 –154.
46. Ye FC, Blackbourn DJ, Mengel M, Xie JP, Qian LW, Greene W, Yeh IT, Graham D, Gao SJ.2007. Kaposi’s sarcoma-associated herpesvirus pro-motes angiogenesis by inducing angiopoietin-2 expression via AP-1 and Ets1. J. Virol.81:3980 –3991.
47. Lambert PJ, Shahrier AZ, Whitman AG, Dyson OF, Reber AJ, Mc-Cubrey JA, Akula SM.2007. Targeting the PI3K and MAPK pathways to treat Kaposi’s-sarcoma-associated herpes virus infection and pathogene-sis. Expert Opin. Ther. Targets11:589 –599.
48. Cai Q, Verma SC, Lu J, Robertson ES. 2010. Molecular biology of Kaposi’s sarcoma-associated herpesvirus and related oncogenesis. Adv. Virus Res.78:87–142.
49. Chen RE, Thorner J.2007. Function and regulation in MAPK signaling pathways: lessons learned from the yeast Saccharomyces cerevisiae. Biochim. Biophys. Acta1773:1311–1340.
50. Keyse SM.2000. Protein phosphatases and the regulation of mitogen-activated protein kinase signalling. Curr. Opin. Cell Biol.12:186 –192. 51. Camps M, Nichols A, Arkinstall S.2000. Dual specificity phosphatases: a
gene family for control of MAP kinase function. FASEB J.14:6 –16. 52. Owens DM, Keyse SM. 2007. Differential regulation of MAP kinase
signalling by dual-specificity protein phosphatases. Oncogene26:3203– 3213.
53. Haagenson KK, Wu GS.2010. Mitogen activated protein kinase phos-phatases and cancer. Cancer Biol. Ther.9:337–340.
54. Wu S, Wang Y, Sun L, Zhang Z, Jiang Z, Qin Z, Han H, Liu Z, Li X, Tang A, Gui Y, Cai Z, Zhou F.2011. Decreased expression of dual-specificity phosphatase 9 is associated with poor prognosis in clear cell renal cell carcinoma. BMC Cancer11:413. doi:10.1186/1471-2407-11 -413.
55. Westermarck J, Li SP, Kallunki T, Han J, Kähäri VM. 2001. p38 mitogen-activated protein kinase-dependent activation of protein phos-phatases 1 and 2A inhibits MEK1 and MEK2 activity and collagenase 1 (MMP-1) gene expression. Mol. Cell. Biol.21:2373–2383.
56. Mumby M.2007. PP2A: unveiling a reluctant tumor suppressor. Cell
130:21–24.
57. Garibal J, Hollville E, Bell AI, Kelly GL, Renouf B, Kawaguchi Y, Rickinson AB, Wiels J.2007. Truncated form of the Epstein-Barr virus protein EBNA-LP protects against caspase-dependent apoptosis by inhib-iting protein phosphatase 2A. J. Virol.81:7598 –7607.
58. Mochida S, Hunt T.2012. Protein phosphatases and their regulation in the control of mitosis. EMBO Rep.13:197–203.
59. Sehgal PB.2000. STAT-signalling through the cytoplasmic compartment: consideration of a new paradigm. Cell. Signal.12:525–535.
60. Burke WM, Jin X, Lin HJ, Huang M, Liu R, Reynolds RK, Lin J.2001. Inhibition of constitutively active Stat3 suppresses growth of human ovar-ian and breast cancer cells. Oncogene20:7925–7934.
61. Hodge DR, Hurt EM, Farrar WL.2005. The role of IL-6 and STAT3 in inflammation and cancer. Eur. J. Cancer41:2502–2512.
62. Wu C, Guan Q, Wang Y, Zhao ZJ, Zhou GW.2003. SHP-1 suppresses cancer cell growth by promoting degradation of JAK kinases. J. Cell. Biochem.90:1026 –1037.
63. Wu C, Sun M, Liu L, Zhou GW.2003. The function of the protein tyrosine phosphatase SHP-1 in cancer. Gene306:1–12.
64. Ehrmann J, Strakova N, Vrzalikova K, Hezova R, Kolar Z. 2008. Expression of STATs and their inhibitors SOCS and PIAS in brain tumors. In vitro and in vivo study. Neoplasma55:482– 487.
65. Barclay JL, Anderson ST, Waters MJ, Curlewis JD.2009. SOCS3 as a tumor suppressor in breast cancer cells, and its regulation by PRL. Int. J. Cancer124:1756 –1766.
66. Coppola D, Parikh V, Boulware D, Blanck G.2009. Substantially re-duced expression of PIAS1 is associated with colon cancer development. J. Cancer Res. Clin. Oncol.135:1287–1291.
67. Greenhalgh CJ, Alexander WS.2004. Suppressors of cytokine signalling and regulation of growth hormone action. Growth Horm. IGF Res.14:
200 –206.
68. Ram PA, Waxman DJ.1997. Interaction of growth hormone-activated STATs with SH2-containing phosphotyrosine phosphatase SHP-1 and nuclear JAK2 tyrosine kinase. J. Biol. Chem.272:17694 –17702. 69. Liu HC, Kung HJ, Fulton JE, Morgan RW, Cheng HH.2001. Growth
hormone interacts with the Marek’s disease virus SORF2 protein and is associated with disease resistance in chicken. Proc. Natl. Acad. Sci. U. S. A.
98:9203–9208.
70. Wilker E, Yaffe MB.2004. 14-3-3 Proteins—a focus on cancer and hu-man disease. J. Mol. Cell. Cardiol.37:633– 642.
71. Freeman AK, Morrison DK.2011. 14-3-3 Proteins: diverse functions in cell proliferation and cancer progression. Semin. Cell Dev. Biol.22:681– 687.
72. Hermeking H, Benzinger A.2006. 14-3-3 proteins in cell cycle regulation. Semin. Cancer Biol.16:183–192.
73. Freed E, Symons M, Macdonald SG, McCormick F, Ruggieri R.1994. Binding of 14-3-3 proteins to the protein kinase Raf and effects on its activation. Science265:1713–1716.
74. Irie K, Gotoh Y, Yashar BM, Errede B, Nishida E, Matsumoto K.1994. Stimulatory effects of yeast and mammalian 14-3-3 proteins on the Raf protein kinase. Science265:1716 –1719.
75. Downward J.1994. The GRB2/Sem-5 adaptor protein. FEBS Lett.338:
113–117.
76. Tari AM, Lopez-Berestein G.2001. GRB2: a pivotal protein in signal transduction. Semin. Oncol.28:142–147.
77. Daly RJ, Binder MD, Sutherland RL.1994. Overexpression of the Grb2 gene in human breast cancer cell lines. Oncogene9:2723–2727. 78. Watanabe T, Shinohara N, Moriya K, Sazawa A, Kobayashi Y, Ogiso Y,
Takiguchi M, Yasuda J, Koyanagi T, Kuzumaki N, Hashimoto A.2000.
on November 7, 2019 by guest
http://jvi.asm.org/
Significance of the Grb2 and son of sevenless (Sos) proteins in human bladder cancer cell lines. IUBMB Life49:317–320.
79. Giubellino A, Burke TR, Bottaro DP.2008. Grb2 signaling in cell mo-tility and cancer. Expert Opin. Ther. Targets12:1021–1033.
80. Hanahan D, Weinberg RA.2000. The hallmarks of cancer. Cell100:
57–70.
81. Liu JL, Ye Y, Lee LF, Kung HJ.1998. Transforming potential of the herpesvirus oncoprotein MEQ: morphological transformation, se-rum-independent growth, and inhibition of apoptosis. J. Virol.72:
388 –395.
82. Ohashi K, Morimura T, Takagi M, Lee SI, Cho KO, Takahashi H, Maeda Y, Sugimoto C, Onuma M.1999. Expression of bcl-2 and bcl-x genes in lymphocytes and tumor cell lines derived from MDV-infected chickens. Acta Virol.43:128 –132.
83. Takagi M, Takeda T, Asada Y, Sugimoto C, Onuma M, Ohashi K.2006. The presence of a short form of p53 in chicken lymphoblastoid cell lines during apoptosis. J. Vet. Med. Sci.68:561–566.
84. Alikhani M, Alikhani Z, Graves DT.2005. FOXO1 functions as a master switch that regulates gene expression necessary for tumor necrosis factor-induced fibroblast apoptosis. J. Biol. Chem.280:12096 –12102.
Genome-Wide Analysis of MDV Meq Regulation
![FIG 7 Pathway analysis of Meq-regulated genes. (A) Top 5 functional classifications based on canonical pathway analysis of differentially expressed genes withsignificant [�log (P value) less than �1.3)] Meq binding sites using Ingenuity Pathway Analysis](https://thumb-us.123doks.com/thumbv2/123dok_us/149274.26418/6.585.71.518.68.576/functional-classications-canonical-differentially-expressed-withsignicant-ingenuity-analysis.webp)