Research Article
Optimum Configuration of Solar PV Topologies for DC Microgrid
Connected to the Longhouse Communities in Sarawak, Malaysia
Mohd R. M. Sharip
,
1Ahmed M. A. Haidar
,
1,2and Aaron C. Jimel
11Department of Electrical and Electronics Engineering, Universiti Malaysia Sarawak, Sarawak, Malaysia
2School of Mechanical and Electrical Engineering, University of Southern Queensland, QLD, Australia
Correspondence should be addressed to Ahmed M. A. Haidar; ahaidar67@yahoo.com
Received 28 August 2018; Accepted 21 November 2018; Published 19 February 2019
Academic Editor: Alberto Álvarez-Gallegos
Copyright © 2019 Mohd R. M. Sharip et al. This is an open access article distributed under the Creative Commons Attribution License, which permits unrestricted use, distribution, and reproduction in any medium, provided the original work is properly cited.
In the past few years, the prime focus of supplying electricity to the longhouse communities in the rural areas of Sarawak has been initiated based on the utilization of a single-source microgrid configuration. The existing AC power supply-based solar photovoltaic (PV) systems in these areas pose many problems, mainly owing to the stages of conversion, energy losses, and the quality of power transfer. As the solar PV system is a DC source and most of the appliances in longhouse communities could be operated using DC source, an opportunity to design a microgrid with high reliability and efficiency would be achieved by the implementation of an optimal DC microgrid configuration. With this aim, the paper proposes a multiple-source DC microgrid configuration for the longhouse communities in Sarawak. Initially, a framework has been developed to design simulation models for both microgrid configurations (single and multiple sources) using MATLAB Simulink. The configuration of each system consists of a solar PV and energy storage to form a standalone microgrid. Due to the change in system configuration of DC microgrid, in the modeling approach, the standard power flow equations are modified to include solely the DC parameters. To validate the proposed configuration with the associated modeling approach in terms of the powerflow reliability, system efficiency, and power-voltage curve, an experimental setup representing the Simulink model has been designed for each standalone microgrid configuration. The configurations have been assessed in the same location with different daily weather conditions. The obtained simulation and experimental results confirm that the proposed configuration of multiple sources is more reliable and efficient than the existing single-source configuration.
1. Introduction
In Sarawak, the widely used renewable energy sources (RESs) to supply the consumers in the remote areas are the solar PV systems and small hydropower generators. It is reported in [1] that 80% of Malaysians prefer using solar energy as the main source of electricity, whereas 84% believe that the most suitable source in Malaysia is solar energy. This indicates a higher demand for solar PV systems as compared to other types of renewable energy systems. Hence, new approaches should be developed to maximize the usage of energy from renewable resources [2]. This section sheds the light on the electricity coverage in Sarawak and reviews the research work carried out on the DC microgrids. The contribution and
paper organization with the schematic overview are also pre-sented in this section.
1.1. Motivation.The state of Sarawak has the lowest
electric-ity coverage in the rural areas as compared to other states in Malaysia. Due to the variable tropical climate in Sarawak, maintaining a reliable power supply is one of the main con-cerns in the existing AC microgrid-based PV systems. According to the statistics provided by the Ministry of Public Utilities, in 2010, the percentage of electrified houses in the rural areas of Sarawak was approximately 78%. This implies that a large number of electricity users in the remote villages have the potential of obtaining electricity through the main utility grid, while others can only get electricity by installing Volume 2019, Article ID 2657265, 13 pages
different types of RESs [3]. In fact, consumers living in the rural areas of Sarawak are experiencing limited access to elec-tricity; this is due to the geographical difficulty in installing transmission and distribution systems to deliver electricity from the main grid, as such systems must pass through rough terrain and dense jungle. Additionally, the cost of installing transmission and distribution systems does not offset with the amount of electricity consumption. Hence, it is not eco-nomically feasible to install transmission and distribution systems in these rural areas. This is the main reason that the electric utility and government are not taking any measures in extending the electricity coverage to the rural consumers since these areas are not densely populated and have low electricity demand [2]. Indeed, if the state or the country needs to improve its economic development and technologi-cal advancement, increasing the electricity coverage towards the rural areas is as crucial as that in the urban areas.
1.2. Literature Survey.A microgrid is a local power network
capable of supplying electricity to a specific region and can be connected to the main grid. As the number of microgrids is increasing, the integration of these micro-grids with the power grid can improve the reliability and efficiency of the power system. However, the traditional power grid is not suited to coping with the penetration of RESs. This makes electric utilities to put more effort to upgrade the current power grid towards a smart inte-grated power grid with efficient renewable energy manage-ment systems. The worthily study in [4] provides a complete presentation on the development of a smart energy system capable of managing a number of energy resources and loads in a coordinated environment. The smart energy hub-based cloud computing as proposed in [4] is an upgraded model that can enable energy users connected to a hybrid grid par-ticipate in the demand side program. Additionally, this pro-posed approach can also be implemented to a hybrid grid which is a combination of microgrids. These microgrids can be either AC- or DC-based different RESs and inte-grated with each other through sensor nodes and intelligent devices. DC microgrids were considered to be a possible and cost-effective solution to achieve better and simpler control if the total power is generated from a combination of RESs [5, 6]. The cloud computing-based real-time simulation has also been proposed in [7] for solving the optimal power routing problems. In comparison with the study provided by [4], the authors in [7] have considered multiple DC micro-grids in each cluster. The main idea behind this approach is to manage the congestion through DC lines in a meshed net-work topology, and thus, the energy can be transmitted from the microgrid with extra power to the microgrids suffering a power shortage. As the scope of this paper is focused on the optimal DC microgrid configuration, the next paragraphs review the published works on some aspects of DC micro-grids such as powerflow modeling, voltage levels including the power losses, and the architecture of DC microgrids.
Generally, electric power thatflows within the AC or DC microgrid system can be produced from both RESs such as wind turbine, solar PV, and microhydro turbine system and non-RESs such as gas turbines, steam turbines, diesel engine
generator, and also coal turbines. The powerflow manage-ment of the energy resource with less number of conversion stages was already discussed in numerous published articles [8–21], mainly the performance in the DC microgrid when using a suitable voltage level. It was found that the energy storage control to maintain a constant DC power flow to the DC load can easily be realized since the energy storage control system is connected to the DC-DC converter [8–16]. Authors in [17, 18] proposed different modeling methods for powerflow analysis. For instance, in [17], a drop control was considered in the modeling of the power flow, while in [18], the power flow analysis was formulated for both AC and DC microgrids by considering the virtual impedance and drop control in the modeling approach. The DC power flow analysis based on the modification of Newton-Raphson method was also introduced in [19] for off-grid- and weak-grid-connected communities. Mean-while, authors in [20, 21] addressed the problem of optimal powerflow in AC-DC networks. The idea here is to minimize the cost of total electricity generation in the networks and the cost of active power transfer in the DC microgrids.
For the deployment of low-voltage DC distribution sys-tem, the voltage level is highly dependent on the scale of the microgrid and can be varied according to the load requirements. Typically, the nominal voltage level of 200 V or 380 V DC is most suitable for high power rating appliances [22], whereas 12 V or 24 V DC can be selected for appliances with a low power rating. It is to be noted that a major amount of power losses may occur when using a heavy load with low voltage levels as it was investigated in [23–25]. The compar-ison study provided in [26] presents an analysis of the power losses at different voltage levels and conductor diameter as well. A similar analysis was also conducted in [19]. It can be concluded that the parameters of the DC system (voltage level, load demand, length, and diameter of the distribution system) should thoroughly be considered while designing the component of DC microgrid [27]. Although DC micro-grid systems were studied intensively in recent years, DC microgrid design in terms of load and source configuration still lacks common standards. Additionally, most of the pub-lished articles are focused on the conversion side of micro-grid, particularly in the aspects of implementing effective control techniques.
In the typical DC microgrid system, a house in the village generally consumes about 100–150 W; its load mostly con-sists of multiple DC fans, LED, or DC light bulb and a DC-AC converter or inverter for other electrical appliances. A low DC voltage (12 or 24) is normally used for lower power applications [13, 14, 19, 28]. It should be noted that the loads in the villages of Sarawak normally consist of lighting systems and low-power apparatus. These loads are supplied from solar PV sources connected to deep cycle lead-acid batteries; thus, a low voltage 12 V or 24 V can be the best option as the distance from each source into each load within the long-house communities is very short. However, the inconsistent solar radiation, changing temperatures, high humidity, and heavy rainfall of the tropical climate in Sarawak could be the main obstacle to implement the usage of solar DC micro-grid system in its current form. Hence, for better power transfer, it is critical to identify the optimum configuration for a ring connection of DC microgrid-based solar PV sys-tems as proposed in this paper.
1.3. Contribution. The existing problem is how to maintain
the system reliability and efficiency in the DC microgrids containing power sources and loads while at the same time ensuring that the system is running with less power loss. In comparison with the current studies, the paper introduces an improved solar PV topology for a ring DC microgrid con-nected to the longhouse communities. The proposed scheme is known as a multiple-source configuration. The main con-tributions of the paper are summarized as follows:
(i) A framework-based modeling approach associated with experimental validation has been developed to assess the optimum configuration of a ring DC microgrid system. A procedure has also been imple-mented for the input data of the experimental setup to be cointegrated with the Simulink models
(ii) Two designs of Simulink models have been developed using MATLAB for two configurations, namely, known as single source and multiple sources. Each configuration has also been modeled to include the DC powerflow parameters, considering the changes in the solar irradiance and temperature
(iii) For each configuration, a hardware representing the Simulink model has been structured to verify the optimal configuration. A variety of illustrative learn-ing processes are presented to show how the compo-nents of hardware were systematized. One vital
finding is that, with the implementation of the pro-posed multiple-source configuration, higher effi -ciency can be achieved in the range of 98% when the temperature is 26°C and solar irradiance is at
the maximum level. However, the efficiency can be dropped into 95% when the temperature reaches (37°C). On the other hand, when using the existing single-source configuration with similar tempera-tures (26°C and 37°C) as in multiple-source confi gu-ration, the highest efficiency is 91 whereas the lowest is 88
1.4. Paper Organization. This paper is organized as
fol-lows: an overview of the renewable energy usage in Sara-wak is presented in Section 1 as well as the electricity Initial data
collection
System modeling
Stage 1
Design the Simulink models
Testing using the initial data
Stage 2
Design of the experiments
Stage 3
Real-time hardware test Simulation with
real-time data
Performance evaluation Design selection
for assessment Area
selection
Figure1: Schematic overview of the paper.
Bus 1
Bus 2 Bus 3
Solar source
Solar source Energy storage
Solar charger
DC load
DC load DC load
+ −
[image:3.600.101.504.73.229.2] [image:3.600.66.285.83.490.2]coverage in the rural areas. This section also outlines the literature survey and the main contribution of the paper. Section 2 explains the modeling approach of the proposed configuration with multiple sources and the existing single-source configuration; the application of DC power
flow with the associated equations is also elaborated in this section. The experimental setup with the procedures of conducting real-time measurements is given in Section 3; the location of the installed system for investigation is also emphasized in this section. Section 4 discusses the obtained simulation and experimental results and thoroughly validates the mainfinding. Finally, Section 5 summarizes the goal of the paper and presents the significant results; this section also provides suggestions for future works. For the sake of more clarification, the schematic overview of the paper is depicted in Figure 1.
2. System Modeling
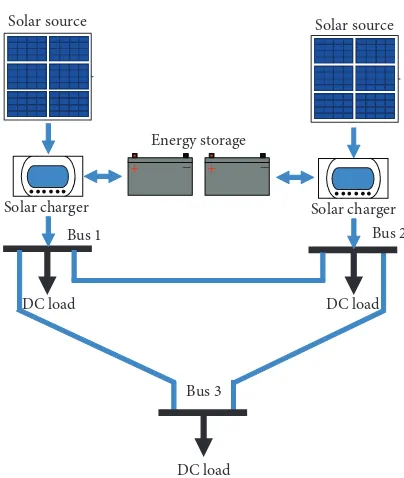
2.1. Test System and Data Collection.In this work, two
con-figurations have been assumed: in the first, the microgrid connected to a single source while the second to multiple sources as depicted in Figures 2 and 3, respectively. Both
con-figurations consist of a solar charge controller, energy storage, three loads, and two solar panels but in different arrange-ments. The voltage level considered to compare the perfor-mance of each configuration is 12 V DC [15, 19]. In each low-voltage DC microgrid configuration, the solar PV array is the source of power and connected to the energy storage (lead-acid batteries) through a solar power regulator, which is used to control the charging level of the energy storage.
The needed input variables to evaluate system perfor-mance using both software and hardware are the solar irradi-ation (W/m2) and temperature (°C). These variables have been measured on an hourly basis using a solar power meter
(Tenmars Electronics Co., TM-206), while the temperature utilizing the noncontact infrared thermometer (Extech Instruments 42509). Note that the collected data during day-light (from 9.00 a.m. to 4.00 p.m.) as shown in Figure 4 was used as an input data during the experimental works. The same data was also imported into the MATLAB Simulink models of the single and multiple sources.
2.2. DC Microgrid Analysis. Since the DC microgrid will
be proposed in the rural areas of Sarawak, an accurate model that reflects the behavior of a real system can give a better understanding of the practical DC microgrid opera-tion. The detailed modeling of the standard power flow analysis is well documented in [17–21, 29, 30], and hence not presented in this section. Note that DC microgrid configuration-based solar PV system is addressed in this paper with theflow of power from the solar PV source into the DC load. The solar PV array with the maximum power point tracking algorithm and the power conversion modeling are out of the scope. Neglecting the reactive power and the phase angle between the load and source in the powerflow analysis, the simplified power flow equation given in (1) can be applied to the circuit diagrams of the DC microgrids shown in Figures 2 and 3.
Pdc,i= 〠 n
j=1
Vdc,i Vdc,j Ydc,ij , 1
where Yij is the admittance between the nodes andVi are
Vj are the voltages between the line connecting nodes i
and j. In the DC microgrid, the Jacobian matrix [J] in the Newton-Raphson method gives the linear relationship of the change in the voltageΔVwith the variation in the active powerΔP. Hence, the general form for obtaining the residual power atith nod afterkth iteration is found as follows:
ΔPkdc,i = J ΔVkdc,i 2
Referring to Figures 2 and 3, a dynamic system has been modeled for each configuration using the MATLAB Simu-link as shown in Figures 5 and 6. In these models, the total balance between the generated power from the solar PV
“PPV t ” at time t (including the discharging power from the battery “Pdis
B t ”) and the consumed load “PLd t ” (including the charging power by the battery “Pch
B t ”with power losses“PLs t ”) can be written as follows:
〠PPV t +〠PdisB t =〠PLd t +〠PchB t +〠PLs t 3
3. Experimental Setup
3.1. Hardware Structure.The preparation stage started with
the assembling of all components on the source side such as the solar kits which consist of the PV panels, charge control-lers, batteries, and their respective cables and connectors. As for the DC loads, the three light bulbs in each configuration were connected to their own rheostat through a terminal
DC load
Bus 1 Bus 2
Bus 3
Solar source
Solar charger Solar charger
Energy storage Solar source
DC load
DC load −
+ + −
[image:4.600.68.270.68.307.2]connector strip. The experimental work has been in the Fac-ulty of Engineering, Universiti Malaysia Sarawak [31], near the Renewable Energy Laboratory as seen in Figure 7. During the conduction of the experimental research for both confi g-urations, the solar panels were installed directly under the sunshine in an open area. Figures 8 and 9 show the hardware structure with the associated components of the single and multiple sources, respectively. The solar panels of the single-source configuration were placed as close as possible to each other and connected in parallel with the solar charger located at bus 1 as seen in Figure 8. In the multiple-source configuration, the solar panels were placed at a distance of 3 meters from each other and connected to different solar chargers on buses 1 and 2 as shown in Figure 9.
3.2. Experimental Procedures.Before the commencement of
experimental studies, routine tests for the components of the DC microgrid have been conducted to ensure that they are properly functioning.
(i) Solar panels were tested under bright sunlight condi-tion and their voltages, currents, and power outputs were recorded under open-circuit voltage and short circuit current tests
(ii) Theflow of power through the charge controller was measured at the battery and load sides
(iii) The voltage with the current of each battery was tested when the load was connected to the DC bus
Solar power
meter (W/m2)
IR thermometer (°C)
800
600
400
200
0
9 10 11 12
Time (hours) Time (hours)
13 14 15 16
35
30
25
9 10 11 12 13 14 15 16
Ir radia n ce (W/m 2) T em p era tur e ( ° C)
Figure4: Measuring the solar irradiance and temperature on the solar PV panel.
Variable Resistor Variable Resistor Variable Resistor V V V V V V V V V V V V V V V V V V V V V V V V V V V V V V V V V V
Variable Resistor
V V V V V V V V V V V V V V V V V V V V V V V V V V V V V V V V V V V V V V V V V V V V V V V V V V V V V V V V V V V V V V V V V V V V V V V V V V V V V V Pin Pbatt Power (Batt) <Voltage (V)> Pload Resistance2 Resistance3 Resistance1 15 14.2 14.9 1 P1 P2 P3 Irradiation
\Matlab Data input\ Sheet:Single
\Matlab Data input\ Sheet: Single Temperature Discrete 0.05 s. m lr T + − m lr T + − m + + −in in P Out
out
+ +
−in in P Out
out
+
−in −out in P Out
+
−in −out in P Out +
−in −out in P Out
PV + PV− Load+ Load− Batt+ Batt− + + + − + − − + − − × i i i i
[image:5.600.95.508.72.310.2] [image:5.600.55.550.354.535.2](iv) The rheostats (used as variable DC loads) connected to constant DC loads were tested in each bus by measuring the absorbed value of the active power
(v) The constant DC load (light bulb) at each bus was tested using a low-voltage DC source, which can be obtained by regulating the rheostats
The configurations of DC microgrid-based solar PV sys-tems were designed to analytically and experimentally detect and characterize the best operational performance, by mea-suring their relevant parameters (such as theflow of power and the voltage in each bus). Referring to Figures 5 and 6, the developed MATLAB models for simulating the two DC configurations have helped in knowing the likely results of the real-time testing using the designed hardware of each configuration. The practical work of building the experimen-tal setup mounting took some days, and the experiment of each configuration has been repeatedfive times on different sunny days. As seen from Figures 8 and 9, the connections
of the experimental apparatus utilized for the measure-ments were designed to properly identify the information of each parameter and in each specific location. The elec-trical characteristics data gathered from a number of appa-ratus (Fluke 15B+ digital multimeter and Fluke 317 clamp meter) including the observed measurements of solar irradi-ance and temperature (see Figure 4) was used to analyze the performances of the two configurations which are graphically shown and also tabulated as discussed in the next section.
4. Results and Discussion
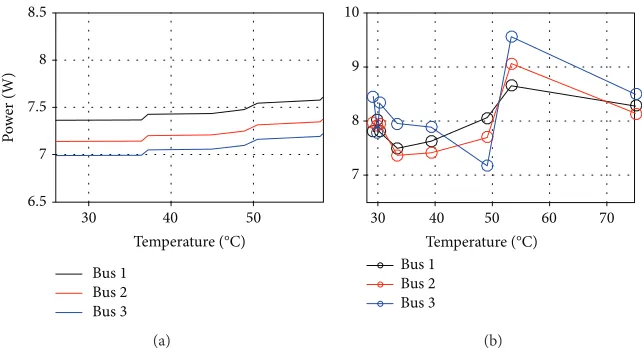
This section presents the results obtained through the simu-lation and experimental studies that aim at vindicating the importance of selecting the optimal multiple-source confi gu-ration for the DC microgrid compared to the existing confi g-uration which is mainly single source. The results of the simulation for analyzing the powerflow reliability, efficiency, and P-V curves were compared with the experimental results as depicted in Figures 10–17. The MATLAB results of the absorbed power as a function of solar irradiance are shown in Figures 10(a) and 10(b) for both single and multiple sources. On the other hand, the results of the absorbed power as a function of temperature with the increment in the solar irradiance are depicted in Figures 11(a) and 11(b) for the two configurations.
The power curves of the single source in Figure 10(a) indi-cate that bus 1 has the highest power absorption as the solar PV source connected to this bus. However, in the confi gura-tion of multiple sources, the absorbed power in each bus is notably changed with the increment of solar irradiance (see Figure 10(b)). Compared to the single-source configuration, it is seen from thisfigure that the system is operating at high power absorption even at the time of low solar irradiance. Referring to Figure 11, the absorbed power of each bus in the single-source shows a linear change with the increment
V V V V V V V V V V V V V V V V V V V V V V V V V V V V V V V V V V V V V V V V V V V V V V V V V V V V V V V V V V V V V V V V V V V V V V V V V V V V V V V V V V V V V V V V V V V V V V ariable Resistor ariable Resistor ariable Resistor <Voltage (V)> <Voltage (V)> Pin1 Pin2 Pbatt1 Pbatt2 Pload2 P1 P2 P3 Pload1 Resistance1 Resistance3 15 2 1 12+ 12− 13− Irradiation
\Matlab Data input\ Sheet:Multi
\Matlab Data input\ Sheet:Multi
\Matlab Data input\ Sheet:Multi
\Matlab Data input\ Sheet:Multi Discrete 0.05 s. + + −in
in P Out out
+
−in −out in P Out
14.9
3
+
−in −out in P Out
Resistance2
14.2
+
−in −out in P Out PV + PV− Load+ Load− Batt+ Batt− Temperature Power (Batt1) Power (Batt2) Irradiation2 <V_PV> <I_PV> × 23− + − i + + −in
in P Out out PV + PV− Load+ Load− Batt+ Batt− +
− i + −i + − i + −i m + − m + − <V_PV> <I_PV> × × × Temperature2 m lr T + − m lr T + −
Figure6: MATLAB Simulink model of the multiple-source configuration.
[image:6.600.71.532.74.306.2] [image:6.600.84.257.339.464.2]of temperature (see Figure 11(a)), while Figure 11(b) shows remarkable variations of the absorbed power in each bus with the change of temperatures. It is also observed that the peak power absorption occurs when the temperature reaches 53°C in the configuration of multiple sources.
Figures 12–15 depict the distributed power in each
con-figuration for the Simulink models and hardware experi-ments. Although there are some changes in the values of
power in the simulation and the experimental results, the variations in the power of each configuration at each bus for the simulation models are similar to the results obtained from the experimental works. Additionally, it is revealed from the simulation and experimental studies that the change in the values of power distribution occurs at the hours of the variations in solar irradiance and temperature as well. The obtained results of both the simulation model and Solar charger
3-bus DC microgrid system
Figure8: Experimental setup for the single-source configuration.
Solar charger 1
Solar charger 2
3-bus DC microgrid system
Figure9: Experimental setup for the configuration of multiple sources.
8.5
8
7.5
7
6.5
Irradiance (W/m2) Bus 1
Bus 2 Bus 3
P
o
w
er (W)
200 400 600 800
(a)
10
9
8
7
Irradiance (W/m2)
Bus 1 Bus 2 Bus 3
200 400 600 800
(b)
[image:7.600.138.467.73.216.2] [image:7.600.142.462.443.621.2]hardware based-experiment (see Figures 12–15) indicated that the increase in power losses only occurs in the single-source configuration. It is seen from Figure 13 that the system loss in the configuration of multiple sources is the lowest with efficient power distribution compared to the single-source configuration as shown in Figure 12. Similarly, in Figure 14, the experimental results also show that the single-source configuration has the higher power losses, while the system loss is lower in the multiple-source
[image:8.600.140.461.73.247.2]con-figuration as seen in Figure 15. The increase in system loss is due to the fact that in the single-source configuration, double capacity (100 W) of the power generated from two solar PV panels (each has 50 W) flows through one charge controller. However, in the multiple-source confi gu-ration, the powerflow is shared between two buses and each has a charge controller.
Figure 16 shows the system efficiency with various tem-perature levels and change in solar irradiation for the consid-ered cases in this study. Generally, it is known that the high temperature may increase the loss and thus, decreasing the efficiency of the PV panels. Nevertheless, with the highest generated power from the PV panels at the time when the solar radiation is higher, the operating temperature of the cell can also be at that higher region. Therefore, the outcomes as shown in Figures 16(a) and 16(b) prove this fact and also point out that the efficiency at the top level is achieved when the temperature is low. Another fact is that the remarkable efficiency droop at various periods of time and at different temperature levels was caused by the decrease in solar irradi-ance at the respective times. Likewise, the improvement in the efficiency at the highest level of temperature is due to the increase in solar radiation. Whatever the difference in the results of Figure 16 is, the configuration of multiple sources performs well as this was proven by the simulation and experimental results. It is also found that the system effi -ciency approaches the lower value if the solar irradiance tends to decrease and the temperature goes up, this is directly related to the multiple-source configuration shown in Figure 16(b) particularly at a temperature of 53°C.
The performance of each configuration was also exam-ined with constant levels of solar irradiance and tempera-ture for predicting the power-voltage (P-V) characteristic curves. The simulation results and experimental measure-ments are shown in Figures 17(a) and 17(b). As seen from the single-source curves, there is a linear relationship between the power output and the voltage. The variation of some parameters and the position of the PV panels were found to be the main reason for the change in the power output of the PV panels [32]. As seen from the obtained simulation and experimental results of the multiple-source configuration, the peak power points are reached when the voltage is 16.5 V. Though the power is enhanced by the volt-age increase in the configuration of multiple sources as seen in Figure 17(a), the P-V curves in Figure 17(b) clearly indi-cate that the configuration of multiple sources has less impact on the P-V characteristic. It can be concluded from 8.5
8
7.5
7
6.5
30 40
Temperature (°C)
P
o
w
er (W)
50
Bus 1 Bus 2 Bus 3
(a)
Temperature (°C) 10
9
8
7
30 40
Bus 1 Bus 2 Bus 3
50 60 70
(b)
Figure11: Power absorption at different temperatures for (a) single source and (b) multiple sources.
30
25
20
15
10
5
0 9
Time (hours) Bus 1
Bus 2 Bus 3 System loss
A
cti
ve
p
o
w
er (W)
10 11 12 13 14 15 16
[image:8.600.63.280.286.518.2]the results shown in Figure 17(a) that the multiple-source configuration can bring better voltage retention when the microgrid is subjected to an increase in the load demand, as this may lead to decreasing the nominal voltage in the loaded bus. Alternatively, the results of the P-V curves in Figure 17(c) show that the solar PV output may deviate from the amount of PV module power output at standard test conditions. In this figure, it is observed that when
reswitching the batteries and loads with the variations in the values of solar irradiance and temperature, the maxi-mum points on the P-V characteristic curves are not stabilized.
Further, the effectiveness of the proposed configuration with multiple sources can be observed from the demonstrated results in Tables 1–5. As seen from Table 1, the DC distribu-tion voltage at each bus in the multiple-source configuration shows better voltage profile in different solar radiations and temperatures compared to the results of the single-source configuration as illustrated in Table 2. As seen from the results of the existing configuration, buses 2 and 3 are hav-ing the lowest voltage as the power is not equally balanced in this system. This proves the importance of using the proposed approach.
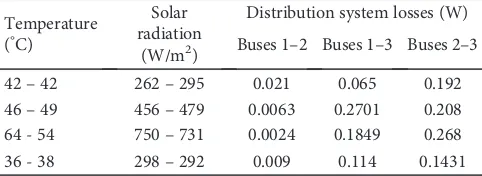
As the main objective of this paper is to improve the sys-tem efficiency by proposing an optimal configuration, the distribution losses are further investigated. As seen from Table 3, the branch losses are notably decreased when using the proposed configuration as compared to the results of the existing approach given in Table 4. The reason for increasing the losses in the single-source configuration, par-ticularly in the lines connecting buses 1 with 3, is that the reduction in the injection of power from the other buses causes a higherflow of power from the solar PV, mostly when heavy loads are connected to the buses. This is another indi-cation that the use of the proposed schematic approach will definitely lead to significant economic benefits as the total loss in the proposed configuration is lower than the existing single-source configuration.
The system efficiency as demonstrated in Table 5 shows how the power is consumed in the system with the similar change of loads in both configurations. These tabulated results clearly showed that when using the proposed approach, the DC microgrid can operate with high efficiency compared with 35
30
25
20
15
10
5
0
9 10 11 12
Time (hours)
A
cti
ve
p
o
w
er (W)
13 14 15 16
Bus 1 Bus 2 Bus 3 System loss
Figure 13: Distributed power in the simulation model of multiple-source configuration.
50
45
40
35
30
25
20
15
10
5
0
9 10 11 12
Time (hours)
A
cti
ve
p
o
w
er (W)
13 14 15 16
Bus 1 Bus 2 Bus 3 System loss
Figure 14: Distributed power in the experimental verification of single-source configuration.
35 40
30
25
20
15
10
5
0
9 10 11 12
Time (hours)
A
cti
ve
p
o
w
er (W)
13 14 15 16
Bus 1 Bus 2 Bus 3 System loss
[image:9.600.322.537.72.305.2] [image:9.600.62.281.74.325.2] [image:9.600.61.281.368.602.2]its operation with the existing single-source configuration. This is another fact from the outcome of Table 5 that the developed framework with the proposed configuration pro-vides huge savings for the DC microgrid owner, especially when the loads are supplied from the energy storage, causing less discharge power from the batteries.
5. Conclusion
A framework has been developed in this paper to investigate the proposed optimum configuration of a ring DC microgrid for the longhouse communities in Sarawak. The selected
con-figurations for evaluation consist of three buses with three 100
95
90
85
80 25 30
Efficienc
y (%)
35 40 45 50
Single source Multiple sources
55 60 65 70 75
(a)
100
90
80
70
60 25 30
Efficienc
y (%)
35 40 45 50
Temperature (°C) Single source
Multiple sources
55 60 65 70 75
(b)
Figure16: Efficiency of the system: (a) simulation and (b) experiment.
40
30
20
10
0
0 5
Votage (V) Single source
Multiple sources
P
o
w
er (W)
10 15 20
(a)
Single source Multiple sources 40
30
20
10
0
0 5
Votage (V)
P
o
w
er (W)
10 15 20
(b)
80
60
40
20
0
0 2 4 6 8 10
Votage (V)
709 W/m2, 31.6°C (PV1 with load) 709 W/m2, 31.6°C (PV2 with load)
582 W/m2, 30.3°C (PV1 with load & battery) 582 W/m2, 30.3°C (PV2 without load & battery)
12 14 16 18 20 22
P
o
w
er (W)
(c)
[image:10.600.57.545.76.201.2] [image:10.600.52.523.97.625.2]loads and two solar PV units connected to different arrange-ments. In this study, each configuration has been critically analyzed with different input variables of solar irradiance and temperature. The concept of DC powerflow was used
to determine the distributed power in each bus and the power loss of the system. Additionally, each configuration has experimentally been validated to assess the optimal perfor-mance of the proposed configuration with multiple sources. The results of the simulation and the experiment have vindi-cated the effectiveness of using the configuration of multiple sources in terms of system reliability and power flow effi -ciency. The significant findings in this paper when using the proposed configuration are that the system efficiency increased from 91% to 98% when the testing temperature of both configurations (proposed and existing) was 26°C. Furthermore, the system loss during the operation with nor-mal load and weather condition has decreased from 23% to 9% when using the proposed configuration. It is also found that when using the proposed configuration, the voltage does not go below 12 V, which means that the nominal voltage can be maintained even if the system is heavily loaded. These noteworthy outcomes clearly indicate the importance of the proposed multiple-source configuration to be implemented for the DC microgrid in the longhouse communities of Sara-wak. It is to be noticed that the internal and external condi-tions of the experiment may affect the performance of each component in the system. Thus, these could be the reason for the slight difference in the simulation results compared to the experimental results. In overall, both results affirm the operational performance of the proposed configuration with multiple sources. Finally, as the scope of this paper does not include the control of DC microgrid, the future studies will focus on developing an approach to intelligently control power sharing in the multiple-source configuration, where the hardware validation will also be considered.
Data Availability
The data used to support thefindings of this study are avail-able from thefirst author upon request.
Conflicts of Interest
The authors declare that they have no conflicts of interest.
Acknowledgments
The authors are grateful to the Universiti Malaysia Sarawak for the financial support under Grant No. F02/SpSTG/1568/2017 and to the Ministry of Higher Edu-cation (Malaysia) for the support in part under Grant No. F02/FRGS/1497/2016. The authors also wish to thank the anonymous reviewers for the suggestions towards improving the quality of this work and its presentation.
References
[1] A. Wadi Abbas Al-Fatlawi, N. A. Rahim, and R. Saidur,
“Researching social acceptability of renewable-energy technol-ogy in Malaysia,”in3rd IET International Conference on Clean
Energy and Technology (CEAT) 2014, Kuching, Malaysia,
2014.
[2] P. Loomba, S. Asgotraa, and R. Podmore,“DC solar micro-grids—a successful technology for rural sustainable Table1: DC distribution voltage of the proposed multiple-source
configuration.
Temperature (°C) Solar radiation (W/m2)
DC bus voltage (V) Bus 1 Bus 2 Bus 3
48–50 600–700 12.74 12.8 12.58
32–34 140–180 12.3 12.33 12.12
26–28 300–400 12.46 12.5 12.28
36–38 100–150 12.31 12.35 12.11
Table 2: DC distribution voltage of the existing single-source configuration.
Temperature (°C) Solar radiation (W/m2)
DC bus voltage (V) Bus 1 Bus 2 Bus 3
48–50 600–700 12.57 12.45 12.28
32–34 140–180 11.97 11.48 11.33
26–28 300–400 12.23 11.4 11.25
36–38 100–150 12.24 11.44 11.29
Table3: Distribution losses of multiple-sources configuration.
Temperature (°C)
Solar radiation
(W/m2)
Distribution system losses (W)
Buses 1–2 Buses 1–3 Buses 2–3
42–42 262–295 0.021 0.065 0.192
46–49 456–479 0.0063 0.2701 0.208
64 - 54 750–731 0.0024 0.1849 0.268
36 - 38 298–292 0.009 0.114 0.1431
Table4: Distribution losses of the single-source configuration.
Temperature (°C)
Solar radiation
(W/m2)
Distribution system losses (W)
Buses 1–2 Buses 1–3 Buses 2–3
42–44 280–350 0.2881 0.3776 0.0048
53–55 450–500 0.1632 0.34 0.0136
54–58 800–900 0.23 0.4816 0.008
48–50 300–400 0.2236 0.3192 0.0014
Table 5: System efficiency of the proposed and existing configurations.
Temperature (°C)
Efficiency of DC microgrid (%) Configuration with
multiple sources
Configuration with single source
56 - 58 77 62
48 - 50 86 64
40 - 42 93 86
35 - 37 95 88
[image:11.600.51.291.221.299.2] [image:11.600.50.291.332.420.2] [image:11.600.51.291.454.541.2] [image:11.600.50.292.584.684.2]development,” in 2016 IEEE PES PowerAfrica, Livingstone, Zambia, June 2016.
[3] J. K. S. Yeo, S. Chen, W. X. Shen, and H. S. Chua,“Energy evaluation and smart microgrid for rural Sarawak,”in2014
IEEE Innovative Smart Grid Technologies - Asia (ISGT ASIA),
Kuala Lumpur, Malaysia, May 2014.
[4] M. Hadi Amini, K. G. Boroojeni, T. Dragicevic, A. Nejadpak, S. S. Iyengar, and F. Blaabjerg,“A comprehensive cloud-based real-time simulation framework for oblivious power routing in clusters of DC microgrids,”in2017 IEEE Second International
Conference on DC Microgrids (ICDCM), Nuremburg, Germany,
June 2017.
[5] M. Nasir, H. A. Khan, A. Hussain, L. Mateen, and N. A. Zaffar,
“Solar PV-based scalable DC microgrid for rural electrification in developing regions,” IEEE Transactions on Sustainable
Energy, vol. 9, no. 1, pp. 390–399, 2018.
[6] M. Obi and R. Bass,“Trends and challenges of grid-connected photovoltaic systems–a review,”Renewable and Sustainable
Energy Reviews, vol. 58, pp. 1082–1094, 2016.
[7] A. Sheikhi, M. Rayati, S. Bahrami, A. M. Ranjbar, and S. Sattari,“A cloud computing framework on demand side management game in smart energy hubs,”International
Jour-nal of Electrical Power & Energy Systems, vol. 64, pp. 1007–
1016, 2015.
[8] J. J. Justo, F. Mwasilu, J. Lee, and J. W. Jung,“AC-microgrids versus DC-microgrids with distributed energy resources: a review,”Renewable and Sustainable Energy Reviews, vol. 24, pp. 387–405, 2013.
[9] M. Kumar, S. N. Singh, and S. C. Srivastava,“Design and con-trol of smart DC microgrid for integration of renewable energy sources,” in 2012 IEEE Power and Energy Society General
Meeting, p. 7, San Diego, CA, USA, July 2012.
[10] P. Achintya Madduri, J. Rosa, S. R. Sanders, E. A. Brewer, and M. Podolsky,“Design and verification of smart and scalable DC microgrids for emerging regions,” in2013 IEEE Energy
Conversion Congress and Exposition, pp. 73–79, September
2013.
[11] K. Shenai and K. Shah,“Smart DC micro-grid for efficient uti-lization of distributed renewable energy,”inIEEE 2011 Energy-Tech, pp. 1–6, May 2011.
[12] C. Strobl, M. Schäfer, and R. Rabenstein,“Non-recursive sys-tem identification and fault detection in LVDC and ELVDC grids,” in 2018 IEEE International Symposium on Circuits
and Systems (ISCAS), May 2018.
[13] S. H. Chew, N. H. Ardiyanto, and K. J. Tseng,“An extra low voltage DC (ELVDC) power distribution for LED lighting
sys-tem,”in2015 IEEE International Telecommunications Energy
Conference (INTELEC), Osaka, Japan.
[14] S. H. Chew, Y. W. E. Chan, N. H. Ardiyanto et al.,“Design considerations for ELVDC power distribution system inte-grated directly with DC energy sources for LED lighting in high-rise built environment,” in2015 IEEE International
Telecommunications Energy Conference (INTELEC), October
2015.
[15] A. Saranya and K. Shanti Swarup,“Sizing of solar DC micro-grid for sustainable off-grid communities: economics, policies and societal implications,”in2016 First International
Confer-ence on Sustainable Green Buildings and Communities (SGBC),
pp. 1–6, Chennai, India, December 2016.
[16] M. A. Redfern,“Smart DC micro-grids,”inProceedings of the 2014 15th International Scientific Conference on Electric Power
Engineering (EPE), pp. 173–178, Brno, Czech Republic, May
2014.
[17] C. Li, S. K. Chaudhary, T. Dragicevic, J. C. Vasquez, and J. M. Guerrero, “Power flow analysis for DC voltage droop con-trolled DC microgrids,” in 2014 IEEE 11th International
Multi-Conference on Systems, Signals & Devices (SSD14),
pp. 1–5, Barcelona, Spain, February 2014.
[18] C. Li, S. K. Chaudhary, M. Savaghebi, J. C. Vasquez, and J. M. Guerrero, “Powerflow analysis for low-voltage AC and DC microgrids considering droop control and virtual impedance,”
IEEE Transactions on Smart Grid, vol. 8, no. 6, pp. 2754–2764,
2017.
[19] R. Farooq, L. Mateen, M. Ahmad, S. Q. Akbar, H. A. Khan, and N. A. Zaffar,“Smart DC microgrids: modeling and powerflow analysis of a DC microgrid for off-grid and weak-grid connected communities,”in2014 IEEE PES Asia-Pacific Power and Energy
Engineering Conference (APPEEC), Hong Kong, China,
Decem-ber 2014.
[20] J. Li, F. Liu, Z. Wang, S. H. Low, and S. Mei, “Optimal power flow in stand-alone DC microgrids,” IEEE
Transac-tions on Power Systems, vol. 33, no. 5, pp. 5496–5506,
2018.
[21] S. Bahrami, V. W. S. Wong, and J. Jatskevich,“Optimal power
flow for AC-DC networks,”in2014 IEEE International
Confer-ence on Smart Grid Communications (SmartGridComm),
pp. 1–6, Venice, Italy, November 2014.
[22] Y. Zheng and X. Wang,“Research on DC micro-grid system of photovoltaic power generation,”IOP Conference Series: Earth
and Environmental Science, vol. 108, p. 052041, 2018.
[23] W. Li, X. Mou, Y. Zhou, and C. Marnay,“On voltage standards for DC home microgrids energized by distributed sources,”in
Proceedings of The 7th International Power Electronics and
Motion Control Conference, pp. 2282–2286, Harbin, China,
June 2012.
[24] A. K. Yadav, A. Ray, and M. M. Lokhande, “Low-voltage DC microgrid network: a case study for standalone system,”
International Journal of Renewable Energy Research, vol. 3,
p. 7, 2017.
[25] S. Anand and B. G. Fernandes,“Optimal voltage level for DC microgrids,”inIECON 2010 - 36th Annual Conference on IEEE
Industrial Electronics Society, Glendale, AZ, USA, November
2010.
[26] G. A. Laudani and P. D. Mitcheson,““Comparison of cost and efficiency of DC versus AC in office buildings”technical report,” Imperial College London, 2014, http://www.topandtail.org.uk/ publications/Report_ComparisonofCost.pdf.
[27] D. Kumar, F. Zare, and A. Ghosh,“DC microgrid technology: system architectures, AC grid interfaces, grounding schemes, power quality, communication networks, applications, and standardizations aspects,” IEEE Access, vol. 5, pp. 12230– 12256, 2017.
[28] S. Rauf and N. Khan,“Application of DC-AC hybrid grid and solar photovoltaic generation with battery storage using smart grid,”International Journal of Photoenergy, vol. 2017, Article ID 6736928, 16 pages, 2017.
[29] A. M. A. Haidar and K. M. Muttaqi,“Effects of PEV penetra-tion on voltage unbalance,” in Plug In Electric Vehicles in
Smart Gridspp. 279–307, Springer, Singapore.
[30] A. M. A. Haidar, A.-K. b. H. Othman, and L. A. C. Lopes,
Conference on Smart Energy Grid Engineering (SEGE), Canada, August 2017.
[31] Universiti Malaysia Sarawak, Faculty of Engineering, Department of Electrical and Electronics, UNIMAS, 2018, https://www.google.com/maps/place/University+of+Malaysia, +Sarawak/@1.4677923,110.4291759,283m/data=!3m1!1e3!4m 5!3m4!1s0x31fba22c831643b5:0x43f8815fe29c879c!8m2!3d1. 464945!4d110.426859.
[32] A. Q. Jakhrani, S. R. Samo, S. A. Kamboh, J. Labadin, and A. R. H. Rigit,“An improved mathematical model for computing power output of solar photovoltaic modules,” International
Journal of Photoenergy, vol. 2014, Article ID 346704, 9 pages,
Tribology
Advances inHindawi
www.hindawi.com Volume 2018
Hindawi
www.hindawi.com Volume 2018 International Journal ofInternational Journal of
Photoenergy
Hindawi
www.hindawi.com Volume 2018 Journal of
Chemistry
Hindawiwww.hindawi.com Volume 2018 Advances in
Physical Chemistry
Hindawi www.hindawi.comAnalytical Methods in Chemistry Journal of
Volume 2018
Bioinorganic Chemistry and Applications Hindawi
www.hindawi.com Volume 2018
Spectroscopy
International Journal of Hindawiwww.hindawi.com Volume 2018 Hindawi Publishing Corporation
http://www.hindawi.com Volume 2013 Hindawi
www.hindawi.com
The Scientific
World Journal
Volume 2018Medicinal ChemistryInternational Journal of Hindawi
www.hindawi.com Volume 2018
Nanotechnology
Hindawiwww.hindawi.com Volume 2018 Journal of
Applied ChemistryJournal of Hindawi
www.hindawi.com Volume 2018
Hindawi
www.hindawi.com Volume 2018 Biochemistry Research International Hindawi
www.hindawi.com Volume 2018
Enzyme
Research
Hindawiwww.hindawi.com Volume 2018 Journal of
Spectroscopy
Analytical ChemistryInternational Journal of
Hindawi
www.hindawi.com Volume 2018
Materials
Journal of Hindawiwww.hindawi.com Volume 2018
Hindawi
www.hindawi.com Volume 2018 BioMed
Research International
Electrochemistry
International Journal of
Hindawi
www.hindawi.com Volume 2018
N
a
no
ma
te
ria
ls
Hindawi
www.hindawi.com Volume 2018 Journal of