i
UTeM Library (Pind.1/2007)
UNIVERSITI TEKNIKAL MALAYSIA MELAKA
BORANG PENGESAHAN STATUS LAPORAN PSM
TAJUK: Measurement Uncertainty Evaluation Computation using Matlab
SESI PENGAJIAN: 2008/2009 Semester 2
Saya Leow Shell Fang
mengaku membenarkan laporan PSM ini disimpan di Perpustakaan Universiti Teknikal Malaysia Melaka (UTeM) dengan syarat-syarat kegunaan seperti berikut:
1. Laporan PSM adalah hak milik Universiti Teknikal Malaysia Melaka dan penulis. 2. Perpustakaan Universiti Teknikal Malaysia Melaka dibenarkan membuat salinan
untuk tujuan pengajian sahaja dengan izin penulis.
3. Perpustakaan dibenarkan membuat salinan laporan PSM / tesis ini sebagai bahan
pertukaran antara institusi pengajian tinggi.
4. *Sila tandakan (√)
SULIT
TERHAD
TIDAK TERHAD
(Mengandungi maklumat yang berdarjah keselamatan atau kepentingan Malaysia yang termaktub di dalam AKTA RAHSIA RASMI 1972)
(Mengandungi maklumat TERHAD yang telah ditentukan oleh organisasi/badan di mana penyelidikan dijalankan)
(TANDATANGAN PENULIS)
Alamat Tetap: No. 165, Lorong 22, Taman Sri Tanjung, 08000 Sungai Petani, Kedah.
Tarikh: 10th April 2009
(TANDATANGAN PENYELIA)
Cop Rasmi:
Tarikh: _______________________
* Jika laporan PSM ini SULIT atau TERHAD, sila lampirkan surat daripada pihak organisasi berkenaan dengan menyatakan sekali sebab dan tempoh tesis ini perlu dikelaskan sebagai SULIT atau TERHAD.
ii
DECLARATION
I hereby declare that this report entitled “Measurement Uncertainty Evaluation Computation using Matlab” is the result of my own research except as cited in the
references.
Signature : ……….
Author’s Name : Leow Shell Fang
iii
APPROVAL
This report is submitted to the Faculty of Manufacturing Engineering of UTeM as a partial fulfillment of the requirements for the degree of Bachelor of Manufacturing Engineering (Manufacturing Process) with honours. The members of the supervisory committee are as follow:
iv
ABSTRACT
v
ABSTRAK
vi
DEDICATION
vii
ACKNOWLEDGEMENTS
I want to first to acknowledge with special thanks and appreciation to my supervisor, Dr. Mohd Rizal bin Salleh for all the guidance and critics given to me during my project duration. His advice, contributions and comments has given me great help in order to complete my project successfully. Besides that, he also always sacrifice his time to teach and explain to me without a word of complain. He is willing to help me all the time. He really gave me a lot of useful information so that I can do my study smoothly. His opinions and guidelines has assist me to solve all my problem faced when the project is being carried out.
Next, I would like to deliver special thanks to my lovely family. Without my family support, I could not complete the project on time. They really help me a lot when I am facing difficulty in the project. Their advices may not useful in my project but they have give to me the strength to continue and complete the task successfully.
viii
TABLE OF CONTENTS
Declaration ii
Approval iii
Abstract iv
Abstrak v
Dedication vi
Acknowledgement vii
Table of Content viii
List of Tables xii
List of Figures xiii
List of Abbreviations xv
1. INTRODUCTION 1
1.1 Introduction 1
1.2 Problem Statement 3
1.3 Objective 4
1.4 Scope of Study 4
2. LITERATURES REVIEW 5
2.1 Introduction 5
2.1.1 Error 6
2.1.2 Types of Error 7
2.1.2.1 Random Error 7
2.1.2.2 Systematic Error 8
2.1.2.3 Relative Error 9
2.1.3 Accuracy 10
2.2 Uncertainty 10
2.2.1 Uncertainty in Measurement 11
ix
2.2.2.1 Type A 13
2.2.2.2 Type B 13
2.2.3 Component of Uncertainty 14
2.2.3.1 Standard Uncertainty 14
2.2.3.2 Combined Standard Uncertainties 14
2.2.3.3 Expanded Uncertainty 15
2.2.4 Sources of Uncertainty 15
2.2.5 Measuring Uncertainties 16
2.2.6 Evaluation of Uncertainties 17
2.2.7 Effect of Uncertainty 18
2.3 Calculating and Expressing Uncertainty in Measurement 19
2.3.1 Evaluating Uncertainty 20
2.3.2 Type A evaluation of Uncertainty 21
2.3.3 Type B evaluation of Uncertainty 23
2.3.4 Combined Standard Uncertainty 24
2.3.5 Expanded Uncertainty 24
2.4 Uncertainty Report 25
2.5 Guide to the Expression of Uncertainty in Measurement (GUM) 26 2.6 Uncertainty Analysis of Calibration of Geometrical Gauges 27
2.6.1 Example of Measurement of Gauge Blocks 28
2.7 Guidelines for Expressing the Uncertainty of Measurement Results containing Uncorrected Bias
29
2.7.1 Recommendations for Measurements Involving Uncorrected Bias 30
3. METHODOLOGY 31
3.1 Methodology of Project 31
3.2 Humidity / Temperature Meter (Data Logger) 33
3.3 Calibration of Gauge Block 33
3.4 Measurement using Micrometer 34
3.4.1 How to read a Metric Micrometer 35
x
3.6 Uncertainty Calculation 36
3.7 The Uncertainty Estimation Process 36
3.7.1 Specification of the Measurand 36
3.7.2 Identifying Uncertainty Sources 37
3.7.3 Quantifying Uncertainty 37
3.7.4 Calculating Combined Uncertainty 37
3.8 Matlab 38
3.8.1 Analyzing and Accessing Data 38
3.8.2 Visualizing Data 38
3.8.3 Performing Numeric Computation 39
4. RESULT 40
4.1 Gauge Block 40
4.1.1 Error and Uncertainty 40
4.1.2 Standard Deviation 43
4.2 Temperature 44
4.2.1 Error and Uncertainty 45
4.2.2 Standard Deviation 48
4.3 Humidity 49
4.3.1 Error and Uncertainty 49
4.3.2 Standard Deviation 52
4.4 Matlab Coding 53
4.5 Comparison of measurement of gauge block, temperature and humidity 58
4.5.1 Gauge Block of size 5mm 58
4.5.2 Gauge Block of size 10mm 59
4.5.3 Gauge Block of size 20mm 61
5. DISCUSSION
5.1 Temperature and humidity as the sources of uncertainty 63
xi
6.1 Conclusion 67
6.2 Recommendation 68
REFERENCES 69
APPENDICES
A Gantt Chart for PSM I B Gantt Chart for PSM II
xii
LIST OF TABLES
2.1 Values of diameter of a cylinder 22
xiii
LIST OF FIGURES
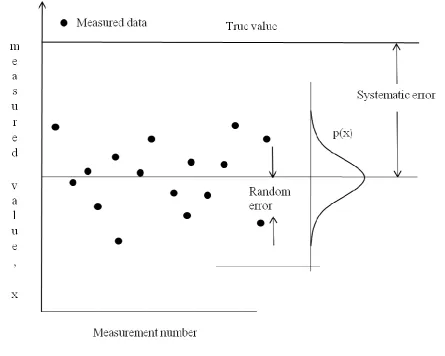
2.1 Distribution of errors upon repeated measurements 6
2.2 Random error 8
2.3 Systematic error 9
2.4 A set of gauge block that is used for scale factor compensation 29
3.1 Flow chart of methodology 32
3.2 Humidity / Temperature Meter (Data Logger) 33
3.3 Micrometer 34
4.1 Graph of the uncertainty of 5mm gauge block 41
4.2 Graph of the uncertainty of 10mm gauge block 42
4.3 Graph of the uncertainty of 20mm gauge block 43
4.4 Graph of standard deviation versus gauge block size 44 4.5 Graph of the uncertainty in temperature when measuring 46
5mm gauge block
4.6 Graph of the uncertainty in temperature when measuring 46 10mm gauge block
4.7 Graph of the uncertainty in temperature when measuring 47 20mm gauge block
4.8 Graph of standard deviation versus temperature 48 4.9 Graph of uncertainty in humidity for measurement 50
5mm gauge block
4.10 Graph of uncertainty in humidity for measurement 50 10mm gauge block
4.11 Graph of uncertainty in humidity for measurement 51 20mm gauge block
xiv
4.13a Uncertainty of gauge block of size 5mm 58
4.13b Uncertainty in temperature for 5mm gauge block 58 4.13c Uncertainty in humidity for measurement of 5mm gauge block 59
4.14a Uncertainty of gauge block of size 10mm 60
4.14b Uncertainty in temperature for 10mm gauge block 60 4.14c Uncertainty in humidity for measurement of gauge block 20mm 60
4.15a Uncertainty of gauge block sized 20mm 61
xv
LIST OF ABBREVIATIONS
BMP - Bitmap
CMM - Coordinate Measuring Machine GIF - Graphics Interchange Format
GUM - Guide to the Expression of Uncertainty in Measurement ISO - International Organization for Standardization
JPEG - Joint Photographic Experts Group MATLAB - Matrix Laboratory
n - Sample size
NPL - National Physical Laboratory
RH - Relative humidity
SD - Standard deviation
SEM - Standard error of the mean
SI - International System
U - Expanded uncertainty
QC - Quality Control
1
CHAPTER 1
INTRODUCTION
This chapter focuses on the introduction about the topic of the project, its problem statement, objectives to be achieved and also the scope of study. The project title also had been briefly explained.
1.1 Introduction
Even the most carefully designed and executed experiments instruments which are performed in temperature and humidity controlled environments, yield values that are influenced by various sources of error. A key responsibility of an experimenter is to attempt to identify sources of error that may affect the measurement process and then quantify the likely extent of those errors. Random errors cause measured values to lie above and below the true value. Due to the scatter created by the values, it is usually easy to recognize. So long as only random errors exist, the best estimate of the true value, which is often taken to be the mean of many measured values, tends towards the true value as the number of repeat measurements increases. Another type of error is that which causes the measured values to be consistently above or consistently below the true value, this is termed a systematic error. (Les Kirkup, 2007).
2
measurement is defined as the parameter which associated with a result of a measurement that characterizes the dispersion of the values that could be reasonably attributed to the measured value (Kallner, 2006). In other words, uncertainty of measurement is the doubt which exists in the result of any measurement. Uncertainty is a quantification of the doubt about the measurement result. It is different with error whereas error means the difference between the measured value and the ‗true value‘ of the thing being measured. Uncertainty measurement is significant when we hope to make good quality measurements and to understand the results. Besides that, it also plays an important role in calibration, test and tolerance.
To encourage uniformity in the way uncertainty in measurement is expressed, ISO prepared and published the document ‗Guide to the Expression of Uncertainty in Measurement‘ (GUM) in 1993. The work, which culminated in GUM, was begun in the late 1970‘s and drew together experts in metrology from around the world. As a starting point, an ISO working group was given the following terms of reference. Though the terms of reference appear to focus upon services and facilities provided to the scientific, engineering and other communities by standards and calibration laboratories, GUM also anticipates the general rules it conveys to be applicable to a broad range of measurements carried out in science and engineering. A broad aim of the GUM document is to encourage those involved with measurement to supply full details on how uncertainties are calculated, permitting the comparison of values
obtained through measurement by workers around the world. (Les Kirkup, 2007).
3
have detailed knowledge about the procedure of measurement to allow identification and quantification of all reasonable sources. All of these uncertainty factors must be evaluated and brought into the uncertainty budget (Kallner, 2006).
There are two types of estimation of the uncertainty in measurement, that are Type A and Type B. For Type A, the estimation is based on the standard deviations derived from repeated measurements. As a result, the standard deviation and the standard uncertainty will have the same size. Sometimes in complex measurement procedures, it is not able to estimate the variation from repeated experiments. Hence, the professional experience, information in the literature or specifications from a manufacturer will usually allow the demarcation of an interval within which a result can reasonably be expected (Kallner, 2006). This is what had been done in the Type B evaluation of uncertainty.
1.2 Problem Statement
4
1.3 Aim & Objectives
The aim of this project is to reduce the errors and uncertainty of measurements which occur when the measurement data is being taken. As the uncertainty of measurement will affect the quality of a particular measurement, so it is a must to minimize it so that the quality control of measurement can be maintained. The objectives including:
Identify the parameters of error and uncertainty
Establish a computing program for uncertainty analysis
Analyze the impact of parameters on the error and uncertainty of gauge block measurement procedure
1.4 Scope of Study
5
CHAPTER 2
LITERATURE REVIEW
The content of this chapter will generally focus on literature review related to the error and uncertainty. The difference between error and uncertainty is stated; the details explanation also included. In this chapter, the information about uncertainty is being focused. There are such as the categories of uncertainty, component of uncertainty, the sources of uncertainty and the effect of uncertainty. This chapter also consists of the equations used in calculating uncertainty.
2.1 Introduction
6 2.1.1 Error
Error is the difference or discrepancy between the result of the measurement and the actual value of the measurement; in other words, it can be said that it is a mistake. By the way, error also can be explained as the difference between the measured value and the ‗true value‘ of a particular thing being measured. However, the magnitude of this error will never be known exactly.
[image:22.595.106.552.270.626.2]___________________
7 2.1.2 Types of Error
There is no measurement or test is perfect and the imperfections give rise to error of measurement in the result (Leon Jay Gleser, 1998). Error of measurement may have two components. There are random component and systematic component. It can be said that uncertainty arises from random effects and also from imperfect correction for systematic effects (Clarke et al., 2008). These errors may affect a measurement result.
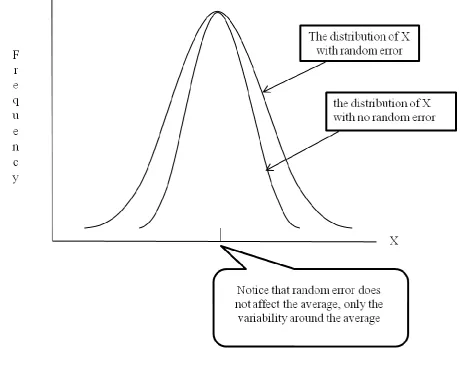
2.1.2.1 Random Error
8
Figure 2.2: Random Error
2.1.2.2 Systematic Error