Magnetic Field Effects and
Biophysical Studies on DNA
Charge Transport and Repair
Thesis by
Theodore Joseph Zwang
In Partial Fulfilment of the Requirements for the
Degree of Doctor of Philosophy in Chemistry
California Institute of Technology
Pasadena, California
2018
© 2018
Theodore J. Zwang
Acknowledgements
I am forever indebted to my advisor, Jackie Barton, for guiding me through the gauntlet that is graduate school. I would never have reached this point if not for the attentive help you gave me. You always keep your door open to me and other students in the lab, despite the incredible number of responsibilities that you manage. It truly shows how much you care about our success. Your example serves as a constant reminder that it is important to make myself available to help those around me no matter how busy life gets. You are one of the most impressive people that I have ever met, and a true role model for the kind of scientist that I wish to be.
Thanks also goes to my thesis committee: Professors Doug Rees, Harry Gray, and Tom Miller. I appreciate the positivity and friendliness that you have all shown me, as well as the genuine interest you have taken in my growth as a scientist. The advice you’ve given me, both about science and being a scientist, has helped me grow into the capable person that I am today. I’m sure that I will look back on our conversations as a source of inspiration in my future career.
Michael Hill, the time you spent with me while working through my initial spin experiments is invaluable. You taught me more than just rigorous electrochemistry. You taught me to have true appreciation for rigorous science. You are a genuinely good person and someone that I look forward to seeing at conferences in the future.
exciting research can be. I owe you my gratitude for putting me on this path. I can’t imagine myself this happy doing anything else.
I am thankful to past members of the Barton group who taught me many things. Natalie Muren helped me through some difficulty adjusting to graduate school, and really made me feel like a member of the lab. Other members, including Eric Olmon, Anna Arnold, and Pam Sontz, were positive role models whose discussions helped me learn far better than anything I read. Katie Schaefer was a good source of positivity and a real pleasure to be around. And I must thank Mike Groddick for being a good friend to me, as well as a brilliant colleague who was a pleasure to work with.
colleagues to work with and talk science with. I’m excited to see where your research goes. Adam Boynton, you have always been such a source of positivity. I appreciate all your help with safety and synthesis. Levi Ekanger, you have been a great addition to the lab. You’re such a friendly and helpful person, and I can say that you’ve made my experiments exponentially easier with all you’ve done fixing up the glove bag. Yingxin Deng, you have been a great help making electrode substrates. I’m really excited to see where you take them! Adela Nano, you have been a fantastic colleague to work with. I appreciate the advice you’ve given me when I’m trying to troubleshoot syntheses.
I would also like to thank the administrative assistants, Mo Renta and Elisha Okawa, who have helped keep the lab running. Elisha has been a great addition to the lab and is one of the friendliest, most helpful people that I’ve ever worked with. I would also like to thank all of the staff in the chemistry department for the many services they keep running. Much of what you do has made my life easier and my time at Caltech more pleasant.
Finally, I would like to thank my family for their extraordinary support through all of my education. Thank you, mom and dad, for raising me with the curiosity and creativity that I have now. Thank you, Arielle, for being a great sister that I can always talk to about anything. I feel lucky for having you in my life. Thank you all for
Abstract
DNA-mediated charge transport (DNA CT) is well established in both ground and excited state systems. Although theoretical models are still being developed, it is clear
that the integrity of the extended π-stack of the aromatic heterocycles, the nucleic acid
bases, plays a critical role. Electron donors and acceptors must be electronically well
coupled into the π-stack, typically via intercalation. Perturbations that distort the π-stack,
such as single-base mismatches, abasic sites, base lesions, and protein binding that kinks the double helix, attenuate DNA CT dramatically.
This thesis encompasses work that first aims to understand how DNA duplex structure informs characteristics of DNA CT and then continues to develop an understanding of the role these structural features play in biological systems. To
contextualize these advancements, this first chapter outlines foundational work that has shown ways that DNA structure influences its ability to conduct charge.
This exquisite spin selectivity begged the question: how might biology take advantage of such a spin filter? Photolyase and cryptochromes both have been shown to exhibit magnetosensitive chemistry nearby a DNA binding pocket, and photolyase had previously been shown capable of DNA CT. Thus, electrochemical studies were conducted to monitor the repair of cyclobutane pyrimidine dimer lesions by E coli
photolyase and truncated A Thaliana Cryptochrome 1 with an applied magnetic field. We find that the yield of dimer repair is dependent on the strength and angle of the applied magnetic field even when using magnetic fields weaker than 1 Gauss, though spin selective DNA CT is not involved. These data illustrate how cyclobutane dimer repair could be used in a biological compass that is informed by the angles of Earth’s magnetic field.
Next DNA-mediated electrochemistry and atomic force microscopy studies were used to describe a role for redox active 4Fe-4S clusters in DNA-mediated charge
transport signaling. DNA-modified electrochemistry shows that the 4Fe-4S cluster of DNA-bound DinG, an ATP-dependent helicase that repairs R-loops, is redox-active at cellular potentials and ATP hydrolysis increases DNA-mediated redox signaling. Atomic force microscopy experiments demonstrate that DinG and Endonuclease III, a base excision repair enzyme, cooperate at long range using DNA charge transport to redistribute to regions of DNA damage. These data are then described using an
The importance of the oxidation state of the redox-active [4Fe4S] cluster in the DNA damage detection process is then further explored using a mixture of
electrochemistry and atomic force microscopy. DNA-modified electrodes were utilized to generate repair proteins with [4Fe4S] clusters in the 2+ and 3+ states by bulk electrolysis under an O2-free atmosphere. Anaerobic microscale thermophoresis results indicate that
proteins carrying [4Fe4S]3+ clusters bind to DNA 550 times more tightly than those with [4Fe4S]2+ clusters. The measured increase in DNA-binding affinity matches the
Published Content and Contributions
Grodick, M.A.; Segal, H.M.; Zwang, T.J.; and Barton, J.K. J. Am. Chem. Soc.2014, 136
(17), 6470-6478
DOI: 10.1021/ja501973c
T.J. Zwang performed atomic force microscopy experiments, modeling, and analysis.
Zwang, T.J., Hurlimann, S., Hill, M.G., and Barton, J.K. J. Am. Chem. Soc., 2016, 138
(48), 15551-15554
DOI: 10.1021/jacs.6b10538
Table of Contents
Chapter 1. The Importance of DNA Structure for Charge Transport ...
1
Complexities of DNA structure ...2
Measurements of DNA-mediated charge transport ...5
Structural features essential for DNA-mediated charge transport ...7
The DNA environment can change the duplex structure ...10
Verification of DNA-mediated charge transport ...12
Summary ...15
References ...16
Chapter 2. Helix-Dependent Spin Filtering through the DNA Duplex ...
20
Introduction ...21
Materials and methods ...23
Results ...37
Summary and conclusions ...51
References ...51
Chapter 3. A Compass at weak Magnetic Fields using Thymine
Dimer Repair by Photolyase ...
55
Introduction ...56
Materials and methods ...57
Results and discussion ...66
References ...88
Chapter 4. DNA-mediated signaling by proteins with 4Fe-4S
clusters studied by electrochemistry and atomic force microscopy ...
90
Introduction ...91
Materials and methods ...93
Results ...103
Discussion ...124
Chapter 5. Redox-active [4Fe4S] Clusters Modulate the
DNA-Binding Affinity of DNA Repair Proteins ...
133
Introduction ...134
Materials and methods ...137
Results ...141
Discussion ...173
References ...177
List of Figures
Chapter 1
1.1 Platforms for the study of DNA CT ...6 1.2 Illustration of A-, B-, and Z-form DNA duplexes tethered to electrode surfaces. ..8 1.3 Electrochemistry of a 100 base pair duplex with and without a single
base mismatch ...13
Chapter 2
2.1 Circular dichroism spectra of d(CG)8 DNA ... 35
2.2 Cyclic voltammetry of electrodes modified with 16 bp dsDNA ...38 2.3 Representative cyclic voltammetry data for various assemblies of
DNA-modified electrodes ...40 2.4 Plot of the magnetic field effect observed for DNA with covalently tethered
Nile blue at different lengths ...41 2.5 Scan Rate dependence of covalently tethered Nile blue reduction through
duplex DNA ...42 2.6 Cyclic voltammetry of 29bp dsDNA with covalently tethered dabcyl and
noncovalently intercalated MB ... 45 2.7. Summary of cyclic voltammetry data for 17bp duplex DNA with a C:A
mismatch 6 nucleotides from the surface ...46 2.8 Switching of methylated and unmethylated dsDNA measured on a single
multiplexed chip ...48
Chapter 3
3.1 Typical photoreduction measurement of WT photolyase ...63 3.2 Cyclic voltammetry of photolyase on multiplexed chip electrodes ...68 3.3 Integrated cyclic voltammetry measurements of photolyase over time ...69 3.4 Cyclic voltammetry of photolyase before and after the addition of
competitor DNA ...71 3.5 Measurement of multiplexed chip sample using SQUID magnetometer ...72 3.6 Cyclic voltammetry of photolyase electrode under different
magnetic field conditions ...73 3.7 Total amount of charge transferred over time with varying magnetic field
strengths and angles ...76
3.9 Cyclic voltammetry of photolyase opposite direction magnetic fields ...77
3.10 Radical repair scheme for cyclobutane pyrimidine dimers ...79
3.11 Effect of structural perturbations on magnetosensitivity of photolyase ...80
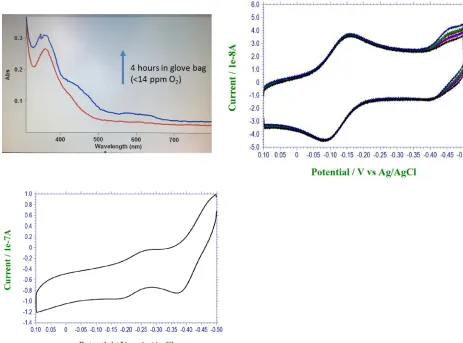
3.12 Ultraviolet/visible wavelength spectra and cyclic voltammetry of photolyase upon oxidation. ...81
3.13 High pressure liquid chromatography traces of duplex DNA eluted at high temperature ...85
3.14 Cyclic voltammetry of cryptochrome incubated on a duplexDNA-modified electrode ...86
3.15 Cyclic voltammetry of cryptochrome over time with different magnetic field angles. ...87
Chapter 4
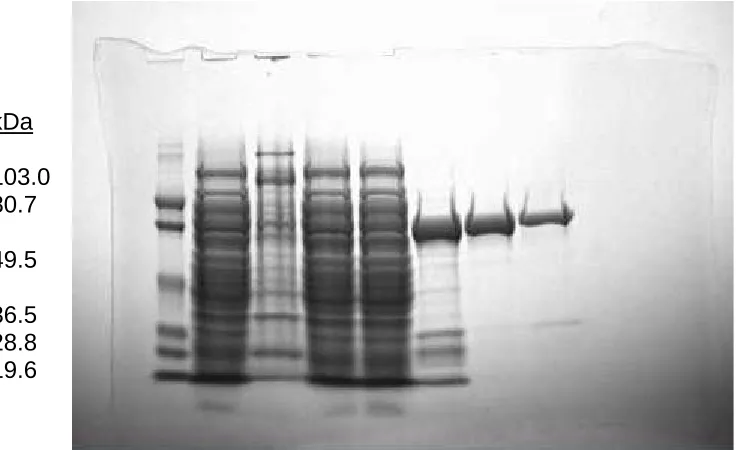
4.1 SDS-PAGE gel for purification of DinG ...964.2 Statistical data for the AFM experiments ...102
4.3 Electrochemistry of DinG on DNA-modified electrodes ...104
4.4 AFM redistribution assay ...107
4.5 Occupancy of DinG on long strands of DNA ...110
4.6 Occupancy of either EndoIII and DinG on long strands of well-matched DNA ...111
4.7 Macrostates that are observable by atomic force microscopy ...114
4.8 Representation of different redox microstates that are bound to a DNA duplex ...115
4.9. The population of plasmid DNA with a given number of bound proteins ...117
4.10 Plots of the effective affinity for two proteins bound to DNA under simulated conditions ...122
4.11 Plots of the effective affinity for two proteins bound to DNA under simulated conditions with varying proportion of oxidized protein ...123
Chapter 5
5.1 Electrochemistry of EndoIII on DNA-modified electrodes ...148
5.2 Cyclic voltammetry of EndoIII on a duplex DNA modified electrode ...149
5.3 Square wave voltammetry and differential pulse voltammetry of EndoIII on a dsDNA modified electrode ...150
5.4 UV-visible absorbance spectra of EndoIII ...151
5.5. The influence of bulk electrolysis on EndoIII structure as monitored by circular dichroism ...152
5.6. Cyclic voltammetry of EndoIII on a dsDNA modified electrode with varying scan rates ...153
5.7. Randles-Sevcik plots of the peak currents of EndoIII ...154
5.8 Continuous wave electron paramagnetic resonance spectra of EndoIII ...156
5.9 AFM visualization of EndoIII binding to DNA ...157
5.10 MST traces of native and oxidized EndoIII ...161
5.11 Model describing the electrostatic interactions between EndoIII and DNA ...163
5.12 AFM redistribution assay of EndoIII samples oxidized to various extent ...166
5.13 Cyclic voltammetry of DinG incubated with a dsDNA modified gold electrode ...168
5.14 Squarewave and differential pulse voltammetry of DinG incubated on a duplex DNA modified gold electrode ...169
5.15 Cyclic voltammetry of DinG incubated with a dsDNA modified gold electrode at different scan rates ...170
5.16 Randles-Sevcik plots of DinG electrochemistry ...171
List of Tables
Chapter 1
1.1 Duplex structure types and helical parameters of DNA observed by X-ray
diffraction ...4
Chapter 2
2.1 Summary of all spin polarization data ... 49
Chapter 4
4.1 Oligonucleotides for electrochemistry substrates, gene replacements,
sequencing or colony PCR, and site-directed mutagenesis ...97 4.2 Plasmids used in this study ...98
Chapter 5
5.1 Binding affinity measurements of EndoIII to 21-mer dsDNA in the reduced and oxidized forms using MST, ITC, and EMSA ...158 5.2 Number of DNA and proteins counted in the AFM redistribution assay using
Chapter 1
The Importance of DNA Structure
Introduction
DNA-mediated charge transport (CT) is fascinating chemistry that relies on the π
-stacked structure present in some DNA conformations. Under the right conditions DNA CT can occur over extraordinarily long distances with shallow distance dependence. Many characteristics of DNA CT are strongly dependent on the structure and dynamics of the DNA that is used as well as the assembly that is used to initiate and measure DNA CT. Understanding the role that all of these components play is essential to developing DNA CT for use in nanoelectronics or characterizing DNA CT’s role in biological systems.
This thesis encompasses work that first aims to understand how DNA duplex structure informs characteristics of DNA CT and then continues to develop an understanding of the role these structural features play in biological systems. To
contextualize these advancements, this first chapter outlines foundational work that has shown ways that DNA structure influences its ability to conduct charge. Specific focus is given to macromolecular structure and its associated characteristics that can vary with sequence or by exposing DNA to different environments. Additionally, the local
structural changes, including those induced by mismatches, abasic sites, and lesions, are discussed.
Complexities of DNA Structure
a phosphate. The sugar, deoxyribose (or ribose in RNA), is cyclic and connected via a β -glycosyl linkage to a heterocyclic base. Though many natural and unnatural
modifications are possible, typical DNA will have access to four different bases: adenine, guanine, cytosine, and thymine. Either the 3’- or 5’- hydroxyl group of the sugar is phosphorylated, which can then form phosphodiester bonds to link with adjacent nucleotides to become an oligonucleotide. (1)
In most of the known oligonucleotide crystal structures two complementary strands are observed associating in double-helical arrangements termed DNA duplexes. In a well-matched duplex complementary bases, one from each strand, hydrogen bond with one another to form adenine-thymine (AT) or guanine-cytosine (GC) pairs.
Perpendicular to each pairing are adjacent nucleotides whose heterocycles’ π-orbitals
overlap, creating a path for charge to transport down the helical axis.
Sometimes oligonucleotides can crystallize with other conformations; nonhelical entities are observed with looped configurations. (1) The different crystal structures indicate the conformational flexibility that is afforded to DNA which, despite being most often considered as a B-form, right-handed helix, allows for many relevant
Table 1.1. Duplex structure types and helical parameters of DNA observed by X-ray diffraction. Partially adapted from (1).
Structure Type Pitch (Å) Helical Symmetry* Axial rise per nucleotide (Å) Axial turn angle per nucleotide (degrees) Minor groove width (Å) Major groove width (Å) Minor groove depth (Å) Major groove depth (Å) A 28.2 11 2.56 32.7 11.0 2.7 2.8 13.5
B 33.8 10 3.38 36.0 5.7 11.7 7.5 8.5
C 31 9.33 3.32 38.6 4.8 10.5 7.9 7.5
D 24.3 8 3.04 45 1.3 8.9 6.7 5.8
Measurements of DNA-mediated charge transport
There are many different techniques that have been used to measure DNA-mediated charge transport. The majority of experiments testing DNA CT have been performed in solution and tend to involve a photoexcited charge donor that transfers charge to an acceptor through a DNA bridge. (7) A wide variety of donors and acceptors have been used, ranging from transition metal complexes to purely organic molecules, base analogs, and proteins. (8, 9, 10) Experiments have been conducted on electrodes, typically gold or graphite, that are covered by a self-assembled monolayer of DNA. (11,12) DNA duplexes are linked to the surface by a covalent modification on the phosphate backbone (thiols for gold or pyrene for graphite) that allows for them to stand upright. Redox molecules, either noncovalently or covalently attached to the DNA, can then be reduced or oxidized by applying a potential across the electrode surface. (13)
Structural features essential for DNA-mediated charge transport
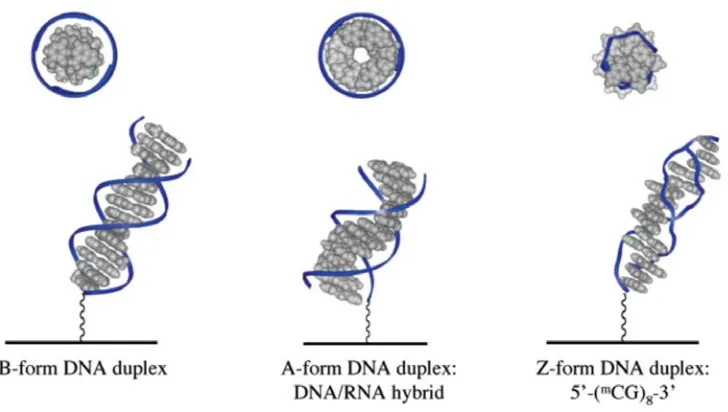
The ability for DNA to mediate charge transport correlates with the extent of base stacking. The different base pair stacking of A-, B-, and Z-form DNA leads to different conductivities through these structures. (17) These duplex polymorphisms are illustrated in figure 1.2. The A-form duplex has the largest overlap of adjacent bases as well as the most efficient DNA CT. The B-form follows next, with the second best overlap. The Z-form is a significantly worse charge transport path than either of these, and also has the worst π-stacking of typical duplex structures. And single stranded DNA, if present in an unstacked conformation which does not have an ordered π-stacked structure, does not facilitate efficient charge transport. This has been confirmed with electrochemical, photooxidation, and direct conductivity studies. (16,17,18)
The sequence of DNA can have a significant role in the macromolecular structure that is being tested. The complementary pairings of (dA-dT)n with (dA-dT)n and
(dG-dC)n with (dG-dC)n have the same purine-pyrimidine alternating sequence but they have
access to different polymorphisms, with only the (dG-dC)n able to transition from B-form
to Z-form under high salt conditions. (5,6) Even DNA with the same nucleotide composition in a different order can lead to significant changes in the accessible
structures. Aqueous solutions of (dG)n with annealed with (dC)n results in A-form duplex
but annealing (dG-dC)n with (dG-dC)n result in a B-form duplex. (20,21) Careful
consideration of the annealing process should be taken when annealing different
Figure 1.2. Illustration of A-, B-, and Z-form DNA duplexes tethered to electrode surfaces. Also shown are views looking directly towards the helical axis. Note the
significantly different organization of nucleotides, which changes the overlap of π
the favorability of non-duplex structures such as hairpins. To minimize structural differences caused by annealing, and to maximize the formation of duplex DNA,
complementary DNA strands should be heated to well above the expected duplex melting temperature and then decreased slowly to a temperature where the duplex form is stable and other structures are not.
Disruption of the π-stacking will diminish the efficiency of DNA CT through that
region. The presence of mismatches lowers the rate and yield of DNA CT in a way that correlates with base pair lifetime. (22) This disruption occurs even though mismatched base pairs do not cause major structural changes. (23) Abasic sites and destabilizing lesions, such as 8-oxoguanine, diminish DNA CT. (24,25) Significant kinks to DNA caused by protein binding, such as the TATA-binding protein, or chemical interactions with molecules such as cisplatin, will also disrupt DNA CT. (26,27)
Not all modifications to DNA structure diminish DNA CT. A dephosphorylation of the backbone does not have a measurable effect on yield or efficiency. (28,29). Some mismatches, such as G containing mismatches that are fairly stable, do not have a significant effect on DNA CT. (25) Some changes in structure, such as methylation to generate 5-methylcytosine, do not significantly influence DNA CT. (25)
The importance of the π-orbitals’ overlap is also essential for charge to move to
backbone and are unable to access DNA-mediated charge transport. (31) In some cases, like with methylene blue, different DNA binding modes are available. At low
concentrations methylene blue primarily intercalates into DNA where it can undergo efficient DNA CT, but at higher concentrations it can bind electrostatically where it cannot utilize DNA CT. (30) Screening these electrostatic interactions with increased salt concentrations will promote primarily intercalative binding.
The DNA environment can change the duplex structure
DNA’s access to different conformations can be taken advantage of by
experiments, but unknown conformational changes can also confound the interpretation of results. The ability for DNA to change between conformations with different charge transport properties makes structural confirmation of duplexes essential for comparisons to be made between measurements of DNA CT in different systems. Various
measurements have been performed since the discovery that DNA conducted charge that have shown all sorts of conflicting properties. (32) In some cases, DNA is said to be insulating or nonconductive and in others it is said to be superconductive. DNA
conductivity is reported to be dependent on the sequence, hydration, length, temperature, and hybridization in some experiments but not in others. These differences can be largely reconciled by assessing the preparation of samples and methodology used, because small changes in DNA’s handling can enhance, eliminate, or disrupt the internal π-stacked structure and have dramatic effects on its ability to conduct charge. (32)
interactions; changing these interactions can significantly change the resulting structure. (1) The precise structural changes caused by dehydration or exposure to most nonaqueous solvents are not very well characterized, but it is clear that the equilibrium conformation of DNA is changed. (1,32,33) Many solvents that dissolve DNA do not retain the duplex structure and it is not clear that returning to an aqueous environment restores the duplex. (34) For example, drying duplex DNA then redissolving it in aqueous solution results in the generation of single stranded hairpin structures and other changes. (35) The influence of hydration is so important that changing the humidity of DNA can also significantly change the structure of DNA with the same sequence. Poly(dA-dT) duplexes exist exclusively in the B form above 70% relative humidity, but at lower humidity transform into a metastable A form which disproportionates into a triple-stranded complex with A-type conformation. (36) These data show that the dehydration or exposure to nonaqueous solvents can eliminate the π-stacked duplex structure, which is why they impede efficient DNA CT, but in most cases it is unclear what the structure of DNA actually is after exposure to nonaqueous conditions.
has also been reported with careful consideration of the influence this environment has on the duplex structure. (40) In these extreme conditions the structure of DNA is unclear so it is difficult to make claims regarding DNA-mediated charge transport that are clearly deconvolved from other aspects of the experiment. For example, ionic conduction through water may be what is measured instead of DNA-mediated CT. (32,41,32) So, to properly understand the structure that is being tested it is essential to keep DNA hydrated during all steps of preparation and experiment, characterize the DNA after procedures that may change the structure, and verify that the charge transport is DNA-mediated.
Verification of DNA-mediated charge transport
There are many different ways to verify that charge transport is DNA-mediated. Ideally, controls will disrupt DNA CT in a way that is recoverable or in a way that minimizes other differences in the experiment. The significant influence that small
structural changes have on the yield of DNA CT allows for the design of experiments that can verify charge transport is mediated by the DNA. Larger scale structural changes such as dehybridization or melting of the duplex may provide necessary confirmation in some context. Careful use of multiple redox probes, including some that are able to undergo DNA CT and others that are unable to undergo DNA CT, can also be used to confirm a DNA-mediated signal.
Figure 1.3 Electrochemistry of a 100 base pair duplex with and without a single base mismatch. a, The multiplexed electrode and layout of DNA-modified electrodes used to compare DNA duplex monolayers formed under similar conditions. The duplex with the mismatch only differs from the other duplex in that a C was substituted for a T to
dramatic effect on charge transport that is mediated by the π-stack of the duplex. Incorporation of a particularly ruinous mismatch, such as CC or CA, will result in a significant decrease in the yield of DNA CT. (25) G-containing mismatches tend to be poor choices for this confirmation because they don’t have attenuate CT as dramatically. (25) An abasic site will have a more significant effect, but it is also a larger structural change. If the experiments are run at relatively high temperatures an abasic site is a better choice than a mismatch, because increasing the temperature decreases the attenuation caused by a mismatch and potentiates the attenuation caused by an abasic site. (43,44)
In hydrated experiments it is possible to take advantage of more dramatic
structural changes to verify that charge transport is DNA-mediated. Enzymatic cleavage by proteins can be used to release a region of DNA with a bound redox reporter,
effectively eliminating the DNA-mediated path. (45) Protein binding to their specific binding substrate, whether it is a particular sequence or structure (such as single stranded regions, overhangs, etc.), can also be used to verify the structure. (46) Solution conditions can be used to induce changes, such as switching from B-to-Z form DNA, that will reversibly change the charge transport properties. (47) It may also be useful to
dehybridize duplexes in solution followed by rehybridizing DNA with or without lesions (16).
Careful selection of redox active molecules can also be used to confirm DNA-mediated charge transport. DNA-DNA-mediated charge transport will only occur efficiently
with redox active molecules that couple to the π-stack. Probing the same DNA construct
difference in yield, if the charge transport is DNA-mediated. (47) Using covalently tethered probes can also allow for specific selection of a region that the redox probe is attached to, which can then be removed through enzymatic digestion. (48) It is also possible to use redox probes that selectively target mismatches or abasic sites, which should only show a DNA-mediated signal if that mismatch or abasic site is present in a duplex form. (49)
It is more complicated to verify charge transport is mediated by the DNA π-stack
in dried samples and DNA in other conditions that do not have known structures. Ideally the use of sequences that vary by containing a mismatch can be used to see whether the
measured conduction is only caused by charge transport mediated by the π-stack. The
access to conformational changes is severely limited, and it is unclear what structures are often tested, which makes data measuring charge transport through dried samples
susceptible to misinterpretation.
Summary
DNA-mediated charge transport is fascinating chemistry that relies on the π
-stacked structure present in some DNA conformations. Disrupting the π-stack inhibits
efficient charge transport. Thus, it is important that measurements of DNA CT have an understanding of the DNA structures that are being measured. Making small changes to the structure of a DNA duplex can have dramatic inhibition of CT yield. Thus,
procedures that may change the structure, and verify that the charge transport is DNA-mediated.
References
1) W. Saenger, Principles of nucleic acid structure., Springer-Verlag, New York,
1984
2) W. Fuller, M.H.F. Wilkins, H.R. Wilson, and L.D. Hamilton, J. Mol. Biol, 1965,
12, 60-80
3) R. Langridge, D.A. Marvin, W.E. Seeds, H.R. Wilson, C.W. Hooper, M.H.F. Wilkins, and L.D. Hamilton, J. Mol. Biol.1960, 2, 38-64
4) D.A. Marvin, M. Spencer, M.H.F. Wilkins, and L.D. Hamilton, J. Mol. Biol. 1961, 3, 547-565
5) S. Arnott, R. Chandrasekaran, D.L. Birdsall, A.G.W. Leslie, and R.L. Ratcliff,
Nature, 1980, 283, 743-745
6) S. Arnott, R. Chandrasekaran, D.W.L. Hukins, P.J.C. Smith, and L. Watts, J. Mol. Biol.1974, 88, 523-533
7) S.O. Kelley, J.K. Barton, Science1999, 283, 375
8) L. Valis, Q. Wang, M. Raytchev, I Buchvarov, H.-A. Wagenknecht, T. Fiebig,
Proc. Natl. Acad. Sci. U.S.A. 2006, 103, 10192
9) S. Delaney, M. Pascaly, P.K. Bhattacharya, K. Han, J.K. Barton, Inorg. Chem. 2002, 41, 1966
11) A.A. Gorodetsky, J.K. Barton, Langmuir, 2006, 22, 7917-7922
12) J.D. Slinker, N.B. Muren, A.A. Gorodetsky, and J.K. Barton, J. Am. Chem. Soc. 2010, 132, 2769-2774
13) C.G. Pheeney, J.K. Barton, J. Am. Chem. Soc.2013, 135, 14944
14) Z. Xie, T.Z. Markus, S.R. Cohen, Z. Vager, R. Gutierrez, R. Naaman, Nano. Lett. 2011, 11, 4652-5644
15) N. Kang, A. Erbe, E. Scheer New J. Phys. 2008, 10, 023030
16) X. Guo, A.A. Gorodetsky, J. Hone, J.K. Barton, and C. Nuckolls, Nat. Nanotech. 2008, 3, 163-167
17) E.M. Boon, and J.K. Barton, Bioconjugate Chem. 2003, 14, 1140-1147
18) M.A. O’Neill, H.C. Becker, C. Wan, J.K. Baron, A.H. Zewail, Angew. Chem. Int. Ed. 2003, 42, 5896
19) E.M. Boon, D.M. Ceres, T.G. Drummond, M.G. Hill, J.K. Barton, Nat. Biotechnol.2000, 18, 1096
20) A.G.W. Leslie, S. Arnott, R. Chandrasekaran, and R. L.Ratlif, J. Mol. Biol. 1980,
143, 49-72
21) S. Arnott, E. Selsing, J. Mol. Biol. 1974, 88, 551-552
22) P.K. Bhattacharya, J. Cha, J.K. Barton Nucl. Acids. Res. 2002, 30, 4740 23) W.N. Hunter, T. Brown, O. Kennard, Nucl. Acids. Res. 1987, 15, 6589 24) M.C. Buzzeo, J.K. Barton, Bioconjugate Chem. 2008, 19, 2110
25) A.K. Boal, J.K. Barton, Bioconjugate Chem. 2005, 16, 312
26) E.M. Boon, J.E. Salas, J.K. Barton, Nat. Biotechnol. 2002, 20, 282
28) T. Liu, J.K. Barton, J. Am. Chem. Soc. 2005, 127, 10160
29) Y. Osakada, K. Kawai, M. Fujitsuka, T. Majima, Chem. Commun. 2008, 23, 2656 30) E.M. Boon, N.M. Jackson, M.D. Wrightman, S.O. Kelley, M.G. Hill, J.K. Barton,
J. Phys. Chem. B2003, 107, 11805
31) H.-Z. Yu, C.-Y. Luo, C.G. Sankar, D. Sen, Anal. Chem. 2003, 75, 3902 32) J.G. Genereux, J.K. Barton Chem. Rev. 2010, 110, 1642-1662
33) C.R. Calladine, H.R. Drew, B.F. Luisi, A.A. Travers, Understanding DNA: The
Molecule and How It Works,2004, Elsevier Academic Press: San Diego
34) G. Bonner, A.M. Klibanov, Biotech. Bioeng. 2000, 68, 339-344
35) J. Svaren, S. Inagami, E. Lovegren, R. Chalkley, Nucl. Acid. Res. 1987, 15, 8379-8754
36) S. Arnott, E. Selsing, J. Mol. Biol.1974, 88, 509-521
37) M.S. Xu, S. Tsukamoto, S. Ishida, M. Kimatura, Y. Arakawa, R.G. Endres, M. Shimoda Appl. Phys. Lett.2005, 87, 083902
38) I. Kratochvilova, K. Kral, M. Buncek, A. Viskova, S. Nespurek, A. Kochalska, T. Todorciuc, M. Weiter, B. Schneider, Biophys. Chem. 2008, 138, 3-10
39) Z. Xie, T.Z. Markus, S.R. Cohen, Z. Vager, R. Gutierrez, R. Naaman, Nano Lett. 2011, 11, 4652
40) S. Xuan, Z. Meng, X. Wu, J.-R. Wong, G. Devi, E.K.L. Yeow, F. Shao ACS Sustainable Chem. Eng. 2016, 4, 6703-6711
41) H.W. Fink, C. Schoenberger, Nature, 1999, 398, 407
43) C.H. Wohlgamuth, M.W. McWilliams, and J.D. Slinker Anal. Chem. 2013, 85, 1462
44) M.A. McWilliams, R. Bhui, D.W. Taylor, J.D. Slinker J. Am Chem .Soc. 2015,
137, 11150
45) J.D. Slinker, N.B. Muren, S.E. Renfrew, J.K. Barton, Nature Chem. 2011, 3, 228 46) M.A. Grodick, H.M. Segal, T.J. Zwang, J.K. Barton, J. Am. Chem. Soc.2014,
136, 6470-6478
47) T.J. Zwang, S. Hurlimann, M.G. Hill, J.K. Barton, J. Am. Chem. Soc.2016, 138, 15551-15554
48) J.D. Slinker, N.B. Muren, S.E. Renfrew, J.K. Barton, Nature Chem. 2011, 3, 228 49) J.M. Abendroth, N. Nakatsuka, M. Ye, D. Kim, E. Fullerton, A.M. Andrews, P.S.
Weiss, ACS Nano2017Just accepted DOI: 10.1021/acsnano.7b04165 50) N.B. Muren, E.D. Olmon, J.K. Barton, Phys. Chem. Chem. Phys. 2012, 14,
Chapter 2
Helix-Dependent Spin Filtering
through the DNA Duplex
Adapted from Zwang, T.J., Hurlimann, S., Hill, M.G., and Barton, J.K. J. Am. Chem. Soc., 2016, 138 (48), 15551-15554
Introduction
DNA-mediated charge transport (DNA CT) is well established in both ground and excited state systems (1). Although theoretical models are still being developed, it is clear
that the integrity of the extended π-stack of the aromatic heterocycles, the nucleic acid
bases, plays a critical role:(2-4) electron donors and acceptors must be electronically well
coupled into the π-stack, typically via intercalation, and perturbations that distort the π
-stack, such as single-base mismatches, abasic sites, base lesions, and protein binding that kinks the double helix, attenuate DNA CT dramatically. This latter characteristic has found practical use in electronic devices and biosensors (5-7).
been offered to account for this effect (14-17). One question of particular interest is whether CISS depends more on the isolated molecular chiral centers or the large-scale macromolecular structures within the films (15).
Owing to its ability to undergo macromolecular conformational changes that affect the helical structure but not the local chirality of the sugar backbone, dsDNA in its native, hydrated state presents a unique opportunity to differentiate between the
monomeric and macromolecular parameters of CISS. Of particular interest is the
conformational switching between right-handed B-DNA and left-handed Z-DNA. At high salt concentrations, CG-repeat sequences in the right-handed B-form can flip into a left-handed zigzag Z-form helix (18). Notably, both B-DNA and Z-DNA support efficient DNA CT (19).
probes reduced, which can be used to quantify the yield of DNA CT under different experimental conditions. Importantly, the redox potentials of all of the probes lie well negative of the potential of zero charge of the working electrode (22). As a result, duplexes within the DNA film line up approximately normal to the gold surface with the magnetic field lines essentially collinear with the helical axes.
Materials and Methods
DNA Synthesis and purification. All materials for DNA synthesis were purchased from Glen Research. Oligonucleotides were synthesized on an Applied Biosystems 3400 DNA synthesizer using phosphoramidite chemistry on a controlled-pore glass support. The two strands of a duplex were synthesized separately, purified, stored frozen, and then
annealed prior to electrochemical experiments. The 5’- end of one strand was modified with a C6 S-S phosphoramidite that is later reduced before use. The 5’- end of the complementary strand is either unmodified or modified with an NHS-Carboxy-dT phosphoramidite for later coupling with Nile blue. High performance liquid
chromatography (HPLC) was performed using a reverse-phase PLRP-S column (Agilent) using a gradient of acetonitrile and 50 mM ammonium acetate (5-35% acetonitrile over 30 minutes).
Unmodified DNA. DNA was synthesized using standard phosphoramidites (dA-CE,
concentrated (28-30%) NH4OH for 12 hours, filtered using CoStar columns, and then
dried. The dried DNA film was resuspended in phosphate buffer (5 mM phosphate, pH 7, 50 mM NaCl) and HPLC-purified. The DMT (4,4’-dimethoxytrityl) group protecting the 5’- end was then removed by incubation with 80% acetic acid for 45 minutes. The reaction mixture was dried and resuspended in phosphate buffer. The DNA was isolated using HPLC. The purified oligonucleotide was desalted using ethanol precipitation, dried, and the mass confirmed with Matrix-assisted laser desorption/ionization- time of flight mass spectrometry (MALDI-TOF). Unmodified oligonucleotides were then stored at -20oC in phosphate buffer until annealing with their complementary strand.
Thiolated DNA. DNA was synthesized using standard phosphoramidites (dA-CE, dT-CE,
dC-CE, dG-CE) and reagents, with the exception of a C6 S-S phosphoramidite that was attached to the 5’- end. After synthesis, the DNA was lyophilized overnight. It was then cleaved from the solid support by incubation at 60o C with concentrated (28-30%)
NH4OH for 12 hours, filtered using CoStar columns, then dried. The dried DNA film was
resuspended in phosphate buffer (5 mM phosphate, pH 7, 50 mM NaCl) and HPLC-purified. The DMT (4,4’-dimethoxytrityl) group protecting the 5’- end was then removed by incubation with 80% acetic acid for 45 minutes. The reaction mixture was dried and resuspended in phosphate buffer. The DNA was isolated using HPLC. The purified oligonuceotide was desalted using ethanol precipitation, dried, and the mass was confirmed with Matrix-assisted laser desorption/ionization- time of flight mass
dithiothreitol (Sigma) for 2 hours. The reduced thiol-modified DNA was then purified by size exclusion chromatography (Nap5 Sephadex, G-25, GE Healthcare) with phosphate buffer as the eluent and subsequently purified using HPLC.
Covalent Coupling of Nile Blue to DNA. DNA was synthesized using ultramild
procedures from Glen Research, which mainly involve using different phosphoramidites, Cap A, and bead cleavage reagents to prevent degradation of the NHS-Deoxy-dT
phosphoramidite (24). Phophoramidites compatible with ultramild synthesis (dT-CE, Pac-dA-CE, Ac-dC-CE, and iPr-Pac-dG-CE phosphoramidites) were used as well as ultramild Cap A (5% phenoxyacetic anhydride in THF/Pyridine). An NHS-Deoxy-dT phosphoramidite was attached to the 5’- end. After synthesis, the DNA was dried overnight in a lyophilizer. Nile blue perchlorate (Sigma) was then dissolved (15 mg/ml) in anhydrous N,N-dimethylformamide and activated with 10% v/v DIEA
(N,N-Diisopropylethylamine). This Nile blue solution was then incubated with the DNA overnight with gentle shaking. At least 18 hours later, the DNA solid support beads were rinsed with N,N-dimethylformamide and then dichloromethane. The DNA was then cleaved from the solid support by incubating with 0.05 M potassium carbonate in methanol for 4 hours at ambient temperature. The DNA was then dried, resuspended in phosphate buffer, and the oligonucleotide isolated with HPLC. The purified
Synthesis of 3’-Dabcyl-DNA.DNA was synthesized using standard phosphoramidites and reagents, with the exception of 3’-Dabcyl modified controlled pore glass (CPG) beads. After synthesis, the DNA was lyophilized overnight. It was then cleaved from the solid support by incubation at ambient temperature with concentrated (28-30%) NH4OH for 2
hours, spin filtered to remove the solid support beads, and then dried. The oligonucleotide was resuspended in phosphate buffer and HPLC-purified. The DMT
(4,4’-dimethoxytrityl) group protecting the 5’- end was then removed by incubation with 80% acetic acid for 45 minutes, dried, resuspended in phosphate buffer, and re-purified using HPLC. The purified strand was desalted using ethanol precipitation, dried, and the mass was confirmed with MALDI-TOF.
Annealing Duplex DNA. Duplex DNA for electrochemistry was prepared by first
DNA Sequences: CG-repeat
3’-GCG CGC GCG CGC GCG C-5’
HS-C6- 5’-CGC GCG CGC GCG CGC G-3’
CmG-repeat
3’-GCmG CmGCm GCmG CmGCm GCmG Cm
HS-C6- 5’-CmGCm GCmG CmGCm GCmG CmGCm G-3’
16bp DNA
3’- TGC AGA GTT GAG TGC A-5’
HS-C6- 5’-ACG TCT CAA CTC ACG T-3’
30bp DNA (well-matched)
3’-AGA GTT CTT AGC CGT AAT CGA GTT GAC AGT-5’
HS- C6- 5’- TCT CAA GAA TCG GCA TTA GCT CAA CTG TCA-3’
30bp DNA (C:A mismatch)
3’-AGA GTC CTT AGC CGT AAT CGA GTT GAC AGT-5’
HS- C6- 5’- TCT CAA GAA TCG GCA TTA GCT CAA CTG TCA-3’
17 bp NB (Well matched)
3’-CGA GTC ATG CTG CAG CT-5’-NB HS-C6-5’-GCT CAG TAC GAC GTC GA-3’
17 bp NB (C:A mismatch)
3’-CGA GTC ATG CTG CAG CT-5’-NB HS-C6-5’-GCT CAA TAC GAC GTC GA-3’
29 bp NB
3’-CAC CGT CCA GTC AGT ACA TAT GAC GTG AT-5’-NB HS-C6-5’-GTG GCA GGT CAG TCA TGT ATA CTG CAC TA-3’
43 bp NB
3’-CGT CAT CCA CTT AGC ACC GTC CAG TCA GTA CAT ATG ACT TGA T-5’-NB HS-C6-5’-GCA GTA GGT GAA TCG TGG CAG GTC AGT CAT GTA TAC TGA ACT A-3’
60 bp NB
3’-CAA GTA CTG TAT GCA TGC GTC ATC CAC TTA GCA CCG TCC AGT CAG TAC ATA TGA CTT GAT-5’-NB
HS-C6-5’-GTT CAT GAC ATA CGT ACG CAG TAG GTG AAT CGT GGC AGG TCA GTC ATG
TAT ACT GAA CTA-3’ 29 bp Dabcyl
DAB-3’-CAC CGT CCA GTC AGT ACA TAT GAC GTG AT-5’ HS-C6-5’-GTG GCA GGT CAG TCA TGT ATA CTG CAC TA-3’
The above sequences use the following abbreviations for modifications:
Electrode Fabrication
Single electrode surface fabrication was carried out at UCLA and received as a gift from Paul Weiss and John Abendroth following the general protocol of R. Naaman et al (20). P-type oxidized silicon wafers were coated with 25 nm titanium as an adhesive layer, following deposition with 200 nm nickel then 10 nm gold. The surfaces were then cleaved into 1 cm x 1.5 cm rectangles and used following the preparation below (for a total 1 cm2 exposed surface area for experiments following device assembly).
Multiplexed electrode surfaces were fabricated following a modified version of a published protocol (24) using the gold-capped nickel as the electrode material. In brief, one millimeter thick Si wafers with a 10 000 Å thick oxide layer were purchased from Silicon Quest. First, wafers were cleaned thoroughly in 1165 Remover (Microchem) and vapor primed with hexamethyldisilizane (HMDS). SPR 220 3.0 photoresist (Microchem) was spin-cast at 4000 rpm and baked. The photoresist was patterned with a Karl Suss MA6 contact aligner and a chrome photomask. Following postexposure baking, wafers were developed in AZ 300 MIF developer for 1 min and rinsed thoroughly with
for a permanent set of the photoresist. The wafers were subsequently diced into 1-in. by 1-in. chips and used for electrochemistry experiments.
DNA-modified electrode preparation
Gold-capped nickel surfaces or multiplexed chips are gently cleaned by rinsing with ultrapure water, acetone, isopropanol, and finally a second rinse with ultrapure water before drying with argon. They are then cleaned with a UVO Cleaner Model 42 (Jelight Co.) for 20 minutes. Immediately after cleaning the surface, a plastic clamp and rubber (BunaN) gasket were affixed to the surface to create a well for liquid and either 50 μM duplex DNA, single stranded DNA, or no DNA in phosphate buffer (pH 7, 5 mM
phosphate, 50 mM NaCl, 100 mM MgCl2) to make densely packed films. The DNA was
incubated on the surface for 18-24 hours. Once the DNA is on the surface, it cannot be dried without compromising the structure and therefore the measured properties of the
film. The solution was then exchanged 5x with 1 μM mercaptohexanol in phosphate
buffer (pH 7, 5 mM phosphate, 50 mM NaCl, 5% glycerol) and incubated for 45 minutes. Lastly the surface was rinsed at least 5x with either phosphate buffer (pH 7, 5 mM
phosphate, 50 mM NaCl) for most experiments or tris buffer (pH 7.6, 10 mM Tris, 100 mM KCl, 2.5 mM MgCl2, 1 mM CaCl2) for experiments using dabcyl, and
Electrochemical measurements
The central well around the electrode surface created by the clamp was filled with one of three buffers prior to electrochemical measurements: a phosphate buffer with MgCl2 (pH
7, 5 mM phosphate, 50 mM NaCl, 10 mM MgCl2), a phosphate buffer without MgCl2
(pH 7, 5 mM phosphate, 50 mM NaCl), and a tris buffer (pH 7.6, 10 mM Tris, 100 mM KCl, 2.5 mM MgCl2, 1 mM CaCl2). The phosphate buffer was used for all experiments,
except those containing dabcyl. The phosphate buffer without MgCl2 was only used to
collect data with experiments comparing methylated and unmethylated dsDNA. The tris buffer is necessary for both the reduction and oxidation of dabcyl to occur within the potential range that we can scan. Our experiments did not show a statistically significant difference in the magnitude of spin selectivity when comparing DNA sequences of the same length in the different buffers, except in the cases where the increased ionic strength helped prevent electrostatic binding of MB to the phosphate backbone. An AgCl/Ag reference electrode (Cypress) was coated with a solidified mixture of 1% agarose and 3M NaCl in water inside a long, thin pipette tip. The tip was cut so that the salt bridge could connect the electrode to the buffer from the top of the well. A platinum wire used as an auxiliary electrode was also submerged in the buffer from the top of the well. The
Magnetic field experiments were conducted using a 6619 Guass surface strength
magnetic field neodymium magnet (K&J Magnetics). Alligator clips were replaced with nonmagnetic stainless steel to minimize magnetic interference. All other parts of the assembly were created using plastic to prevent extraneous objects the magnetic field could influence. Additionally, the strong magnet was waved near the potentiostat during operation, with no obvious change in signal that was apparent, to ensure that the magnet was not interfering with the operation of the potentiostat. Each experiment that was conducted for magnetic field pointing up vs down were done by comparing the same surface in the same solution under these varying field directions in order to minimize variability caused by other factors.
Noncovalent Methylene Blue. Solutions of 1μM or 10μM methylene blue were made in
phosphate buffer (pH 7, 5 mM phosphate, 50 mM NaCl, 10 mM MgCl2). Cyclic
voltammograms were collected using a scan rate of 0.1, 0.5, 1, 5, 10, and 20 V/s, which scanned from 0V to -0.55V (vs AgCl/Ag) then back to 0V at least 6 times consecutively for each experiment. The magnetic field direction was then switched, scanned, and switched again multiple times. The first reductive and oxidative sweeps were compared because subsequent scans see a diminishing effect. This attenuation is restored upon waiting for approximately 30 seconds between scans.
Ruthenium Hexammine. A concentration of 10 μM Ru(NH3)6 3+ was added to the
consecutively for each experiment. The magnetic field direction was then switched, scanned, and switched again multiple times. The first reductive and oxidative sweeps were compared.
B-to-Z DNA Experiments. Experiments were conducted with solutions of 1 μM
methylene blue in phosphate buffer with and without 10 mM MgCl2. Cyclic
voltammograms were collected at a scan rate of 0.1 V/s, which scanned from 0V to -0.4V (vs AgCl/Ag) then back to 0V at least 6 times consecutively for each experiment. The magnetic field direction was then switched, scanned, and switched again at least 4 times. Following these scans, phosphate buffer with 10 mM MgCl2 was placed in the well by
exchanging the solution 5 times. The surfaces were scanned in a similar manner as before, and then the solution was again exchanged 5 times to replace it with a phosphate buffer without magnesium. It was then scanned similarly.
Covalent Nile Blue. Experiments were conducted in phosphate buffer with 4 different lengths of DNA, each with Nile blue covalently tethered at the 5’- end away from the surface. Cyclic voltammograms were collected using a scan rate of 0.1, 0.5, 1, 5, 10, and 20 V/s, which scanned from 0V to -0.55V then back to 0V 20 times consecutively for each experiment. The magnetic field direction was then switched, scanned, and switched again multiple times. The first reductive and oxidative sweeps were compared.
3’-Dabcyl. Experiments were conducted in tris buffer (pH 7.6, 10 mM Tris, 100 mM
KCl, 2.5 mM MgCl2, 1 mM CaCl2) with 1μM methylene blue. Due to the relatively slow
scan rate of 10 mV/s so the peak splitting allowed for both the reductive and oxidative peaks to lie within the measurable potential range. The experiments scanned from 0V to -0.6V (vs AgCl/Ag) then to 0.5V and repeated scanning between 0.5V and --0.6V 20 times consecutively for each experiment. The magnetic field direction was then switched, scanned, and switched again multiple times. The first reductive and oxidative sweeps were compared.
Calculating the surface concentration of DNA
Surface concentration of DNA was quantified based on the total area of the reductive signal generated from a cyclic voltammogram of electrostatic binding of Ru(NH3)6 3+ to
the phosphate backbone of dsDNA. This was done under saturation conditions (10 μM
Ru(NH3)6 3+). The following equation was used to relate the reductive signal (QRu) to the
surface concentration of DNA (ΓDNA):
In this equation, A is the electrode area in cm2, F is the Faraday constant, n is the number
of electrons per reduction event, z is the charge on the Ru(NH3)6 3+, and m is the number
Circular Dichroism Spectroscopy
An Aviv 62A DS spectropolarimeter was used to collect circular dichroism (CD) spectra.
Data were obtained from samples containing 3 μM d(mCG)
8or 3 μM d(CG)8 dsDNA in
phosphate buffer (5 mM phosphate, 50 mM NaCl, pH7) using a 1.0 mm path length cell (Figure 2.1). Scans were conducted with samples that were incubated in the presence or absence of 10 mM MgCl2. Data presented in figures represent the average of three scans.
Figure 2.1 Circular dichroism spectra of d(CG)8 DNA. [A] unmethylated d(CG)8 and [B]
Spin Polarization Calculations
The spin polarization (S) is defined as:
(1.1)
in which I+and I- are the intensities of the signals corresponding to the spin oriented
parallel and antiparallel to the electrons’ velocity (12). The spin polarization for electrons
travelling through dsDNA is calculated assuming that the injected spin polarization is 23% which, using equation 1.1, results in the total amount of each spin injected assumed to be 0.615 and 0.385, with the majority spin depending on the magnetization direction (20). The amount of charge transferred to the probe (Q), which is determined by integrating the current under the reductive or oxidative peak in the cyclic
voltammograms, can be related to the injected spin polarization by the following equation:
(1.2)
where η+ and η- are the yield for the amount of injected spin oriented parallel and
antiparallel, respectively, to the velocity of the electrons that reduce the probe compared to the total amount injected. Therefore the amount of probe reduced can be related as Q = 0.615 (YieldUp) + 0.385 (YieldDown) for one magnetization and Q = 0.615 (YieldDown) +
Modifying equation 1.1 to solve for the spin polarization through dsDNA gives equation 1.3.
(1.3)
Solving for η+ and η- and placing them into equation 1.3 gives the spin polarization of
electrons moving through dsDNA (SDNA).
Results
Figure 2.2 Cyclic voltammetry of electrodes modified with 16 bp dsDNA. A. Illustration of the dsDNA modified electrodes with 1 μM MB (left) or 10 μM Ru(NH3)63+ (right). MB intercalates
into dsDNA and CT is through the helix, while Ru(NH3)63+ binds electrostatically to the phosphate
backbone and electron transfer is directly from the surface. B. For intercalated MB (above) and electrostatically bound Ru(NH3)63+ (below) reduction yield in aqeuous buffer (pH 7, 5 mM
phosphate, 50 mM NaCl, and 10 mM MgCl2) upon switching the magnetic field direction. The
change in yield is highly reproducible for at least 10 changes in magnetic field direction with the same surface. Data were normalized to the first scan with the magnetic field pointing up. The experiment was repeated 3 times with independently created surfaces and the standard error is plotted. C. Representative cyclic voltammograms scanning methylene blue (above) or Ru(NH3)63+
(below) with the magnet up (red, solid) and magnet down (blue, dotted). D. Difference plot for the reduction of methylene blue (above) or Ru(NH3)63+ (below) showing the current when the magnetic
field is pointing up minus the current when the magnetic field pointing down. The Ru(NH3)63+
Importantly, the difference in reduction yield is observed regardless of which direction the nickel is magnetized initially, and the difference persists even when taking multiple scans. There is also no discernible change in the magnetic field effect upon varying the scan rate between 10 mV/s and 20 V/s (21).
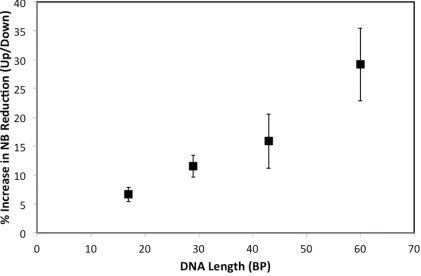
The magnetic field dependence of DNA CT was also examined using Nile blue (NB) as a redox probe. NB is covalently bound to DNA, and conjugated through a DNA base, and has been used extensively as a covalent redox reporter (Figure 2.3)
(24-26). Self-assembled monolayers of 17 bp thiolated dsDNA with tethered NB (∼40 pmol/cm2) show a change in the integrated reduction peaks of 7 ± 1% upon switching the
magnetic field direction. The magnitude of this effect increases with increasing length of dsDNA to 12 ± 2% for 29bp, 16 ± 4% for 43bp, and 29 ± 6% for 60bp oligomers (Figure 2.4). These data with NB reveal a clear dependence of the yield of DNA CT on magnetic field orientation.
There is no measurable effect on the charge-transfer rates with a change in magnetic field direction. To test for effects of the magnetic field on the CT rate, we varied the scan rate from 50 mV/s to 20 V/s (Figure 2.5); we see no difference in the cathodic/anodic peak splittings when the magnetic field direction is switched, suggesting that there is no measurable effect on the charge transfer rates with a change in magnetic field direction. We stress, however, that previous work has shown that in these
Figure 2.3 Representative cyclic voltammetry data for various assemblies of DNA-modified electrodes.29 bp dsDNA was tethered to a gold-capped nickel surface with an alkanethiol linker. In all cases the data were obtained at 100 mV/s scan rate in phosphate buffer (5 mM NaH2PO4, 50
mM NaCl, pH 7.0). A permanent neodymium magnet with surface field strength of 0.66T was placed 2 mm underneath the surface and flipped to give a magnetic field pointing towards (up, red) or away from (down, blue) the surface. Shown (center) are cyclic voltammograms for 1 μM MB with dsDNA linked to a 10 nm thick gold cap (top left), covalent NB conjugated to dsDNA linked to a 10 nm thick gold cap (top right), 1 μM MB in contact with single stranded DNA adsorbed to a 10 nm thick gold cap (center left), 10 μM MB in contact with a 10 nm thick gold cap without DNA (center right), 1 μM MB with dsDNA linked to a 35 nm thick gold cap (bottom left), 10 μM Ru(NH3)63+ with dsDNA linked to a 10 nm thick gold cap (bottom right). Insets display the full
tunneling efficiencies of oppositely polarized currents through the π-stack would not be accessible electrochemically (27).
Our data lead to the calculation that electrons traveling through a densely packed monolayer of 16 bp dsDNA to MB must be at least 22.5±1.2% spin polarized at ambient temperature. Charge transport through 60 bp dsDNA to a covalently tethered NB probe must be at least 55±10% spin polarized. It should be evident that decreasing the initial spin polarization will increase the calculated spin polarization through dsDNA; therefore, these calculated values can be considered lower estimates. If the nickel injected 13% spin polarized electrons, then the electrons passing through 60bp dsDNA would be 100% spin polarized, which could be treated as a theoretical maximum.
Given the range of possible etiologies for the observed magnetic field effect on the electrochemistry of MB and NB, we carried out a series of control experiments (Figure 2.3). Monolayers in which MB is adsorbed directly onto the gold-capped nickel electrodes in the absence of DNA show no differences in the reduction yield of MB upon switching the orientation of the magnetic field. Similarly, there is no magnetic field effect on the reduction of MB bound electrostatically to surfaces coated with single stranded DNA. Moreover, capping the nickel electrodes with a thicker (35 nm) gold layer eliminates the magnetic field effects, even for electrodes modified with dsDNA.
Nonintercalative redox probes were also examined for comparison.
Ru(NH3)63+ binds electrostatically to the phosphate backbone of DNA and undergoes
(28). Significantly, we find no magnetic field dependence of the Ru(NH3)63+/2+ couple,
despite its proximity to the chiral macromolecule and likely helical path (Figure 2.2). We also prepared dsDNA with a covalently bound diazobenzene probe (dabcyl) tethered to
the 3′-phosphate near the electrode surface. This arrangement allowed us to monitor
simultaneously the direct electrode reduction of dabcyl, which contacts the electrode surface, and the DNA-mediated reduction of MB. There is a significant difference in the up/down yield of MB reduction, but no measurable difference for the dabcyl signal (Figure 2.6).
We examined the effect of an intervening single base mismatch in the film (Figure 2.7). A mismatch incorporated into dsDNA between the surface and the redox probe decreases the yield of CT to either MB or NB, which shows that the DNA duplex mediates the CT (24); charge migrates through the DNA base pair stack. Interestingly, the spin selectivity measured through a mismatch mirrors the magnitude of the effect seen in well-matched duplexes of similar length. This result suggests that when charge is successfully transported through dsDNA with a mismatch, it travels through the entire dsDNA to the probe; the attenuation in CT yield with a mismatch leads to an interruption of some of that CT, but has no effect on spin selectivity.
If the helical structure of dsDNA is responsible for the apparent CISS behavior in these films, it follows that reversing the chirality of the helices would switch the sense of the magnetic field effect. Indeed, this is precisely what we find. Both methylated and unmethylated monolayers of 16bp duplexes featuring d(CG)8 repeats were self-assembled
onto gold-capped nickel. Circular dichroism confirms that DNA oligomers containing 5-methylcytosine, d(mCG)8, undergo a B-to-Z transition in the presence of 10 mM MgCl2,
while the unmethylated analog, d(CG)8, remains in B-form (Figure 2.1); methylated
Z-DNA reverts back to B-Z-DNA upon rinsing away the MgCl2 (18, 29, 30). Previous work
has shown that MB intercalates into both B- and Z-DNA and undergoes DNA-mediated reduction in the presence of 10 mM MgCl2 (19).
We carried out the electrochemistry to examine B- and Z-form helices on a multiplexed chip (24) consisting of 16 separate gold-capped nickel regions that allowed for the simultaneous comparison of four distinct monolayers under the identical magnetic field (Figure 2.8). In the absence of MgCl2, both methylated and unmethylated DNA
films show the same favored magnetization direction for a higher yield of MB reduction (up/down ratio = 18 ± 3%). Upon addition of 10 mM MgCl2, the unmethylated films
show no change in behavior, but the methylated films switch which magnetic field
direction promotes the higher yield of MB reduction (up/down ratio = −9 ± 2%).
Replacing the buffer with one that lacks MgCl2 reverts the structure from Z- to B-form
Figure 2.8 Switching of methylated and unmethylated dsDNA measured on a single multiplexed chip. A. A chip with 16 separate gold-capped nickel regions allowed for the comparison of four distinct monolayers made from 16 and 30 bp methylated d(mCG)15 and unmethylated d(CG)15
dsDNA. The data were obtained at 100 mV/s scan rate with 1 μM MB in phosphate buffer (5 mM NaH2PO4, 50 mM NaCl, pH 7.0). B. Summary of cyclic voltammetry data for the two
magnetizations were collected for all four quadrants with no MgCl2, then with 10 mM MgCl2, then
once washing away the MgCl2. Each bar represents a minimum of 4 separate electrode surfaces
with at least 36 separate scans. The standard error is used to represent deviations from the mean. C. Representative example of 30 bp (top) methylated d(mCG)15 and (bottom) unmethylated d(CG)15
DNA either with 10 mM MgCl2 (right) or with no MgCl2 (left) from two electrodes on the same
In addition to functioning as a magnetic field diode, switching between B- and Z-form dsDNA gives a difference in the magnitude of DNA CISS; normalized to the yield of electrochemically active MB and with the assumption that 10 mM MgCl2 results in
complete conversion of surface-bound DNA to Z-form, B-DNA appears to have an approximately 50% larger spin selectivity than Z-DNA. This change in magnitude of spin selectivity correlates well with the change in pitch between B-DNA and Z-DNA (3.32 and 4.56 nm respectively) but may result from other differences between the two forms
(such as the greater π-stacking in the B- versus Z-form) (18, 29, 30). These data suggest
that the charge is moving through the duplex along a helical path, because a charge
moving in a fully delocalized π-stacked column would not be able to interact with the
handedness of the macromolecule; helical transport among delocalized domains of a few base pairs is possible.
The CISS measured in these experiments is significantly larger than expected for molecules that lack large spin–orbit coupling. Calculating the energy difference between the two electron spins at the surface of fully magnetized nickel (∼0.6 T) yields a gap
(μBgB≈ 1 cm–1) far lower than kbT at ambient temperature. Several theoretical models
have been proffered to rationalize the large CISS exhibited by chiral organic films (16, 17, 31-35). Aspects of each of these models can be used to understand our data. In addition, it is worthwhile to consider other factors not currently included in these models
that are important in the context of DNA CT, such as the large polarizability of the π
Summary and Conclusions
Our experiments thus demonstrate that magnetic fields can affect the flow of electrons through native, hydrated dsDNA. Significantly, our data show that
electrochemically generated DNA CISS is observed only at films containing duplex DNA
and with redox probes intercalated into the π-stack that undergo DNA-mediated CT.
Magnetic field effects are not observed with redox reporters bound electrostatically to the DNA duplex nor with tethered reporters that contact the surface directly. It is not simply the electrostatic helical field that is responsible for the spin selectivity. Nor is it simply the chiral centers on the DNA; redox reporters bound to single stranded DNA do not show magnetic field effects. As with DNA CT, the extended π-stack appears to play a crucial role: reversing the handedness of the helix in the films generates a diode-like spin-filtering response. It is interesting to consider how conformational changes such as that between B- and Z-DNA might be utilized as a diode in organic spintronics, indeed, how this spin filtering might be applied in practical devices. Finally, it is intriguing to consider whether Nature exploits this helix-dependent spin selectivity of DNA in some context.
References
(1) Genereux, J. C.; Barton, J. K. Chem. Rev. 2010, 110, 1642−1662.
(2) Guo, X.; Gorodetsky, A. A.; Hone, J.; Barton, J. K.; Nuckolls, C. Nat. Nanotechnol.
2008, 3, 163−167.
(4) Berlin, Y. A.; Voityuk, A. A.; Ratner, M. A. ACS Nano2012, 6, 8216. (5) Porath, D.; Cuniberti, G.; Felice, R. D. Top. Curr. Chem. 2004, 237, 183. (6) Drummond, T. G.; Hill, M. G.; Barton, J. K. Nat. Biotechnol. 2003, 21, 6475.
(7) Barton, J. K.; Furst, A. L.; Grodick, M. A. In DNA in Supramolecular Chemistry and Nanotechnology, Stulz, E., Clever, G. H, Eds.; Wiley: West Sussex, U.K., 2015.
(8) Gohler, B.; Hamelbeck, V.; Markus, T. Z.; Kettner, M.; Hanne, G. F.; Vager, Z.; Naaman, R.; Zacharias, H. Science2011, 331, 894.
(9) Xie, Z.; Markus, T. Z.; Cohen, S. R.; Vager, Z.; Gutierrez, R.; Naaman, R. Nano Lett. 2011, 11, 4652−5644.
(10) Sun, D.; Ehrenfreund, E.; Varedny, Z. V. Chem. Commun. 2014, 50, 1781−1793. (11) Michaeli, K.; Kantor-Uriel, N.; Naaman, R.; Waldeck, D. H. Chem. Soc. Rev. 2016, DOI: 10.1039/C6CS00369A
(12) Mondal, P. C.; Kantor-Uriel, N.; Mathew, S. P.; Tassinari, F.; Fontanesi, C.; Naaman, R. Adv. Mater. 2015, 27, 1924−1927.
(13) Dor, O. B.; Yochelis, S.; Mathew, S. P.; Naaman, R.; Paltiel, Y. Nat. Commun.
2013, 4, 2256.
(14) Gutierrez, R.; Diaz, E.; Naaman, R.; Cuniberti, G. Phys. Rev. B: Condens. Matter Mater. Phys.2012, 85, 081404.
(15) Naaman, R.; Waldeck, D. H. Annu. Rev. Phys. Chem. 2015, 66, 263. (16) Guo, A.-M.; Sun, Q.-F. Phys. Rev. Lett. 2012, 108, 218102.
(20) Mondal, P. C.; Fontanesi, C.; Waldeck, D. H.; Naaman, R. ACS Nano2015, 9, 3377−3384.
(22) Kelley, S. O.; Barton, J. K.; Jackson, N. M.; McPherson, L. D.; Potter, A. B.; Spain, E. M.; Allen, M. J.; Hill, M. G. Langmuir1998, 14, 6781.
(23) Kelley, S. O.; Barton, J. K.; Jackson, N.; Hill, M. G. Bioconjugate Chem. 1997, 8, 31−37.
(24) Slinker, J. D.; Muren, N. B.; Renfrew, S. E.; Barton, J. K. Nat. Chem. 2011, 3, 230−233.
(25) Gorodetsky, A. A.; Hammond, W. J.; Hill, M. G.; Slowinski, K.; Barton, J. K.
Langmuir2008, 24, 14282−14288.
(26) Muren, N. B.; Barton, J. K. J. Am. Chem. Soc.2013, 135, 16632− 40.
(27) Drummond, T. G.; Hill, M. G.; Barton, J. K. J. Am. Chem. Soc. 2004, 126, 15010. (28) Yu, H.-Z.; Luo, C.-Y.; Sankar, C. G.; Sen, D. Anal. Chem.2003, 75, 3902.
(29) Hartmann, B.; Lavery, R. Q. Rev. Biophys.1996, 29, 309−368.
(30) Wang, A. H.-J.; Quigley, G. J.; Ko