SYSTEMATIC REVIEW
To what extent do mesophotic coral
ecosystems and shallow reefs share species
of conservation interest? A systematic review
Jack H. Laverick
1,2*, Shanice Piango
3, Dominic A. Andradi‑Brown
1,2,11, Dan A. Exton
2, Pim Bongaerts
4,
Tom C. L. Bridge
5,6, Michael P. Lesser
7, Richard L. Pyle
8, Marc Slattery
9, Daniel Wagner
10and Alex D. Rogers
1Abstract
Background: Globally, shallow‑water coral reef biodiversity is at risk from a variety of threats, some of which may attenuate with depth. Mesophotic coral ecosystems (MCEs), occurring from 30 to 40 m and deeper in tropical loca‑ tions, have been subject to a surge of research this century. Though a number of valuable narrative reviews exist, a systematic quantitative synthesis of published MCE studies is lacking. We conducted a systematic review to collate mesophotic research, including studies from the twentieth century to the present. We highlight current biases in research effort, regarding locations and subject matter, and suggest where more attention may be particularly valu‑ able. Following a notable number of studies considering the potential for mesophotic reefs to act as refuges, it is important to know how comprehensive these sources of recruits and organisms capable of moving to shallow water reefs may be.
Methods: We search seven sources of bibliographic data with two search strings, as well as personal libraries. Articles were included if they contained species presence data from both shallower and deeper than 30 m depth on tropi‑ cal coral reefs. Studies were critically appraised based on the number of species identified and balanced sampling effort with depth. Maximum and minimum depths per species were extracted from each study, along with study region and taxon. We quantified the degree of community overlap between shallow tropical reefs (< 30 m) and reefs surveyed at the same locations below 30 m. Proportions of shallow species, across all studied taxa, observed deeper than 30 m were used to generate log odds ratios and passed to a mixed‑effects model. Study location and taxon were included as effect modifiers. Funnel plots, regression tests, fail safe numbers, and analysis of a high validity subgroup contributed to sensitivity analyses and tests of bias.
Results: Across all studies synthesised we found two‑thirds of shallow species were present on mesophotic reefs. Further analysis by taxon and broad locations show that this pattern is influenced geographically and taxonomically. Community overlap was estimated as low as 26% and as high as 97% for some cases.
Conclusions: There is clear support for the hypothesis that protecting mesophotic reefs will also help to conserve shallow water species. At the same time, it is important to note that this study does not address mesophotic‑specialist communities, or the ecological forces which would permit refuge dynamics. As we limit our analysis to species only present above 30 m it is also possible diversity found exclusively deeper than 30 m warrants protection in its own right. Further research into relatively ignored taxa and geographic regions will help improve the design of protected areas in future.
Keywords: Depth, Community structure, Biodiversity, Coral reefs, Twilight zone, Refuge
© The Author(s) 2018. This article is distributed under the terms of the Creative Commons Attribution 4.0 International License (http://creat iveco mmons .org/licen ses/by/4.0/), which permits unrestricted use, distribution, and reproduction in any medium, provided you give appropriate credit to the original author(s) and the source, provide a link to the Creative Commons license, and indicate if changes were made. The Creative Commons Public Domain Dedication waiver (http://creat iveco mmons .org/ publi cdoma in/zero/1.0/) applies to the data made available in this article, unless otherwise stated.
Open Access
*Correspondence: [email protected]
1 Department of Zoology, University of Oxford, The Tinbergen Building, South Parks Road, Oxford OX1 3PS, UK
Background
Mesophotic coral ecosystems (MCEs) occur between 30 and 40 m at their shallowest in tropical and sub-tropi-cal regions [1] and can be found deeper than 150 m [2]. MCEs are considered understudied in comparison to shallow reefs [3], likely because of difficulties of access [4], yet when accounted for they may greatly increase global reef area [5]. MCEs may be protected from com-monly cited threats in comparison to shallow reefs [6–
9], and additionally may provide recruits to aid shallow reef recovery [10, 11]. The amount of research published on mesophotic reefs is increasing [12] as technology advances and research groups grow [13].
Research efforts are attempting to increase awareness regarding MCEs, while calling for their conservation [14]. Protecting MCEs is often justified by the hypoth-esised existence of deep reef refuges [13] as shallow reefs continue to suffer damage [15]. In areas where there is a substantial degree of community overlap between shal-low reefs and MCEs, species may persist locally on MCEs despite extirpation in the shallows [16, 17]. If these deep populations are reproductively active [18] then shallow reefs may be able to recover through vertical connectivity [10, 19].
Some studies have found that MCEs support high lev-els of endemism [20], offering alternative justification for protecting MCEs as they may harbour distinct geo-graphical communities. Similarly, some researchers now argue MCEs could be identified by their own depth-spe-cific ecological communities [21, 22]. These studies bring into question the general degree of community overlap between MCEs and shallow reefs [8] as currently defined by a 30–40 m depth limit based on SCUBA regulations. Understanding how many shallow reef species may be protected on reefs at depths greater than 30 m will aid the future decisions of conservation managers [23].
Narrative reviews of the MCE literature have been con-ducted a number of times [2, 13, 24–28], highlighting older studies and changes of key terms used to describe MCEs historically [1, 29]. Narrative reviews, however, may be subject to subconscious biases in article selection [30]. It is also difficult to ensure older studies, without keywords relating to depth ranges which fit in the mod-ern framework, are re-discovered. Recently the bibliog-raphies of a number of key reviews, publications from an online MCE database (www.mesop hotic .org), and broader databases were systematically collated to show the state of the field [12]. However, existing reviews have stopped short of quantitatively synthesising the results of past studies.
As shallow reefs globally are increasingly threatened [15], we conduct a meta-analysis quantifying the extent of community overlap between shallow and mesophotic
reefs across all taxa. We determine the proportion of shallow species which are present on MCEs, while high-lighting the variation which can be ascribed to the study location and focus taxon. If species present below 30 m are protected from impact, then the higher the propor-tion of overlap the more effectively the conservapropor-tion and management of MCEs will protect shallow water species. We collate the research field [29], depositing a bibliogra-phy of all identified MCE research online (www.mesop hotic .org) to ensure wide and easy accessibility for future studies.
Stakeholder engagement
Invited discussion with our advisory committee gener-ated our research question [29], which aims to quantify shallow water taxa present on MCEs that may contrib-ute to refuge dynamics. The need for this information, and the raising of awareness in management circles, was expressed in a recent United Nations Environment Pro-gramme report [13]. The stakeholders on our advisory committee are researchers active in the mesophotic filed, from a geographical spread of universities and research institutions. Committee members are listed as authors following further involvement in generating the screen-ing criteria, assistscreen-ing with full-text retrieval, and com-menting on this manuscript.
Objective of the review
Primary question
To what extent do mesophotic coral ecosystems and shal-low reefs share species of conservation interest?
This can be broken into the following structure:
Subject
(Population) Exposure Comparator Outcome
Tropical and subtropical coral reefs (an ecosystem of conservation concern)
Reefs deeper
than 30 m Reefs shallower than 30 m Species presence or absence
Secondary questions consider effect modifiers:
Does the extent of community overlap vary by region or between broad taxonomic groups?
Methods
review following the reporting standards for systematic evidence syntheses in environmental research (ROSES) [31].
Deviations from the protocol
JSTOR (all years) was not searched as a database, despite being detailed in our protocol. This was because an information request was declined as a result of the high volume of enquiries. Journal articles were still retrieved from JSTOR through a Google Scholar search.
Articles were categorised by type as part of a support-ing narrative synthesis. We generated a word cloud based on term frequencies from included titles and abstracts, in consultation with the advisory committee. The five, objectively derived, tags were: ecology, disturbance, trophic interactions, symbionts, and reproduction. Tags were assigned manually while screening on outcome at abstract level. Our full text screening for the primary review question, and quantitative synthesis, use studies tagged as ecology.
Method of data collection was not extracted, despite being identified in the protocol paper [29], as many arti-cles used a mixture of different survey methods for shal-low and deep sampling. AIC are not compared between models fitted to the full dataset and the high validity sub-group as the metric is affected by sample size.
Search strategy
We use two search strings to balance capturing relevant literature against articles captured after name changes in the field over time, as detailed in our protocol [29]. “Mesophotic” from 01/01/2010 to 31/12/2016, and “Mesophotic OR “Deep reef” OR ((Submersibl* OR Sub-marine* OR “Deep water” OR Trimix) AND (biolog* OR Reef* OR Cora* OR Spong* OR Alga* OR Fish*))” from the start of the source to 31/12/2009. The scoping exer-cise and search string development are reported in the protocol paper. The final search strings were successful in retrieving 87% of our test library.
We conducted our literature search in ISI Web of Sci-ence, Science Direct, Proquest, AGRICOLA and Sco-pus in English, with a full list of databases presented in our protocol [29]. We downloaded all bibliographic data from mesophotic.org at the end of 2016 and used Google Scholar for a complimentary search, capable of capturing grey literature [32]. The Google Scholar search was con-ducted using web-scraping software in R [33]. A detailed methodology can be found in Additional file 1, based on work by Haddaway et al. [34], retrieving up to the first 1000 entries. Following our literature search the personal libraries (Private collection of manuscripts) of authors and advisory committee members were checked for missed publications. Additional publications were also
provided by the reviewers of this manuscript. Literature searches were conducted in the period from 19/04/2015 to 28/02/2017.
Article screening and study inclusion criteria
Before screening based on exclusion criteria occurred in the software EPPI Reviewer 4 [35], duplicate entries resulting from the use of multiple databases were removed. We set EPPI Reviewer to automatically mark as duplicates full bibliographic entries with 95% similar-ity. This level of similarity generally corresponded to the identical entries with differing capitalisation, or entries with one database field left blank in comparison to the master entry. Other possible duplicates were checked manually. When retrieving full-text articles for detailed screening not all were readily available. The lead author was contacted for any manuscripts the screening team could not find available online. A final list of full texts not retrieved after two attempts at contact with the authors was circulated to the advisory committee. If full texts were not present in personal libraries after these checks the articles were excluded. The screening was conducted by authors who had no publications in the list screened, preventing bias in the inclusion of data.
The original screening and validity appraisal criteria were reviewed to reconcile disagreements during Kappa analysis, at each level of screening, between the two reviewers. 1000 articles were coded by both reviewers at title and abstract level, 50 full texts were coded by both reviewers. Any differently assigned articles were dis-cussed. The final criteria were as follows:
Title and abstract criteria:
1. Relevant subject: Extant Tropical and Subtropical coral reefs (exclude Mediterranean and palaeobio-logical studies).
2. Relevant exposure: Sampling at depths greater than 30 m.
3. Relevant outcome: Ecological data such as richness, biodiversity, species lists and abundance. (Other study types were tallied for discussion of the broader field, but omitted from the primary review question).
Full text criteria:
1. Relevant subject: Mention of reefs containing pho-tosynthetic stony (scleractinian) corals (exclude non-biology studies i.e. geology).
2. Relevant study design: Observational or experimen-tal.
4. Relevant comparator: Ecological data from shallow reefs above 30 m.
5. Relevant outcome: Any of the following data are reported: taxon richness, taxon abundance, taxon biomass and biodiversity indices along with a meas-ure of variability and number of replicates.
Critical appraisal
External validity considers the generalisability, and the fairness of comparison between different stud-ies. Internal validity considers the risk of bias within a specific study. A number of methods exist to critically assess these concepts, but most are developed with ran-domised control trials in mind, or at least observational studies with a level of randomisation in allocation and blinding rarely found outside of the medical sciences [36].
We have no reason to believe the observation of a species depth range from one article is any more important than that from another [29]. By including geographical area and taxon as effect modifiers, we have controlled for the primary confounding sources of variability when comparing studies. We therefore consider the spatial scales of different studies are the primary remaining threat to external validity. A key based on a whole ocean region is likely to find a greater depth range for a given species than a study at a specific location, because the key is likely based on data from a broader range of abiotic conditions.
With respect to internal validity, our primary con-cern with mesophotic research is that sampling effort may decline with increasing depth. This can lead to an underestimate of the number of species present deeper than 30 m as rarer species are found in shallow water, but are missed at depth. Similarly, studies report-ing only a small number of species may provide a less reliable estimate of community level overlap. This is because the importance of a single species depth range is elevated, when community overlap is calculated as a proportion. Our critical appraisal is therefore based on the following criteria:
Validity appraisal criteria:
1. More than 10 species are identified within a taxon. 2. The study is not a regional taxonomic key.
3. Even sampling effort is reported across depths.
Studies passing all these criteria were included in a high validity sub-group for sensitivity analysis. We choose to limit our high validity group to studies with more than ten species to avoid undue influence of single species over community level overlap values.
Data extraction
Maximum and minimum depths for each species reported in an article were extracted manually. A subset of 12 articles were checked for consistency of data extrac-tion by a second reviewer. Discussion of these extracextrac-tions produced the following clarifications. Depth ranges for adults and juveniles of a species were combined into a single depth range. For the purposes of defining multiple studies within an article, locations were considered differ-ent when across multiple countries, when provided. Aus-tralia and the USA were exceptions because of their size, here we took into account the seas around Australia, and the islands/coastlines sampled of the USA. The review was conducted by authors who had no publications in the list screened at full text, preventing bias in the inclu-sion of data. Data were restricted to species occurring on tropical and sub-tropical reefs when multiple habitats were studied in a single article, such as mangroves and reefs. If these data were not available, the correspond-ing author was contacted. Contact was attempted twice before asking members of the advisory committee to try a third time with any researchers they knew personally. Failure to respond to these contact attempts led to exclu-sion of the data set from the analysis (Additional file 2). A list of all articles contributing data to the final meta-analysis can be found in Additional file 2 [37–68], a list of the studies resulting from these articles can be found in Additional file 3.
Potential effect modifiers/reasons for heterogeneity
The location and broad taxonomic group were extracted from articles as effect modifiers, following consultation with the advisory committee [29], as different regions may have different transition depths and taxa may respond differently to depth.
Data synthesis
After reviewing the retrieved articles, a meta-analysis for the primary review question was deemed appro-priate. The list of observed depth ranges was limited to species observed shallower than 30 m. Of these species, the proportion also present deeper than 30 m was calcu-lated, grouped by article, site, and taxon. Log odds ratios were calculated in R [69] in the package metafoR [70] and passed to a mixed-effects model. A maximum-like-lihood estimator with Knapp and Hartung adjustments [71] was used with location and taxon as effect modifiers. Likelihood-ratio tests assessed the statistical significance of model elements and determined whether to retain an interaction term.
used to identify potential outliers [72], and a regression test for asymmetry assessed the chance of publication bias affecting the dataset [72]. As a sensitivity analysis, Rosenthal’s fail-safe number [73] was calculated for the model to determine how many studies, averaging to null results, are required to lose statistical significance. To check sensitivity further, the analysis was repeated on a subset of high validity studies and the effects compared to a full model.
The broader research field was summarised using the bibliographic data from papers retained at full text level. Articles by year, categorisation, geographical area, and the mesophotic depth limit used were counted and plotted.
Results
Review descriptive statistics
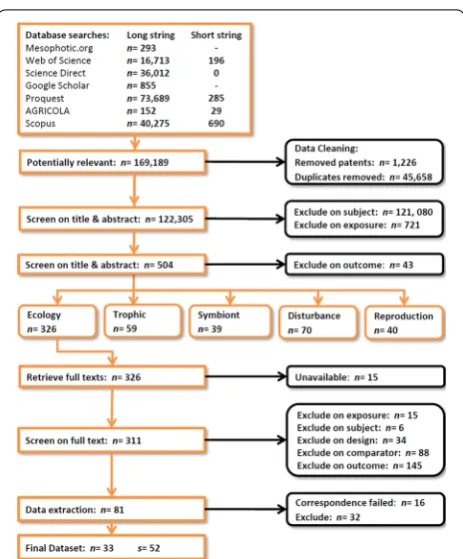
Our methods retrieved almost 170,000 articles, with 3011 screened at full text (Fig. 1). Kappa analysis was used for consistency checking and refining of the inclu-sion criteria by two reviewers for 1000/122,305 at title and abstract level and 50/311 at full text level. A list of all ecology articles screened at full text level, with decisions, can be found in Additional file 4. The following summary and figures of the systematic review, as opposed to the meta-analysis, are created from the data extracted from all articles; not excluded on outcome at the abstract level and verified as mesophotic at full text level. This brief dis-cussion provides context of the wider field of mesophotic research, before we address the primary review question with a meta-analysis. The bibliographic data for these 461 articles were deposited with mesophotic.org.
There was a notable acceleration in the number of articles per year as we entered the twenty first century (Fig. 2a). Publication levels were relatively stable dur-ing the twentieth century with only 1 year yielddur-ing more than 10 papers. The earliest article we identified was from 1960.
After more than half a century of research, the meso-photic field is still largely descriptive and focussed on pattern. This is supported by the majority of studies being assigned an ecology tag during our screening process (Fig. 2b). The next most common tag was assigned six times less frequently and indicates articles considering disturbance or damage on mesophotic reefs. Other com-mon MCE study types refer to trophic interactions, sym-bioses, and reproduction.
This exercise was used as an opportunity to see how researchers define mesophotic reefs. 27% of articles include a depth limit in their introductions. The over-whelming majority of papers providing a definition state MCEs start at 30 m depth (89%), however, some papers
exist claiming the upper bound is 20 m or even as deep as 60 m.
Mesophotic reefs in the western Atlantic, Caribbean, and Gulf of Mexico, are the focus of most published studies, followed by those on archipelagos in the Pacific (Fig. 2d). Australian reefs represent another hot spot of activity, but are nonetheless not as well studied. The Red Sea has provided a relatively large number of articles for its area, while the Indian Ocean has been comparatively understudied.
Data‑synthesis
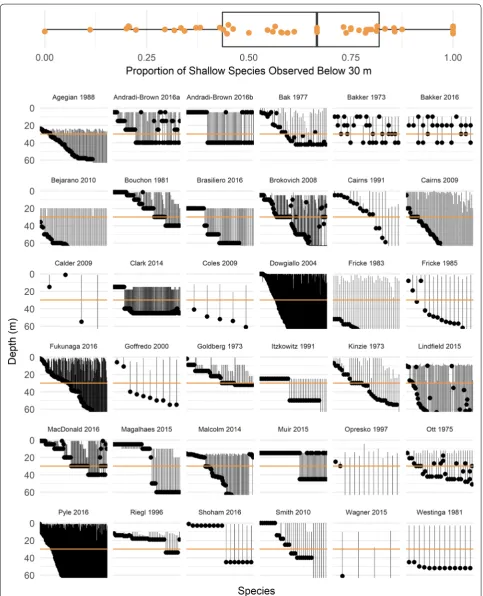
Across the whole dataset, the median proportion of shal-low species also present beshal-low 30 m is 0.67. The meta-analysis was performed on articles assigned as Eco at abstract level screening, and subsequently passed full-text level screening, as well as two further publications provided as titles at the review stage. Of these 81 + 2
[image:5.595.306.538.84.364.2]articles (Fig. 1), data were successfully extracted from 35, yielding 52 studies (combinations of broad taxon and locations within articles) after contacting correspond-ing authors (Additional files 2). The consistency of data extraction was checked by a second reviewer for 12/35 articles included. The data can be found in Additional file 3. Ecology papers we could not source a full text for are listed in (Additional file 5).
Both location and taxon were included as effect modi-fiers to aid biological interpretation and reduce the variance assigned to between study heterogeneity (I2 of
10.1% reallocated). An interaction term was not included as intended in our protocol. This decision was made as studies were not evenly distributed across all factor-level combinations (Additional file 6) and a likelihood-ratio test failed to distinguish the two models (χ2= 10.8,
P= 0.14). A Q-test detected significant between-study heterogeneity (QE= 182.2, df= 27, P < 0.0001). An I2 of 72.3% can be interpreted as “substantial” under Cochrane review guidelines [74], but does increase with study number [75] and may be less important for an ecologi-cal synthesis. The R2 of our model is 75.9%. A forest plot
[image:6.595.59.539.86.498.2]of effect size contributions from individual studies can be found in Additional file 7.
Figure 4 visualises the proportion of shallow species present deeper than 30 m, predicted from the model, for each modifier level. The central Pacific has the high-est community overlap between shallow and mesophotic reefs at 72% (95% CI 53–85%). Studies off the cost of Brazil report the lowest at 30% (7–72%) when ignoring areas represented by a single study. For taxa, models of algal groups all returned predictions of over 75% overlap. 86% (37–98%) of shallow-water Antipatharia were found on mesophotic reefs, while octocorals were predicted to have the lowest overlap of all factor levels at 38% (15– 68%). The amount of studies retrieved for a given factor level does influence the width of the confidence interval. Scleractinia with 18 studies has a prediction ranging by 29%, whereas Octocorallia with three studies ranges by 53%. Data underlying the figure can be found in Addi-tional file 8.
As part of the sensitivity analysis 22 studies were excluded from the high validity group, following our validity appraisal criteria. The analysis was then re-run to quantify the influence of these studies over our synthe-sis (Fig. 4). These studies are indicated in the comments column of Additional file 2. The dataset-wide estimate of community overlap dropped by 10 percentage points to 0.57. No change in broad pattern is noted, only a slight increase in the range of predictions, and a slight decrease in estimated overlap. We would generally expect a high validity sub-group analysis to narrow the prediction intervals. Our results suggest that the overriding influ-ence may be the reduction in sample size, and that stud-ies outside of the high validity group are largely similar to those retained. This is despite low validity studies operat-ing at larger spatial scales and with unbalanced samploperat-ing effort with depth. A regression test provides no evidence for publication bias in the dataset (t= 0.5382, df= 33,
P= 0.594), also visualised with a funnel plot (Additional file 9). This is further supported by a Rosenthal’s fail safe number [73] of 1612 studies, it is highly unlikely this many mesophotic surveys remain unpublished given the number we retrieved.
Discussion
Quantitative results
Two-thirds of shallow-water species can be found on MCEs (Fig. 3). This suggests MCEs should potentially be considered as a significant conservation target when protecting shallow reefs. This observation is in broad agreement with expert opinion regarding the Caribbean; suggesting over 40% similarity for shallow and meso-photic benthic taxa and approximately 60% for fish [8].
Semmler et al. [8] use Jaccard similarity and will therefore estimate lower similarity than this study. Jaccard similar-ity returns a lower score for reefs with mesophotic-spe-cialist taxa while in this study community overlap was calculated excluding species not observed on shallow reefs.
As individual studies would lead us to expect, com-munity overlap varies by region (Fig. 4, Additional file 8). The highest proportion of shallow species present on mesophotic reefs was predicted for the central Pacific at 72% (95% CI 53–85%). Brazilian reefs and the Coral Sea with the Great Barrier Reef both harbour less than half of shallow reef taxa on MCEs at 31% (7–72%) and 41% (20–65%) respectively. A number of drivers may explain these patterns but there are two likely candidates.
Reefs located in biodiversity hot spots, such as the Coral Triangle and Red Sea [76], may experience greater competition and subsequent specialisation [77]. This may lead to narrower depth ranges and so less commu-nity overlap in comparison to species-poor regions such as the Caribbean and Hawai’i. Additionally, the bounda-ries between mesophotic communities and shallow reef communities may vary between sites [22]. This is likely underpinned by abiotic factors interacting with species physiology. The current use of an arbitrary 30 m depth limit, derived from recreational SCUBA limitations, may be limiting our ability to accurately report on ecological pattern. If the transition depth occurs deeper, a larger portion of shallow water species will be present below 30 m. The deviation in community transition depth from 30 m between sites may explain some of the variability in our estimates of community overlap. The maximum depth limits of photosynthetic corals are known to vary by region [78] and with light [2] and loosely correlate with our findings.
than 30 m it is likely a deep species encroaching on shal-low reefs. Alternatively, a small number of species may have evolved towards shallow-water emergence. The smaller number of species contributing to estimates for taxa other than fish and Scleractinia highlights the need for taxonomic diversity in future mesophotic studies. It is also important to maintain shallow sampling for contem-porary comparisons to allow for site to site variation.
Our finding of over half of shallow taxa being recorded on MCEs is not in direct contention with research sug-gesting mesophotic-specific communities on MCEs [8,
22, 32, 80–82]. Firstly, we deliberately exclude taxa only observed on mesophotic reefs from our analysis. This is as MCEs may extend below 150 m [2] while the major-ity of the studies synthesised here do not sample as deep. Any estimate of the proportion of mesophotic taxa not on shallow reefs would likely be misleading because of an absence of evidence (Additional file 10). Additionally, the lower limit of MCEs is acknowledged to be variable [21,
24]. Further analyses considering overlap at the lowest limit of MCEs would therefore be inappropriate because of a similar lack of sampling. Our primary research ques-tion considers the potential for shallow water species to exploit deep reef refuges.
Secondly, we consider MCEs in a narrow sense as a 30 m depth limit. As depth increases the ratio of shallow
taxa to mesophotic-specialists declines (Additional file 10) [8]. When sampling is evenly distributed across the whole depth range of an MCE it is possible to detect depth-specific community structure [22] and high levels of geographically endemic biodiversity [20]; though this likely varies between locations [22]. It is important to note consensus in the field is to recognise an upper mes-ophotic zone, in which shallow species are gradually lost with depth, and a lower mesophotic zone containing spe-cialist communities [21, 25], rather than rigidly following the 30 m boundary. Any conclusions regarding shallow taxon occurrence deeper than 30 m is therefore likely driven by pattern in the upper mesophotic. We are reti-cent to perpetuate the definition of these zones by arbi-trary depth limits because of the potential for between site variation [22].
Qualitative analysis
At the outset of this project www.mesop hotic .org rep-resented the largest publicly available compilation of mesophotic literature, with the metadata of 293 articles available. This study succeeded in boosting this num-ber to at least 461, considerably increasing the visibility of research. Absent from this list of papers are any pub-lished in 2017 or later. The new database offered the
[image:9.595.58.538.88.327.2]opportunity to categorise these studies, describing the field as a whole.
Past reviews have noted the geographical bias of mes-ophotic research [2, 12, 78]. This is to some extent una-voidable because of the locations of research groups in developed countries near accessible reefs (i.e., Hawai’i, US Virgin Islands, and Israel among others). We confirm the bias towards studies in the central Pacific and western Atlantic region. A better global understanding of MCEs requires increased research attention in the Coral Tri-angle and the wider Indian Ocean to the west. Currently MCE research attention focuses on reefs with lower coral species richness [76]. Though this may be convenient for a number of reasons, it may mean ecological differences between shallow and mesophotic reefs resulting from greater competition and niche diversification are missed.
In addition to geographic biases, the mesophotic field lacks diversity in terms of study types. As expected for a field which has only recently taken off (Fig. 2a), a large proportion of the studies focus on ecological description. This has already been noted across existing research and narrative reviews [12] but we lend support to the obser-vation with a larger literature base. This pattern has been shifting over time [12], but there is certainly room for an increase in experimental, modelling, and longitudinal studies considering processes instead of pattern.
A final interesting observation is that the term “meso-photic” has been defined differently across published work. Though the overwhelming majority of papers define mesophotic reefs as starting at 30 m, the meso-photic research strategy more loosely states they can start from 30 to 40 m [1]. This 30 m limit is rooted in recreational dive limits, rather than biological bounda-ries which can vary [22]. Not surprisingly the next most common definition is for mesophotic communities start-ing at 40 m. More intereststart-ingly, six papers within the last 10 years define MCEs from 50 m with another one at 20 m and one at 60 m. As the number of papers on meso-photic reefs increases it is important to remain consist-ent in the application of terminology, or specify explicitly how these boundaries may be recognised to vary.
Reasons for heterogeneity
Our analysis returns an I2 of 72.3%, under Cochrane
review guidelines this can be interpreted as ‘substan-tial’ unexplained heterogeneity [74]. However, Cochrane review guidelines were developed by the health sec-tor, and so largely with the synthesis of controlled clini-cal trials in mind. In ecologiclini-cal studies higher degrees of residual variation are often expected, as a result of the messiness of the ‘real’ world and confounding variables arising outside of an experimental framework.
As already mentioned, if the 30 m boundary of shallow and mesophotic systems is not shared across all studies the estimates of community overlap could be impacted. A community transition at 20 m would result in few shal-low species deeper than 30, similarly in areas of high light penetration mesophotic communities may begin deeper [24], inflating the proportion of shallow water species occurring deeper than 30 m. If this is the cause of our high between study heterogeneity, then this study may suggest the 30 m depth boundary can be mislead-ing. Our analysis could be improved by including abiotic data believed to affect the rates of community transition for each study, such as light attenuation coefficients and topography [83]. These data are not available for the syn-thesised studies, and new research should ensure envi-ronmental data is collected alongside ecological surveys.
Review limitations
We hoped to incorporate abundance into a meta-analy-sis of communities [29, 84, 85], yet this approach would sharply reduce the amount of included studies because of differing measures of abundance, as well as prevent-ing the incorporation of sessile and motile taxa into one analysis. Adopting a presence-absence approach does, however, miss the importance of population density. Our analysis could have been influenced by population over-spill where a few out-lying individuals from an otherwise shallow species were observed deeper than 30 m (Bon-gaerts, under review). The refuge dynamics which may occur on MCEs must be underpinned by reproductively active source populations, rather than the sinks repre-sented by outlier observations as hypothesised in deep-sea ecosystems [86]. Though such outliers are unlikely to represent source populations for a deep reef refuge, they may none-the-less protect genetic diversity [17].
Additionally, our interpretation of the impacts of effect modifiers should be taken with caution. Confidence intervals are wide because of a lack of studies across most taxonomic groups, only fish and Scleractinia predictions are based on more than five studies (Additional file 8).
Conclusion
Information for policy/management
biodiversity may deserve protection in its own right, something our analysis is unable to inform.
Implications for research
The degree of overlap varies by region and taxon, how-ever, so too does research effort and the information available to us. We recommend that in the years to come researchers conduct survey work of lesser studied, but ecologically important, taxa and also attempt to visit MCEs as yet unstudied. This extra knowledge will aid conservation prioritisation efforts and allow us to iden-tify deeper coral reef regions currently unknown to con-servation managers.
Abbreviation
MCE: mesophotic coral ecosystems.
Authors’ contributions
In addition to the contributions to the project detailed in our protocol paper, JHL conducted the literature search. JHL and SP carried out the screening of all articles, extracted, and formatted the data. JHL and SP retrieved full texts and underlying data with help from the advisory committee (DAAB, DAE, PB, TCLB, MPL, RLP, MS and DW). JHL performed the statistical analysis and wrote the initial draft. ADR supervised the project and edited the manuscript. The advisory committee and SP also commented on the manuscript. All authors read and approved the final manuscript.
Author details
1 Department of Zoology, University of Oxford, The Tinbergen Building, South Parks Road, Oxford OX1 3PS, UK. 2 Operation Wallacea, Old Bolingbroke, Spilsby, Lincolnshire PE23 4EX, UK. 3 Biology Department, Marine Biology Research Group, Campus Sterre, S8, Krijgslaan 281, 9000 Ghent, Belgium. 4 Global Change Institute, The University of Queensland, St Lucia, QLD 4072, Australia. 5 Australian Research Council Centre of Excellence for Coral Reef Studies, James Cook University, 101 Angus Smith Drive, Townsville, QLD 4811, Australia. 6 Queensland Museum Network, 70‑102 Flinders St, Townsville, QLD 4810, Australia. 7 School of Marine Science and Ocean Engineering, University of New Hampshire, Durham, NH 03824, USA. 8 Bernice P. Bishop Museum, 1525 Bernice St, Honolulu, HI 96817, USA. 9 Department of BioMolecular Sciences, University of Mississippi, Oxford, USA. 10 JHT Inc, NOAA National Centers for Coastal Ocean Science, 219 Fort Johnson Rd, Charleston, SC 29412, USA. 11 Present Address: Oceans Conservation, World Wildlife Fund‑US, 1250 24th St. NW, Washington, DC 20037, USA.
Acknowledgements
We would like to thank all of the authors who supplied us with PDF copies of their manuscripts and underlying data when requested. We also would like to thank our editor and anonymous reviewers, who greatly helped improve the transparency of this manuscript.
Competing interests
The authors declare that they have no competing interests.
Availability of data and materials
All data can be found in supporting information.
Consent for publication
All authors read and approved the final manuscript.
Ethics approval and consent to participate
Not applicable.
Funding
The project has been funded by NERC (NE/L002612). DAAB was funded by a Fisheries Society of the British Isles PhD Studentship.
Additional files
Additional file 1. Google Scholar Web‑Scraping. The following outlines the process used to extract search results from Google Scholar. The lack of a ‘download results’ feature on Google Scholar results pages makes the generation of a workflow necessary. This was pieced together from a number of online help files, papers, and conversations, referred to when available. We are grateful to the multiple sources of help.
Additional file 2. Data extraction report. All articles included in the final meta‑analysis are reported. We also report all articles identified during full text screening as containing data of interest. The comments column provides explanations for articles which did not contribute data for the final meta‑analysis, studies which were assigned to the low validity group, as well as whether the authors were contacted.
Additional file 3. Datafile. Data extracted and summarised for fitting of a meta‑analytic model.
Additional file 4. Full text report. All studies with full texts retrieved and identified during the screening process as ecological are listed. Code details the screening decision for the entry based on full text screening. Additional file 5. Unavailable full texts report. List of articles screened at abstract level and assigned an eco tag, which we could not retrieve a full text for.
Additional file 6. Distribution of studies across factor levels. The number of studies included in the full meta‑analysis of 52 studies is reported for each combination of taxon and location. The total number of studies for a given factor level is in brackets after the level name. Many combinations are not represented, prompting the decision not to include an interaction term in the statistical analysis.
Additional file 7. Forest plot. The effect sizes of depth as log odds ratios of the total shallow species pool compared to shallow species present deeper than 30 m, of the 52 included studies are displayed. Studies are in the same order as in Additional file 3. Dots indicate the effect size estimate and are scaled to the number of species observed within each study. The black lines extend from the lower to upper 95% confidence limit of each study estimate. Orange lines are for reference to help interpreta‑ tion. The dashed line at 0 indicates the effect size of studies finding 50% community overlap. The solid lines indicate the effect size of the largest study reporting 0% overlap (negative effect size) and 100% (positive effect size). Note that due to the scaling of effect sizes the confidence intervals become asymmetrical when back transformed to proportions (Fig. 4). Additional file 8. Factor level effects. Predictions of community overlap between shallow and mesophotic reefs by taxon and location, as visualised in Fig. 4. Values are reported as per computer output and in descending order of estimate. The number of studies for each factor level contributing to the model is provided. Reference level indicates which factor level was held constant as the factor of interest was changed. The use of different reference levels should not affect the analysis in the absence of an interaction term in the model.
Additional file 9. Funnel plot. Funnel plot for the full meta‑analysis. Dotted lines indicate the 95% confidence limit for expected deviation of study estimates from the model. Studies falling outside the triangle are potential outliers. With 52 studies we would expect fewer than 3. A lack of asymmetry to the plot provides no evidence of publication bias within the collected dataset.
Publisher’s Note
Springer Nature remains neutral with regard to jurisdictional claims in pub‑ lished maps and institutional affiliations.
Received: 15 January 2018 Accepted: 30 May 2018
References
1. Puglise KA, Hinderstein LM, Marr JCA, Dowgiallo MJ, Martinez FA. 2009. Mesophotic coral ecosystems research strategy: international workshop to prioritize research and management needs for mesophotic coral ecosystems, Jupiter, Florida, 12–15 July 2008. Silver Spring, MD: NOAA National Centers for Coastal Ocean Science, Center for Sponsored Coastal Ocean Research, and Office of Ocean Exploration and Research, NOAA Undersea Research Program. NOAA Technical Memorandum NOS NCCOS 98 and OAR OER 2. p. 24
2. Kahng SE, Garcia‑Sais JR, Spalding HL, Brokovich E, Wagner D, Weil E, et al. Community ecology of mesophotic coral reef ecosystems. Coral Reefs. 2010;29:255–75. https ://doi.org/10.1007/s0033 8‑010‑0593‑6.
3. Menza C, Kendall M, Hile S. The deeper we go the less we know. Rev Biol Trop. 2008;56:11–24.
4. Pyle RL. Ocean pulse: a critical diagnosis. In: Tanacredi JT, Loret J, editors. Boston, MA: Springer US; 1998. p. 71–88. https ://doi. org/10.1007/978‑1‑4899‑0136‑1_9.
5. Harris PT, Bridge TCL, Beaman RJ, Webster JM, Nichol SL, Brooke BP. Submerged banks in the Great Barrier Reef, Australia, greatly increase available coral reef habitat. ICES J Mar Sci. 2012;69:343–5.
6. Lindfield SJ, Harvey ES, Halford AR, McIlwain JL. Mesophotic depths as refuge areas for fishery‑targeted species on coral reefs. Coral Reefs. 2015;35:1–13.
7. Bridge TCL, Hoey AS, Campbell SJ, Muttaqin E, Rudi E, Fadli N, et al. Depth‑dependent mortality of reef corals following a severe bleach‑ ing event: implications for thermal refuges and population recovery. F1000Research. 2013; February. https ://doi.org/10.12688 /f1000 resea rch.2‑ 187.v1.
8. Semmler RF, Hoot WC, Reaka ML. Are mesophotic coral ecosystems dis‑ tinct communities and can they serve as refugia for shallow reefs? Coral Reefs. 2016. https ://doi.org/10.1007/s0033 8‑016‑1530‑0.
9. Glynn PW. Coral reef bleaching: facts, hypotheses and implications. Glob Chang Biol. 1996;2:495–509. https ://doi.org/10.1111/j.1365‑2486.1996. tb000 63.x.
10. Holstein DM, Paris CB, Vaz AC, Smith TB. Modeling vertical coral connec‑ tivity and mesophotic refugia. Coral Reefs. 2015. https ://doi.org/10.1007/ s0033 8‑015‑1339‑2.
11. Holstein DM, Smith TB, Gyory J, Paris CB. Fertile fathoms : deep reproduc‑ tive refugia for threatened shallow corals. Nat Publ Gr. 2015. https ://doi. org/10.1038/srep1 2407.
12. Turner JA, Babcock RC, Hovey R, Kendrick GA. Deep thinking: a systematic review of mesophotic coral ecosystems. ICES J Mar Sci. 2017. https ://doi. org/10.1093/icesj ms/fsx08 5.
13. Baker EK, Puglise KA, Harris PT, editors. Mesophotic coral ecosystems — A lifeboat for coral reefs? The United Nations Environment Programme and GRID‑Arendal, Nairobi and Arendal, 2016, p. 98. ISBN: 978‑82‑7701‑150‑9. 14. Bridge TCL, Hughes TP, Guinotte JM, Bongaerts P. Call to protect all coral
reefs. Nat Clim Change. 2013;3:528–30. https ://doi.org/10.1038/nclim ate18 79.
15. Hughes TP, Kerry JT, Álvarez‑Noriega M, Álvarez‑Romero JG, Anderson KD, Baird AH, et al. Global warming and recurrent mass bleaching of corals. Nature. 2017;543:373–7. https ://doi.org/10.1038/natur e2170 7. 16. Sinniger F, Morita M, Harii S. “Locally extinct” coral species Seriatopora
hystrix found at upper mesophotic depths in Okinawa. Coral Reefs. 2012;32:153–153. https ://doi.org/10.1007/s0033 8‑012‑0973‑1. 17. Sinniger F, Prasetia R, Yorifuji M, Bongaerts P, Harii S. Seriatopora diversity
preserved in upper mesophotic coral ecosystems in southern Japan. Front Mar Sci. 2017;4:155. https ://doi.org/10.3389/fmars .2017.00155 . 18. Bongaerts P, Riginos C, Brunner R, Englebert N, Smith SR, Hoegh‑Guld‑
berg O. Deep reefs are not universal refuges: reseeding potential varies among coral species. Sci Adv. 2017;3:e1602373.
19. Hammerman NM, Rivera‑Vicens RE, Galaska MP, Weil E, Appledoorn RS, Alfaro M, et al. Population connectivity of the plating coral Agaricia lamarcki from Southwest Puerto Rico. Coral Reefs. 2017. https ://doi. org/10.1007/s0033 8‑017‑1646‑x.
20. Kosaki RK, Pyle RL, Leonard JC, Hauk BB, Whitton RK, Wagner D. 100% endemism in mesophotic reef fish assemblages at Kure Atoll, Hawaiian Islands. Mar Biodivers. 2017;47:783–4. https ://doi.org/10.1007/s1252 6‑016‑0510‑5.
21. Loya Y, Eyal G, Treibitz T, Lesser MP, Appeldoorn R. Theme section on mesophotic coral ecosystems: advances in knowledge and future per‑ spectives. Coral Reefs. 2016. https ://doi.org/10.1007/s0033 8‑016‑1410‑7. 22. Laverick JH, Andradi‑Brown DA, Rogers AD. Using light‑dependent scle‑ ractinia to define the upper boundary of mesophotic coral ecosystems on the reefs of Utila, Honduras. PLoS ONE. 2017. https ://doi.org/10.1371/ journ al.pone.01830 75.
23. NPA. New marine reserve in Israel to include mesophotic reef. 2009. http://www.mesop hotic .org/2009/11/new‑marin e‑reser ve‑in‑israe l‑to‑ inclu de‑mesop hotic ‑reef/. Accessed 12 Jan 2016.
24. Kahng SE, Copus JM, Wagner D. Recent advances in the ecology of meso‑ photic coral ecosystems (MCEs). Curr Opin Environ Sustain. 2014;7:72–81. https ://doi.org/10.1016/j.cosus t.2013.11.019.
25. Bongaerts P, Ridgway T, Sampayo EM, Hoegh‑Guldberg O. Assessing the ‘deep reef refugia’ hypothesis: focus on Caribbean reefs. Coral Reefs. 2010;29:309–27. https ://doi.org/10.1007/s0033 8‑009‑0581‑x.
26. Slattery M, Lesser MP, Brazeau D, Stokes MD, Leichter JJ. Connectivity and stability of mesophotic coral reefs. J Exp Mar Bio Ecol. 2011;408:32–41. https ://doi.org/10.1016/j.jembe .2011.07.024.
27. Olson JB, Kellogg CA. Microbial ecology of corals, sponges, and algae in mesophotic coral environments. FEMS Microbiol Ecol. 2010;73:17–30. https ://doi.org/10.1111/j.1574‑6941.2010.00862 .x.
28. Lesser MP, Slattery M, Leichter JJ. Ecology of mesophotic coral reefs. J Exp Mar Bio Ecol. 2009;375:1–8. https ://doi.org/10.1016/J.JEMBE .2009.05.009. 29. Laverick JH, Andradi‑Brown DA, Exton DA, Bongaerts P, Bridge TCL, Lesser
MP, et al. To what extent do mesophotic coral ecosystems and shallow reefs share species of conservation interest? Environ Evid. 2016;5:16. https ://doi.org/10.1186/s1375 0‑016‑0068‑5.
30. Schmidt LM, Gotzsche PC. Of mites and men: reference bias in narrative review articles: a systematic review. J Fam Pract. 2005;54:334–8. http:// www.ncbi.nlm.nih.gov/pubme d/15833 223. Accessed 27 Nov 2017. 31. Haddaway N, Macura B, Whaley P, Pullin A. ROSES for Systematic review
reports. 2017.
32. Haddaway NR, Collins AM, Coughlin D, Kirk S. The role of google scholar in evidence reviews and its applicability to grey literature searching. PLoS ONE. 2015;10:1–17. https ://doi.org/10.1371/journ al.pone.01382 37. 33. Wickham H, RStudio. rvest. 2016. version 0.3.2. https ://githu b.com/hadle
y/rvest .
34. Haddaway NR, Collins AM, Coughlin D, Kirk S. A rapid method to increase transparency and efficiency in web‑based searches. Environ Evid. 2017;6:1. https ://doi.org/10.1186/s1375 0‑016‑0079‑2.
35. Thomas J, Brunton J, Graziosi S. EPPI‑Reviewer 4: software for research synthesis. 2010.
36. Bilotta GS, Milner AM, Boyd IL. Quality assessment tools for evidence from environmental science. Environ Evid. 2014;3:14. https ://doi. org/10.1186/2047‑2382‑3‑14.
37. Agegian CR, Abbott IA. Deep water macroalgal communities: a compari‑ son between Penguin Bank (Hawaii) and Johnston Atoll. Proc fifth Int coral reef Congr. 1985;5:47–50.
38. Andradi‑Brown DA, Gress E, Wright G, Exton DA, Rogers AD. Reef Fish community biomass and trophic structure changes across shallow to upper‑mesophotic reefs in the Mesoamerican barrier reef, Caribbean. PLoS ONE. 2016;11:e0156641. https ://doi.org/10.1371/journ al.pone.01566 41.
39. Andradi‑Brown DA, Macaya‑Solis C, Exton DA, Gress E, Wright G, Rogers AD. Assessing caribbean shallow and mesophotic reef fish communities using Baited‑Remote Underwater Video (BRUV) and diver‑operated video (DOV) survey techniques. PLoS ONE. 2016;11:1–23.
40. Bak RPM. Coral reefs and their zonation in Netherlands Antilles. Stud Geol. 1977;4:3–16.
Curaçao and Bonaire: are there any winners? Front Mar Sci. 2016;3:247. https ://doi.org/10.3389/fmars .2016.00247 .
42. Bejarano I, Nemeth M, Appeldoorn RS. Use of Mixed‑gas Rebreathers to access fish assemblages in mesophotic coral ecosystems (MCE) off La Parguera shelf‑edge, Puerto Rico. Proceedings 63rd Gulf Caribbean Fish Inst. 2011:130–3.
43. Bouchon C. Quantitative study of the scleractinian coral communities of a fringing reef of Reunion Island (Indian Ocean). Mar Ecol Prog Ser. 1981;4:273–88. https ://doi.org/10.3354/meps0 04273 .
44. Brasileiro PS, Pereira‑Filho GH, Bahia RG, Abrantes DP, Guimarães SMPB, Moura RL, et al. Macroalgal composition and community structure of the largest rhodolith beds in the world. Mar Biodivers. 2015. https ://doi. org/10.1007/s1252 6‑015‑0378‑9.
45. Brokovich E, Einbinder S, Shashar N, Kiflawi M, Kark S. Descending to the twilight‑zone: changes in coral reef fish assemblages along a depth gradient down to 65 m. Mar Ecol Prog Ser. 2008;371:253–62.
46. Cairns SD. A revision of the ahermatypic Scleractinia of the Galapagos and Cocos Islands. Smithson Contrib Zool. 1991. https ://doi.org/10.5479/ si.00810 282.504.
47. Cairns SD, Jaap WC, Lang JC. Scleractinia (Cnidaria) of the Gulf of Mexico. In: Felder DL, Camp DK, editors. Gulf of Mexico origin, waters, and biota. Texas: A&M University Press; 2009. p. 333–47.
48. Calder DR, Cairns SD. Hydroids (Cnidaria:Hydrozoa) of the Gulf of Mexico. In: Felder DL, Camp DK, editors. Gulf of Mexico Origin, Waters, and Biota. Texas: A&M University Press; 2009. p. 381–94.
49. Clark R, Taylor JC, Buckel CA, Kracker LM, editor. Fish and benthic com‑ munities of the flower garden banks national marine sanctuary: science to support sanctuary management. Silver Spring, MD: NOAA Technical Memorandum NOS NCCOS 179; 2014. p. 317.
50. Coles R, McKenzie L, De’ath G, Roelofs A, Long WL. Spatial distribution of deepwater seagrass in the inter‑reef lagoon of the Great Barrier Reef World Heritage Area. Mar Ecol Prog Ser. 2009;392:57–68.
51. Dowgiallow MJ. Patterns in diversity and distribution of benthic molluscs along a depth gradient in the Bahamas. Berkeley: University of California; 2004.
52. Fricke HW, Schuhmacher H. The depth limits of Red Sea stony corals: an ecophysiological problem (a deep diving survey by submersible). Mar Ecol. 1983;4:163–94.
53. Fricke H, Meischner D. Depth limits of Bermudan scleractinian corals: Mar Biol. 1985;187:175–87.
54. Fukunaga A, Kosaki RK, Wagner D, Kane C. Structure of mesophotic reef fish assemblages in the Northwestern Hawaiian Islands. PLoS ONE. 2016;11:1–15.
55. Goffredo S, Chadwick‑Furman NE. Abundance and distribution of mush‑ room corals (Scleractinia: Fungiidae) on a coral reef at Eilat, northern Red Sea. Bull Mar Sci. 2000;66:241–54.
56. Goldberg WM. The ecology of the coral‑octocoral communities off the southeast Florida coast: geomorphology, species composition, and zona‑ tion. Bull Mar Sci. 1973;23:466–88.
57. Itzkowitz M, Haley M, Otis C, Evers D. A reconnaissance of the deeper Jamaican coral reef fish communities. Northeast Gulf Sci. 1991;12:25–34. 58. Kinzie RA. The zonation of West Indian gorgonians. Bull Mar Sci.
1973;23:93–155.
59. MacDonald C, Bridge TCL, Jones GP. Depth, bay position and habitat structure as determinants of coral reef fish distributions: are deep reefs a potential refuge? Mar Ecol Prog Ser. 2016;561:217–31.
60. Magalhães GM, Amado‑Filho GM, Rosa MR, de Moura RL, Brasileiro PS, de Moraes FC, et al. Changes in benthic communities along a 0–60 m depth gradient in the remote St. Peter and St. Paul Archipelago (Mid‑Atlantic Ridge, Brazil) abstract. Bull Mar Sci. 2015;44:1–2.
61. Malcolm HA, Jordan A, Smith SDA. Testing a depth‑based Habitat Clas‑ sification System against reef fish assemblage patterns in a subtropical marine park. Aquat Conserv Mar Freshw Ecosyst. 2011;21:173–85. 62. Opresko DM, Sánchez JA. Caribbean shallow‑water black corals (Cnidaria:
Anthozoa: Antipatharia). Caribb J Sci. 2005;41:492–507.
63. Ott B. Quantitative analysis of coral reefs, Barbados. W.I: McGill University; 1975.
64. Pyle RL, Boland R, Bolick H, Bowen BW, Bradley CJ, Kane C, et al. A com‑ prehensive investigation of mesophotic coral ecosystems in the Hawaiian Archipelago. PeerJ. 2016;4:e2475. https ://doi.org/10.7717/peerj .2475.
65. Riegl B, Riegl A. Studies on coral community structure and damage as a basis for zoning marine reserves. Biol Conserv. 1996;77:269–77. 66. Smith TB, Blondeau J, Nemeth RS, Pittman SJ, Calnan JM, Kadison E, et al.
Benthic structure and cryptic mortality in a Caribbean mesophotic coral reef bank system, the Hind Bank Marine Conservation District, U.S. Virgin Islands. Coral Reefs. 2010;29:289–308.
67. Wagner D. A taxonomic survey of the shallow‑water (<150 m) black corals (Cnidaria: Antipatharia) of the Hawaiian Islands. Front Mar Sci. 2015;2:24. https ://doi.org/10.3389/fmars .2015.00024 .
68. Westinga E, Hoetjes PC. The intrasponge fauna of Spheciospongia vesparia (Porifera, Demospongiae) at Curaçao and bonaire. Mar Biol. 1981;62:139–50.
69. Team R core. R: A language and environment for statistical computing. 2013. http://www.r‑proje ct.org/.
70. Viechtbauer W. Conducting meta‑analyses in R with the metafor package. J Stat Softw. 2010;36:1–48.
71. Knapp G, Hartung J. Improved tests for a random effects meta‑regres‑ sion with a single covariate. Stat Med. 2003;22:2693–710. https ://doi. org/10.1002/sim.1482.
72. Sterne JA, Egger M. Funnel plots for detecting bias in meta‑analysis: guidelines on choice of axis. J Clin Epidemiol. 2001;54:1046–55. http:// www.ncbi.nlm.nih.gov/pubme d/11576 817. Accessed 10 Oct 2017. 73. Rosenthal R. The “file drawer problem” and tolerance for null results.
Psychol Bull. 1979;86:638–41.
74. Higgins JP, Green S. Cochrane Handbook for Systematic Reviews of Interventions Cochrane Book Series The Cochrane Collaboration®. Wiley‑ Blackwell, commerce place, 350 main st, Malden 02148, MA USA; 2008. https ://dhost h.files .wordp ress.com/2011/12/cochr ane‑handb ook‑for‑ syste matic ‑revie ws‑of‑inter venti ons.pdf. Accessed 14 Nov 2017. 75. Rücker G, Schwarzer G, Carpenter JR, Schumacher M. Undue reliance
on I 2 in assessing heterogeneity may mislead. BMC Med Res Methodol. 2008;8:79. https ://doi.org/10.1186/1471‑2288‑8‑79.
76. Veron JEN. Corals of the world vols 1–3. Townsville: Australian Institute of Marine Sciences; 2000.
77. Knowlton N, Jackson JBC. New taxonomy and niche partitioning on coral reefs: jack of all trades or master of some? Trends Ecol Evol. 1994;9:7–9. https ://doi.org/10.1016/0169‑5347(94)90224 ‑0.
78. Baker E, Kimberly A. Puglise, Colin PL, Harris PT, Kahng SE, Rooney JJ, et al. What are mesophotic coral ecosystems? In: Baker EK, Puglise KA, Harris PT, editors. Mesophotic coral ecosystems — A lifeboat for coral reefs? The United Nations Environment Programme and GRID‑Arendal, Nairobi and Arendal, p. 98. ISBN: 978‑82‑7701‑150‑9.
79. Cairns SD. Deep Water Corals: an overview with special reference to diversity and distribution of deep water scleractininan corals. Bull Mar Sci. 2007;81:311–22.
80. Muir P, Wallace C, Bridge TCL, Bongaerts P. Diverse staghorn coral fauna on the mesophotic reefs of north‑east Australia. PLoS ONE. 2015;10:1–17. 81. Shoham E, Benayahu Y. Higher species richness of octocorals in the upper
mesophotic zone in Eilat (Gulf of Aqaba) compared to shallower reef zones. Coral Reefs. 2016;36:71–81.
82. Bejarano I, Appeldoorn RS, Nemeth M. Fishes associated with mesophotic coral ecosystems in La Parguera, Puerto Rico. Coral Reefs. 2014;33:313–28. 83. Costa B, Kendall MS, Parrish FA, Rooney J, Boland RC, Chow M, et al. Iden‑
tifying suitable locations for mesophotic hard corals offshore of Maui, Hawai’i. PLoS ONE. 2015;10:1–24.
84. Warwick RM, Clarke KR. Comparing the severity of disturbance: a metaanalysis of marine macrobenthic community data. Marine ecology progress series. 1993. http://resea rchre posit ory.murdo ch.edu.au/23326 /1/marin e_macro benth ic_commu nity_data.pdf. Accessed 12 Jun 2015. 85. Savage C, Field JG, Warwick RM. Comparative meta‑analysis of the impact
of offshore marine mining on macrobenthic communities versus organic pollution studies. Mar Ecol Prog Ser. 2001;221:265–75.
86. Rex MA, McClain CR, Johnson NA, Etter RJ, Allen JA, Bouchet P, et al. A source‑sink hypothesis for abyssal biodiversity. Am Nat. 2005;165:163–78. https ://doi.org/10.1086/42722 6.