MEASURING PREFERENCES FOR VISUAL-SPATIAL LEARNING
Athesis submitted by
Matt Capp, BEd MEd
For the award of
Doctor of Education
2016
Abstract
This dissertation is a report on the validation of an instrument, Visual-Spatial
Learning Questionnaire (VSLQ), developed to measure preferences for visual-spatial
learning in secondary school students. A reliable and valid comprehensive instrument for
measuring preferences for visual-spatial learning would allow secondary school teachers to
effectively cater for the individual learning needs of students with a preference for this
learning style. During Study 1 an Exploratory Factor Analysis (EFA) was conducted to
remove redundant items and identify the factors underlying the 70-item instrument. The EFA
was conducted on 2006 archival data collected using the VSLQ. As a result of the EFA, the
instrument was reduced from 70 items to 15. Reducing the number of items removed
extraneous underlying factors that did not measure preferences for visual-spatial learning and
made the questionnaire more useful for classroom teachers. Completing 70 items is a
significant time imposition for both students and teachers, and takes away a lot of time from a
lesson. A smaller number of items will allow the classroom teacher to quickly identify a
student’s learning preference and use pedagogical strategies that have been shown to be
successful with students who have a preference for visual-spatial learning. Four factors
emerged in analysis, each with acceptable internal consistency: organisation
(disorganisation), spatial awareness, object-visualisation, and spatial-visualisation. Six items
loaded onto the factor of organisation (disorganisation), five onto spatial awareness, two onto
object-visualisation, and two loaded onto spatial visualisation. The EFA also began the
process of providing evidence that the VSLQ has internal reliability and construct validity
During Study 2 a Confirmatory Factor Analysis (CFA) was conducted on the 15-item
version of the VSLQ. A re-examination of the eigenvalues, Scree plot and total variance
from Study 1 suggested that the 4 underlying factors should be merged to form 2 factors -
organisation (disorganisation) and spatial awareness. Object-visualisation, spatial awareness,
and spatial-visualisation have interrelated characteristics and were grouped together under the
heading of spatial awareness. The CFA further reduced the instrument to 8-items and
provided evidence of its internal consistency (NC = 2.64 [X2 = 52.98/ df = 20], p < .001,
RMSEA = 0.05, CFI = .91, TLI = .84, NFI = .86, IFI = .91). During Study 3, the results of the
revised 8-item version of the VSLQ were compared against the results of two other
instruments designed to measure visual-spatial learning and visual-spatial ability –
Silverman’s (2000) Visual-Spatial Identifier (VSI), and Newton and Bristoll’s (2009) Spatial
Ability Test (SAT). To date, Silverman’s (2000) VSI is the most widely used questionnaire
to identify visual-spatial learners (VSL). Correlations between the underlying factors on the
three instruments provided evidence of the convergent validity of the VSLQ.
The results of the three studies demonstrated that the revised 8-item version of the
VSLQ has both reliability, in the form of internal consistency, and construct validity. The
implications of a short and reliable instrument for measuring preferences for visual-spatial
learning will also be discussed. Unlike Silverman’s (2000) VSI, the revised 8-item version of
the VSLQ has demonstrated reliability and validity. As such, classroom teachers in
secondary schools who use the instrument can trust that a student identified as having a
preference for visual-spatial learning will most likely achieve success if visual-spatial
teaching methods are used within the classroom. The revised 8-item version of the VSLQ is
teachers. Rather than spending significant periods of time having students complete the
questionnaire and analysing the results, it allows classroom teachers to quickly identify the
learning preferences of their students and cater for their individual learning needs. By
identifying students’ individual learning needs, teachers can use teaching strategies that will
hopefully lead to educational success.
Keywords:
VSLQ, EFA, CFA, reliability, construct validity
Table of Contents
Abstract 2
Table of Contents 5
List of Abbreviations and Glossary of Terms 8
List of Tables 9
List of Figures 11
Certification of Thesis 12
Acknowledgments 13
Chapter 1: Introduction 14
Objective of Research Project 15
Dissertation Outline 16
Chapter 2: Theoretical Frameworks for Measuring Preferences 16
for Visual-Spatial Learning
Chapter 3: Study 1 16
Chapter 4: Study 2 16
Chapter 5: Study 3 17
Chapter 6: General Discussion 17
Chapter 2: Theoretical Frameworks for Measuring Preferences for 18
Visual-Spatial Learning
Preferences for Visual-Spatial Learning in the Educational Context 19
Characteristics of VSL 22
Learning styles 23
Organisational ability 24
Academic curriculum 24
ASD 26
GT students 30
Scientific Developments Associated with Visual-Spatial Ability 30
Psychological Developments Associated with Visual-Spatial Ability 33
Historical background 33
Theoretical underpinnings 34
Cognitive profiles 37
Mathematical ability 38
Presentation of visual-spatial ability 39
Spatial-Ability and auditory-sequential spectrum 41
Educational Developments Associated with Visual-Spatial Ability 43
Measuring Visual-Spatial Ability 45
Manipulation of geometric shapes 45
Verbally anchored measures 47
VSI 47
Development of the VSLQ 52
VSLQ 52
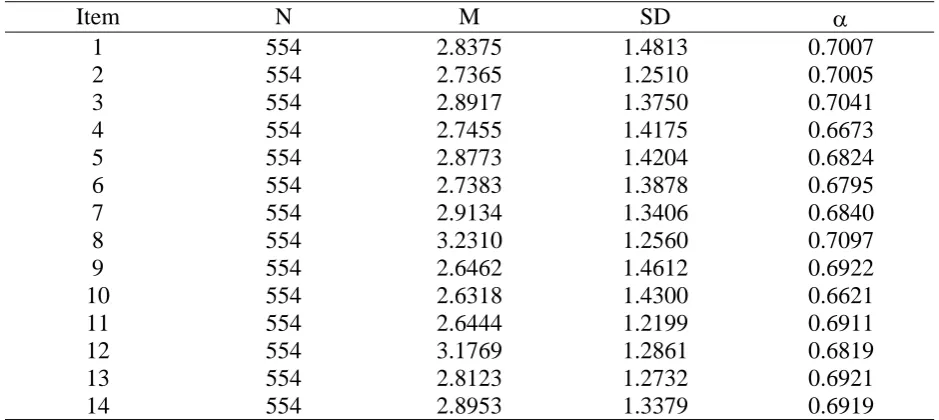
Chapter 3: Study 1 65
Method 76
Participants 76
Procedure 76
Results 98
Discussion 101
Chapter 4: Study 2 105
Participants 107
Procedure 107
Results 117
Discussion 118
Chapter 5: Study 3 122
Method 123
Participants 123
Measures 123
VSI 123
SAT 125
Data screening 126
Procedure 131
Discussion 134
Chapter 6: General Discussion 140
Summary of Findings 140
Implications 148
Limitations of Study 149
Directions for Future Research 151
References 155
Appendix A: Items on Newton and Bristoll’s (2009) SAT 208
Appendix B: Items on Capp’s (2006) VSLQ 211
List of Abbreviations and Glossary of Terms
Abbreviation/Symbol Definition
ASD Autism Spectrum Disorder
ASL Auditory-Sequential Learner
BTS Bartlett’s Test of Sphericity
CFA Confirmatory Factor Analysis
CFI Comparative fit index
df Degrees of Freedom
EFA Exploratory Factor Analysis
ES Effect Size
GT Gifted and Talented
IFI Incremental fit index
KMO Kaiser-Mayer-Olkin
n Number of cases
NC Normed chi square
NFI Normed fit index
OSIVQ Object-Spatial Imagery and Verbal Questionnaire
p Probability
PCA Principal Component Analysis
r Estimate of the Pearson product-moment correlation coefficient
RMSEA Root mean square error of approximation
SAT Spatial Ability Test
TLI Tucker Lewis index
VSI Visual-Spatial Identifier
VSL Visual-Spatial Identifier
VSLQ Visual-Spatial Learning Questionnaire
VVQ Visualizer-Verbalizer Questionnaire
List of Tables
Table 2.1. Items on VSLQ Related to Mathematical Thinking
Table 2.2. Items on Silverman’s (2000) VSI
Table 2.3. Reliability Analysis of Items on Silverman’s (2000) VSI
Table 2.4. Comparison of Items on Silverman’s (2000) VSI and VSLQ
Table 2.5. Relationship Between Characteristics of VSL and Items on VSLQ
Table 2.6. Items on VSLQ That Contradict the Characteristics of VSL
Table 2.7. Comparison of Items on Blazhenkova et al.’s (2006) OSIVQ and VSLQ
Table 2.8. Comparison of Items on Richardson’s (1977) VVQ and VSLQ
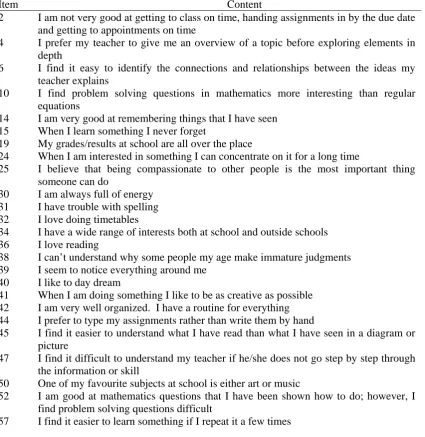
Table 3.1. Items Removed From VSLQ due to a Non-Normal Distribution, Kurtosis, and Skewness
Table 3.2. Items Removed From VSLQ for not Reflecting the key Characteristics of VSL
Table 3.3. Twenty Remaining Items on VSLQ
Table 3.4. Inter-Correlation Matrix of 20-Item Version of VSLQ
Table 3.5. Component Matrix of 20-Item Version of VSLQ
Table 3.6. Total Variance of 20-Item Version of VSLQ
Table 3.7. PCA of 17-Item Version of VSLQ
Table 3.8. Component Matrix of 17-Item Version of VSLQ
Table 3.9. Total Variance of 17-Item Version of VSLQ
Table 3.10. PCA of 15-Item Version of VSLQ
Table 3.11. Total Variance of 15-Item Version of VSLQ
Table 3.12. Underlying Factors on the 15-Item Version of VSLQ
Table 4.1. Fifteen Item Version of VSLQ
Table 4.2. Items Removed From the 15-Item Version of VSLQ
Table 4.3. Eight-Item Version of VSLQ
Table 5.2. Items on Silverman’s (2000) VSI Converted to Binary Code
Table 5.3. Items on 8-Item Version of VSLQ Converted to Binary Code
Table 5.4. Items on Newton and Bristoll’s (2009) SAT Converted to Binary Code
List of Figures
Figure 2.1. Object-Spatial-Verbal Cognitive Style Model (Kozhevnikov et al., 2005)
Figure 4.1. CFA With 8-Item and 2-Factor Version of VSLQ
Figure 6.1. Structural Validity of the 15-Item Version of the VSLQ
Certification of Thesis
I certify that the ideas, results, analyses, and conclusions reported in this thesis are
entirely my work, except where otherwise acknowledged. I also certify that the work is
original and has not been previously submitted for any other award, except where otherwise
acknowledged.
__________________________ 08/03/2016
Matt Capp Date
Endorsement
_______________________________ ____________
_______________________________ ____________
Acknowledgments
I thank my supervisor, Associate Professor Peter McIlveen, and associate supervisor,
Professor Lorelle Burton, for all of their support during the confirmation of candidature
process, data collection, data analysis, and writing of my dissertation.
I acknowledge the University of Southern Queensland for its technical support of this
research project. I also acknowledge Brisbane Catholic Education for allowing me to
conduct research in its schools.
I impose on too many people. First, Kastina Joy Capp should be acknowledged and
worshipped for her support during my doctoral studies. Many significant and stressful events
have occurred during my research. Despite moving into a new house, getting married, the
birth of our son, and the establishment of a small business, Kastina Joy has continued to be
one of my greatest supporters and advocates. I would also like to thank my family - Leita
Capp, Owen Capp, Aaron Capp, and Chantelle Capp - who have supported me during the
long process associated with my research. I would also like to thank my employers, Mt
Maria College and Brisbane Catholic Education School Services Centre South, for their
support.
Hopefully the psychometric instrument that I developed during this research project is
useful for classroom teachers when working with students who have a preference for
visual-spatial learning. Unfortunately the needs of many students with preferences for visual-visual-spatial
learning (e.g. students with autism spectrum disorder, and gifted and talented students) are
not catered for within the classroom context. By identifying the individual learning needs of
these students, teachers can use visual-spatial teaching and assessment strategies that research
Chapter 1: Introduction
It is rather surprising that systematic studies of human abilities were not
undertaken until the second half of the last century…An accurate method
was available for measuring the circumference of the earth 2000 years
before the first systematic measures of human ability were developed
(Nunnally, 1967).
The current study is a quantitative study based on psychometric principles and
specifically aims to validate a questionnaire developed to identify secondary school students
with a preference for visual-spatial learning. The aim of the current research project is to
develop a new psychometric instrument that measures preferences for visual-spatial learning,
the VSLQ.
This research project builds on instruments for measuring visual-spatial ability. Yet,
it diverges from them in terms of its practical purpose. Unlike current psychometric
instruments developed to measure visual-spatial ability, the VSLQ was constructed to
identify secondary school students who demonstrate a preference for learning through
visual-spatial methods. Success in both primary and secondary school generally occurs when there
is a correlation between the teaching strategies used by a classroom teacher and the learning
preferences of a student (Hattie, 2008). The current research project aims to demonstrate the
reliability and construct validity of the newly developed VSLQ. A pre-existing instrument
that measures preferences for visual-spatial learning lacks both reliability and validity, and
Objective of Research Project
Whilst there are a number of reliable and valid instruments for measuring
visual-spatial ability, a review of the literature has identified the lack of a psychometrically sound
instrument for measuring preferences for visual-spatial learning. For example, Silverman’s
(2000) VSI has questionable internal consistency, no published data on construct validity,
and a Likert scale that may bias the responses of participants. Although many
psychometrically sound instruments for measuring visual-spatial ability exist, the underlying
factors associated with visual-spatial learning are much broader than those associated with
visual-spatial ability. Visual-spatial ability is the ability to mentally manipulate
two-dimensional and three-two-dimensional figures (Weckbacher, 2007). It also involves “the ability
to mentally rotate or fold objects in two or three dimensions and to imagine the changing
configurations of objects that would result from such manipulations” (Mayer Simms, 1994,
p. 392). Visual-spatial learning, in contrast, is a preference for using images, pictures,
colours, and maps to organise and communicate ideas (Silverman, 2005). As such,
instruments for measuring visual-spatial ability are not reliable at identifying students who
have a preference for visual-spatial learning. The development of an instrument for
measuring preferences for visual-spatial learning in secondary school students will help
teachers to identify students who display these preferences within their classroom. Those
students who display visual-spatial preferences require individual teaching strategies to
promote educational success. This is supported by the claims of a number of researchers
(Griggs & Dunn, 1984; Smith & Renzulli, 1984; Charkins, O’Toole, & Wetzel, 1985) who
argue that the narrower the gap between teaching style and learning style the greater the
visual-spatial learning within their classrooms, secondary school teachers will be able to use
visual-spatial teaching strategies to ensure that they achieve educational success. This
research project aims to:
1. Develop a reliable and valid instrument for measuring preferences for
visual-spatial learning in secondary school students.
2. Compare the newly developed measure’s potential against a pre-existing
instrument and discuss the practical implications for the student learner.
Dissertation Outline
Chapter 2: Theoretical Frameworks for Measuring Preferences for
Visual-Spatial Learning. The second chapter explores the literature on measuring visual-spatial
ability and preferences for visual-spatial learning, and its application within the classroom
context. It outlines how developments in the fields of science, psychology, and education
have influenced the concept of the VSL. The differences between visual-spatial learning and
other styles of learning are examined. The arguments for developing an instrument for
measuring preferences for visual-spatial learning are proposed. Why an instrument needs to
demonstrate the psychometric principles of reliability and validity will also be discussed.
The limitations of the current psychometric instrument available for measuring preferences
for visual-spatial learning – Silverman’s (2000) VSI – will be examined.
Chapter 3: Study 1. The third chapter discusses the methodology and results of the
EFA on 125 completed VSLQs. During this study, archival data collected in 2006 was
re-examined.
Chapter 4: Study 2. The fourth chapter examines the methodology and results of the
Chapter 5: Study 3. The fifth chapter outlines the methodology and results when the
VSLQ (8-item version) was compared with Silverman’s (2000) VSI and Newton and
Bristoll’s (2009) SAT. A correlational analysis was conducted on the results of 300
completed VSLQs, VSIs, and SATs.
Chapter 6: General Discussion. The final chapter of the dissertation presents a
general discussion of the key findings in relation to the reliability and construct validity of the
revised 8-item version of the VSLQ. The practical and theoretical implications of this
instrument for measuring preferences for visual-spatial learning will also be discussed.
Chapter 2:
Theoretical Frameworks for Measuring Preferences for Visual-Spatial Learning
I think in pictures. Words are like a second language to me. I translate
both spoken and written words into full-colour movies, complete with
sound, which run like a DVD in my head. When somebody speaks to me,
the words are instantly translated into pictures (Grandin, 2006).
A review of the literature has identified the lack of a reliable and valid instrument for
measuring preferences for visual-spatial learning in secondary school students. Currently
there is only one instrument available – Silverman’s (2000) VSI – to measure visual-spatial
learning in the primary school student community. However, the reliability and validity of
this instrument is questionable. Silverman (2000) stated that α = .71, a measure of the
internal reliability of a psychometric instrument, was acceptable. However, this was
achieved by commingling data from parent, teacher, and student reports and no reliability
data for students alone was reported (Mann, 2005). Through a follow up study Mann (2005)
obtained α = .46, which indicates an unacceptable level of internal consistency. Silverman
(2000) also does not provide any evidence of the construct validity of this instrument. In
terms of a psychometric instrument, validity is more important than internal consistency. If
Silverman (2000) had provided evidence of the construct validity of the VSI, α = .46 may
have been considered acceptable, and undermined its validity coefficients. Despite the
unacceptable level of internal consistency and lack of evidence of construct validity, this
widely used psychometric instrument provided a foundation for the development of the
70-item version of the VSLQ. Many classroom teachers use questionnaires that have no
commonly used instrument for identifying VSL in the primary school years. Silverman
(2000) has also provided some evidence to support the claim that the questionnaire has
construct validity. As such, it is a more useful instrument to underpin the development of the
VSLQ than other instruments that have not be subjected to any form of psychometric analysis
or are not commonly used by teaching professionals.
Preferences for Visual-Spatial Learning in the Educational Context
Students who display preferences for visual-spatial learning require appropriate
teaching strategies (Gilakjani, 2012; Hattie, 2008; Silverman, 2005, 2013). Mann (2006)
asserts that students who have spatial strengths and weak verbal skills often struggle in the
traditional classroom. This is because the traditional educational system focuses primarily on
using verbal and writing based teaching strategies rather than teaching strategies using
images, pictures, colours, and maps to organise and communicate ideas (Silverman, 2005). A
preference for visual-spatial learning is not the same as visual-spatial ability. Visual-spatial
ability is the ability to mentally manipulate two-dimensional and three-dimensional figures
(Weckbacher, 2007). Visual-spatial learning is a preference for the way an individual learns
to organise and communicate ideas and concepts (Silverman, 2005). A preference for
visual-spatial learning is identified through instruments that measure typical performance, whereas
visual-spatial ability is generally identified through measures of maximal performance
(Cronbach, 1960; Klehe Latham, 2008). Typical performance instruments measure a
respondent’s motivation rather than his/her ability. Klehe and Latham (2008) claim that
measures of typical performance are associated with prediction of motivation rather than
ability. In contrast, maximal performance tests measure how well people can perform at their
Those students who demonstrate a preference for visual-spatial learning struggle
within the classroom and are expected to learn despite their teachers using strategies and
activities that often make learning difficult, if not impossible. This is exemplified by Dunn,
Griggs, Olson, Gorman, and Beasley’s (1995) claim that the closer the match between
students’ learning styles and their teachers’ teaching styles, the higher the academic result.
This is supported by Pask (1988) who found that a mismatch between learning and teaching
strategies leads to no relevant learning and poor task scores in vocational education and
training courses.
Matching learning and teaching strategies leads to high quality learning and high task
scores (Dunn & Dunn, 1993; Pask, 1988). Hattie’s (2008) research has shown that matching
style of learning and teaching methods has an ES = .41. This suggests that there is a
statistically significant relationship between student achievement and the use of teaching
strategies that match the learning style of students. Brown (2003) argues that when
secondary school students’ learning preferences match their instructor’s teaching style,
student motivation, and achievement usually improves. Ford and Chen (2001) also found
that the relationship between learning styles and pedagogical practices could have a
significant influence on learning outcomes. Many gifted and talented (GT) students as well
as students with autism spectrum disorder (ASD) demonstrate a preference for visual-spatial
learning. In other words, these groups of students have a preference for using images,
pictures, colours, and maps to organise and communicate ideas (Silverman, 2005). As such,
they find it difficult to engage in classrooms where teachers use teaching strategies that rely
heavily on auditory and word-based methods as a means of disseminating information
Those students who display visual-spatial preferences require individual teaching
strategies to promote educational success (Anderson, 2014; Burgoyne, 2010; Hattie, 2008;
Mann, 2006). By identifying secondary school students with ASD who have a preference for
visual-spatial learning, teachers will be able to successfully cater for their individual
educational needs. Failure to identify and cater for the needs of individuals can have
negative consequences for the individual, teacher, school, and community in general (Mann,
2005).
Students who have their individual educational needs catered for often experience
academic, social, and personal success (Collinson, 2000). This is supported by the work of
Hattie (2008) who conducted a meta-synthesis of 800 meta-analyses examining influences on
student achievement. He identified teaching strategies (ES = 0.62), individualised instruction
(ES = 0.22), and matching learning styles (ES = 0.17) as three factors that influence student
achievement within the classroom context. In contrast, when the individual needs of students
are not catered for there is a high probability that the student might become disengaged.
Cancelli, Harris, Friedman, and Yoshida (1993) found that types of instruction
(teacher-directed learning, chalk and talk) are related to disengagement behaviour that negatively
impacts on academic achievement. This is supported by Kong, Wong, and Lam (2003) who
assert that the methods used to cultivate learning in the classroom are far more important than
the curriculum being studied.
Those students with high-level visual-spatial abilities are more likely to choose
careers in fields related to mathematics, such as engineering and computer science, whilst
those with auditory-sequential preferences generally pursue careers in the humanities and
This is exemplified by Baron-Cohen, Wheelwright, Stott, Bolton, and Goodyer’s (1997)
claim that individuals with high-level visual-spatial ability or a preference for visual-spatial
learning are twice as likely to be employed in the field of engineering, than those without
these skills or learning preference. According to Gohm, Humphreys, and Yao (1998) people
identified as having high-level visual-spatial abilities are underrepresented in universities and
the workplace relative to their ability level when compared with individuals with
auditory-sequential strengths. Identifying individuals with a preference for visual-spatial learning can
help them to develop their talents and use these talents to their fullest potential. The
development of a self-administered, reliable, and valid psychometric instrument for
measuring preferences for visual-spatial learning in secondary school aged children would
facilitate this process.
Characteristics of VSL
Within the classroom VSL display characteristics, which differentiate them from
other styles of learning. VSL are often placed in binary opposition to auditory-sequential
learners (ASL). However, psychological research has shown that these two abilities are
located on opposite ends of a common spectrum (Mann, 2006; Silverman, 2000). As such, a
psychometric instrument developed to measure preferences for visual-spatial learning in
secondary school students should also include items that measure preferences for
auditory-sequential learning. By having items that contradict the literature (Mann, 2005; Silverman,
2005, 2013) on visual-spatial learning these items can be used to identify where a student
falls on the spectrum between visual-spatial learning and auditory-sequential learning. The
Whilst an ASL has auditory preferences and strengths, a VSL has visual preferences
and strengths. VSL relate well to space, whereas ASL relate well to time. ASL are
step-by-step learners (Silverman, 2013). In other words, they work sequentially through ideas during
the learning process. VSL, in contrast, are whole-part learners (Silverman, 2005). They
learn best by first seeing a broad overview of the entire content to be learnt then breaking it
down into its constituent parts. For this reason, they learn concepts all at once and grasp
complex concepts easily (Silverman, 1989a, 1989b). Alternatively, an ASL has to progress
sequentially from easy to more difficult material. For this reason, they learn best through rote
memorization. As such, they may need some repetition to reinforce learning (Silverman,
2005).
Conversely, VSL learn best by seeing the relationships between concepts (Silverman,
2005). They are turned off by repetition because they learn concepts permanently. ASL and
VSL differ in terms of their critical thinking ability. ASL are analytical thinkers, breaking
down ideas into single and manageable components, whilst VSL are good at combining parts
of a whole in new and different ways (Sword, 2000). Because of this, VSL often see the big
picture but may miss details. Students who display auditory-sequential preferences attend
well to details (Silverman & Freed, 1991).
Learning styles. Within the classroom, ASL and VSL have distinct learning styles.
In terms of educational instruction, ASL follow oral directions well but have a short-term
auditory memory. VSL need visual methods of instruction and have a good long-term visual
memory (Silverman, 2005). ASL can write quickly and neatly in their exercise books. VSL
prefer keyboarding to writing. ASL are well organised, whilst VSL create unique methods of
both ASL and VSL have different interactions with their teachers. VSL are very sensitive to
their teacher’s reactions. ASL, on the other hand, learn in spite of emotional reactions
(Silverman, 2005). Because these two types of students learn in different ways classroom
teachers need a reliable and valid instrument for measuring preferences for visual-spatial
learning.
Organisational ability. Whilst there are many characteristics of students with
preferences for visual-spatial learning there are two main factors, organisation and spatial
awareness, that underlie this learning style. Organisation for students with a preference for
visual-spatial learning is often a stumbling block (Mann, 2005). VSL are usually
disorganised and may miss details. These students are highly aware of space but pay little
attention to time (Silverman & Freed, 1991). The limited organisational ability of VSL is
well documented in the literature. Silverman (2000) believes that VSL create unique
methods of organisation. This is exemplified by Silverman and Freed’s (1991) claim that “a
visual-spatial child’s organisational strategies often appear non-existent” (p. 1). Organisation
for many of these individuals is a stumbling block. For students with auditory-sequential
strengths and a preference for auditory-sequential learning, organisation is a strength
(Silverman, 2005). As such, organisation (disorganisation) should be an underlying factor on
any reliable and valid psychometric instrument designed to measure preferences for
visual-spatial learning in secondary school students. Any instrument subjected to a factor analysis
to determine internal consistency should contain the construct of organisation
(disorganisation) in addition to visualisation and spatial ability as underlying factors.
Academic curriculum. In terms of curriculum areas, VSL and ASL display distinct
at mathematical reasoning (Mann, 2005; Van Garderen & Montague, 2003). Students who
display a preference for ASL in general prefer algebra whilst VSL display a preference
towards geometry (Campbell, 1993; Clements, 1998; Clements & Battista, 1992). ASL can
show their steps in calculations easily. VSL generally come up with answers intuitively
(Silverman, 2005). This is supported by Hegarty and Kozhevnikov’s (1999) assertion that
spatial ability is highly correlated with success in mathematics education. Sherman (1979)
supports this assertion by claiming that spatial ability is one of the main factors significantly
affecting mathematical performance. Kaufman (1990) furthers this argument by stating that
this correlation increases with the complexity of the mathematical tasks.
In terms of science, ASL prefer chemistry whilst VSL have a tendency towards
physics (Cummings, Marx, Thornton, & Kuhl, 1999; Kozhevnikov, Motes, Hegarty, 2007;
Thornton, 1999a, 1999b). This is exemplified by Kozhevnikov et al.’s (2007) claim that
“visualisation plays a central role in conceptualisation processes of physics” (p. 549). The
assertion that VSL have a preference towards physics is supported by numerous studies in
physics education (Champagne, Klopfer, & Anderson, 1980; Cummings et al., 1999;
Sokoloff & Thornton, 1997; Thornton, 1999a, 1999b; Thornton & Sokoloff, 1990) that
demonstrated students have a poor understanding of the curriculum area after traditional
lecture based instruction.
When learning second languages ASL prefer to be taught through formal instruction.
VSL, on the other hand, master second languages through immersion in real-life contexts
(Silverman, 2000). In early schooling ASL learn words phonetically, whilst VSL learn whole
words easily (Browder & Xin, 1998). This means that students who display a preference for
(Marcell & Armstrong, 1982; Silverman, 2005; Wheldall, Beaman, & Madelaine, 2009).
Because of the characteristics of ASL these students are often seen to be academically
talented maintaining high grades for all curriculum areas and are early bloomers. In contrast,
VSL may have uneven grades and develop academically at a later age. They often appear
creatively, technologically, emotionally, or mechanically gifted (Silverman, 2005).
Groups with Visual-Spatial Preferences
Many groups of students within the classroom demonstrate significant visual-spatial
ability (Anderson, Colombo, & Shaddy, 2007; Ashwin, Ricciardelli, & Baron-Cohen, 2009;
Koh, Milne, & Dobkins, 2010; Deruelle, Rondan, Gepner, & Tardiff, 2008; Haist, Adamo,
Westerfield, Courchesne, & Townsend, 2005; Reis & McCoach, 2010). The high-level
spatial ability of students with ASD and GT students has been referred to extensively in the
research literature.
ASD. ASD is an umbrella term for individuals who display problems and difficulties
with social interaction, impaired language and communication skills, and unusual patterns of
thought and physical behaviour (Haq & Le Couteur, 2004; Jordan, 2005; Wing, 1996).
Research has shown that many individuals with ASD have exceptional spatial ability
(Anderson et al., 2007; Ashwin et al., 2009; Koh et al., 2010; Deruelle et al., 2008; Haist et
al., 2005).
Some commentators (Ashwin, Ashwin, Rhydderch, Howells, & Baron-Cohen, 2009;
Behrmann, Thomas, & Humphreys, 2006; Happy & Frith, 2006; Perreault, Gurnesey
Dawson, Mottron, & Bertone, 2011; Samson, Mottron, Soulieres, & Zeffiro, 2012) have
shown that people with ASD perform better than control groups on tasks involving
Chouinard (2004) demonstrated through a study involving navigating a human-size labyrinth,
that individuals with ASD have advanced discrimination, detection, and memory for visual
patterns. They are also able to link images on maps with those in the real world. O’Riordan,
Plaisted, Baron-Cohen, and Driver (2001) found during a study of children with ASD that
they performed better than typically developing children on difficult visual-search tasks.
Similarly, Edgin and Pennington (2005) found that students with ASD had faster reaction
times on the embedded figures task, which involves locating shapes within a complex
drawing.
Studies have shown that people with ASD are particularly good at perceiving
individual details, but new findings (Bertone, Mottron, Jelenic, & Faubert, 2005) suggest that
they can also detect large-scale patterns effectively. The results of these studies are
supported by Grandin’s (2006) claim that “one of the most profound mysteries of autism has
been the remarkable ability of most autistic people to excel at visual-spatial skills while
performing so poorly at verbal skills” (p. 1). Weiss (1989) and Huttenlocher (1984) believe
that the visual systems in individuals with ASD are expanded to compensate for their deficits
in language. A functional MRI study by Ring et al. (1999) indicates that people with this
condition depend more on the visual parts of the brain on the embedded figures task. These
research findings are supported by Baron-Cohen and Hammer’s (1997) theory that
individuals with ASD have an extreme form of male brain. They begin their argument by
claiming that men, in general have superior spatial ability and reduced social skills, compared
with women. They expand on this argument by claiming than individuals with ASD have an
(Baron-Cohen Hammer, 1997). This is further supported by Frith’s (1989) claim that
individuals with the condition are especially gifted at spatial analysis.
Students with ASD have problems learning things that cannot be thought about in
pictures (Grandin, 2006). Numerous studies (Caron et al., 2004; Edgin & Pennington, 2005;
Grandin, 2006; O’Riordan et al., 2001) have shown that people with ASD process visual
information differently from others. The idea that high-level visual-spatial ability is a
characteristic of individuals with ASD has been extended to the classroom context and
learning styles (Evers, Noens, Steyaert, & Wagemans, 2011; Landry, Mitchell, & Burack,
2009; Richmond, Thorpe, Berryhill, Klugman, & Olsson, 2013; Van Eylen, De Graef,
Steyaert, Wagemans, & Noens, 2013; White & Saldana, 2011). By using visual-spatial
teaching styles these students may experience success within the classroom context. This is
supported by Hodgdon’s (1999) claim that these students do not understand their world very
well; “they tend to be visual learners in a very auditory world” (p. 65).
Most traditional teaching methods used in working with students with ASD rely
heavily on auditory instruction. The condition encompasses a wide variety of needs and
abilities within the range of children with this disability, and not all children within this
grouping benefit from copious oral based instruction (Tissot & Evans, 2003).
Neuropsychological studies of individuals with ASD (Minshew, Goldstein, Muenz, &
Payton, 1992; Quill, 1997) have shown better abilities in visual-spatial organization
compared with typically developing individuals. All children can benefit from teachers using
visual pedagogical strategies but this is especially true for children with ASD. Plaisted,
O’Riordan, and Cohen (1998) claim that children with this pervasive developmental disorder
rather than written words. Tissot and Evans (2003) claim that these students would benefit
from pedagogical strategies emphasizing a visual approach. Teachers can help children with
ASD function more independently by structuring the environment with visuals (Meadan,
Ostrosky, Triplett, Michna, & Fettig, 2011). Having the condition does not mean being
unable to learn but it does mean that there are differences in how learning happens (Larkey,
2006).
The most strongly recommended approach for teaching students with ASD is visual
aids (Chausse, Tadey, Stehr, Phaneuf, Newton, 2015). Pictographic clues often help a
student with ASD learn (Quill, 1997). Using visual supports enables them to focus on the
message (Quill, 1995). According to Hodgdon (2000) visual supports, when implemented
correctly, allow students with ASD the freedom to engage in life, regardless of impairment.
Visual supports have been successfully used to teach these children a variety of skills
including literacy skills, cooking, encouraging positive behaviour, and providing schedules.
Roa and Gagie (2006) claim that “visual supports help bring structure, routine, and sequence
that many children with ASD require in order to carry on their daily activities” (p. 27). This
is further supported by Dalryaple’s (1989) assertion that “as a rule of thumb, the more people
with ASD can be provided with visual cues, the better they will understand what they are
supposed to do” (p. 5). By identifying students with a preference for visual-spatial learning,
classroom teachers will be able to use visual teaching methods that research (Dettmer,
Simpson, Smith-Myles, & Ganz, 2000; Johnson, Nelson, Evans, & Palazolo, 2003;
Lovannone, Dunlap, Huber, & Kincaid, 2003; Tissot & Evans, 2003) has shown to be
effective. Kluth and Darmody-Latham (2003) have suggested using visuals such as graphic
ASD. Rao and Gagie (2006) emphasise the importance of providing visual supports so that
students with ASD can process verbal communication. Dettmer et al. (2000) found that the
use of visual supports significantly reduced task confusion. This is supported by Grandin’s
(1995) statement that “spatial words such as over and under had no meaning to me until I had
a visual image to fix them in my memory” (p. 30).
GT students. Acute visual skills are also found in students identified as GT (Reis
& McCoach, 2010). This is because visual thinking is associated with being intellectually
gifted (Grandin, 2006). Holton (1971) uses Albert Einstein as an example of a gifted visual
thinker. He failed his high school language requirement and relied on visual methods to
study. Einstein’s theory of relativity was based on visual imagery of moving boxcars and
riding on light beams. West (1997) provides other examples of gifted scientists - Leonardo
de Vinci, Faraday and Maxwell - who were visual thinkers. Silverman (2005) claims that
33% of the gifted population within a school are strongly visual-spatial. An additional 30%
show a slight preference towards the visual-spatial style. This suggests that the majority of
the gifted student population could potentially benefit from matching visual-spatial teaching
methods with their learning preference.
Scientific Developments Associated with Visual-Spatial Ability
Historical developments in the field of science have contributed to the development of
the concept of the VSL. Spatial intelligence has both evolutionary and adaptive importance.
Newcombe and Frick (2010) argue that individuals must be able to navigate in the world to
survive. Scientific research using both animals and humans (Gazzaniga, 1973; Kimura,
Denenberg, 1980; Vallortigara, 2000) has demonstrated that the right hemisphere of the brain
is responsible for spatial ability and spatial functioning.
Neurological studies showing variations in the organization of the human brain
provide experimental evidence for a structural source of the variation in spatial abilities
(McGee, 1979). Visual-spatial processing and mental manipulation of shapes and images is
an essential brain function (Heinze et al., 1994; MacNeilage, Rogers, Vallortigara, 2009)
that enables individuals to select and process high priority information in the visual fields.
MacNeilage et al. (2009) claim that every individual has a special evolutionary status. Those
with right hemisphere dominance have a greater sense of how objects interrelate in space.
This suggests that some individuals have greater spatial abilities than others. As such,
individuals can be identified based on their spatial abilities. Spatial ability is also influenced
by the level of conflict between the left and right hemispheres (Joseph, 1988).
Research has demonstrated that there is a relationship between spatial tasks and the
right hemisphere of the brain. Gazzaniga, Bogen, and Sperry (1965), and Gibbs, Appleton,
Gazzaniga, Bogen, and Sperry (1965) demonstrated that there was a disturbance in the ability
to mentally manipulate two-dimensional and three-dimensional figures when the cerebral
hemispheres in a man were disconnected and the left hemisphere was stimulated. Studies of
brain damaged patients’ show that injury to the right hemisphere can stop the generation of
visual images from stored long-term memories, whilst at the same time not affecting
language and verbal memory (Grandin, 2006). Another theory running strongly through the
literature (Corbetta & Shulman, 2002; Dittuno & Mann, 1990; Levy, Hasson, Avidan,
2003) is that individuals with left hemisphere brain deficits develop right-hemisphere
strengths to overcome the deficit.
Von Karolyi et al. (2003) report that studies have shown superior levels of
visual-spatial abilities in students with dyslexia caused by left hemisphere deficits. Levy et al.
(2001) claim that there is a link between educational achievement and stimulation of the
spatial elements of the right hemisphere. This is supported by their claim “unless the right
hemisphere is activated and engaged, attention is low and learning is poor” (p. 1). Research
(Brown & Campione, 1972; Bruck, Cavanagh, & Ceci, 1991; Levin & Mayer, 1993; Mandler
& Ritchey, 1977; Shepard, 1967; Standing, 1973) consistently indicates that forming visual
images can be a powerful means of storing information in long-term memory. People of all
ages have a remarkably accurate memory for visual information. People’s memory for visual
material is often better than it is for strictly verbal material (Shepard, 1967).
Individuals who use images, pictures, colours, and maps to organise and communicate
ideas are referred to as VSL and have a preference for visual-spatial learning (Silverman,
2005). Scientific research (Galea, Kavaliers, Ossenkopp, Innes, & Hargreaves, 1994;
Kimura, 1992; Van Garderen, 2006) into the brain has shown that individuals can have
varying levels of ability in using images, objects, and symbols to organise and communicate
ideas. A theme running strongly through the academic literature (Caron et al., 2004; Lord,
Schopler, & Revicki, 1982; Plaisted et al., 1998) is the preference for visual-spatial learning
of students with ASD, and those who are GT. This means that classroom teachers need to
use visual-spatial teaching strategies to allow these students to organise information and
communicate their ideas so that they can achieve educational success (Gamoran, 1989;
be identified within the classroom context. The development and validation of a new
measure of visual-spatial learning will assist secondary school teachers to identify and
support this type of learner.
Psychological Developments Associated with Visual-spatial Ability
Developments in the field of psychology have contributed to the evolution of the
concept of the VSL. Research into the psychology of intelligence and cognitive processes
has established that spatial thinking is the principle complement to verbal thinking
(Newcombe & Frick, 2010; Ramadas, 2009). Spatial ability is the capacity to understand,
remember, and visualise the spatial relations amongst objects (Shea et al., 2001). Factor
analytic research has shown that visualisation is a well-defined underlying skill within
general intelligence in adults (Bornstein, 2009; Carroll, 1993; Herrmann,
Hern´andez-Lloreda, Call, Hare, & Tomasello, 2010).
Historical background. Research on cognitive styles began in the late 1940s and
early 1950s when researchers (Hanfmann, 1941; Klein, 1951; Witkin, 1950; Witkin & Ash,
1948) attempted to identify the way people perceive, think, solve problems, learn, and relate
to others. A number of articles were published in the literature (Humphrey, 1976; Witkin et
al., 1954) with a primary focus on personalities and social relationships. A study conducted
in 1941 by Hanfmann showed that individuals used either a perceptual or conceptual
approach when they grouped blocks. This was supported by Witkin and Ash (1948) who
achieved similar results on the rod-and-frame test.
The test involved a participant sitting in a darkened room with a researcher. The
participant was given a glowing rod and a glowing frame. The researcher manipulated the
manipulate the rod so that it is perfectly upright. If the participant adjusted the rod so that it
was leaning in the direction of the frame they were categorised as field dependent because of
his/her reliance on visual clues. Individuals who disregarded the visual clues when
completing the task were categorised as field independent (Lester, 1968; Nyborg, 1974;
Sigmand, Goodenough, & Flannagan, 1979).
In the late 1950s the idea that there was a binary opposition between cognitive styles
became popular. There were no attempts to integrate them. Experiments during this period
of time involved giving participants a task and two or more possible ways of solving it.
When the participant chose a solution this was believed to be evidence of the individual’s
cognitive style (Kozhevnikov, 2007). Interest in cognitive styles lost momentum in the
1970s. Despite the loss of interest in this field, the categories of Visualizers and Verbalizers
were developed by Paivio (1971), and Richardson (1977). Further research into these
categories has been conducted by many other commentators (Cassidy, 2004; Chinea & Chen,
2008; Cox, 1999; Riding & Cheema, 1991). These categories constituted the foundations of
Silverman’s (2000) concepts of the VSL and ASL. Research into the field of cognitive styles
was resurrected in the 1980s when psychological researchers (Sternberg & Zhang, 2001) in
the field of education argued that cognitive styles have predictive power for academic
achievement.
Theoretical underpinnings. Spatial intelligence was one of the types of intelligence
proposed in Gardner’s (1983, 1993) multiple intelligences theory and has contributed to the
development of the concept of the VSL (Mann, 2005, 2006; Silverman, 2000, 2005, 2013).
Piaget’s (1976) theory of sensorimotor experience lays the foundation of visual intelligence.
infants coordinate visual experiences with physical movement (Berk, 2008; Brown &
Desforges, 1979; Inhelder, Chipman, Zwingmann, & Piaget, 1976). This theory suggests that
categories can be developed based on visual-spatial ability.
Following Piaget’s line of thought, Wachs’ (1980) claims that the determining factor
for visual intelligence is not what passes through the eye but rather what a person can
understand from a particular visual experience. Bruner’s (1966) iconic representation and
symbolic representation address this issue. Bruner (1964) argues that perception is an active
practice. Iconic representation is the idea that information is stored visually in the form of
images. These images are then formed into a symbolic code (symbolic representation).
Spatial ability is closely related to visual thinking. However, it is believed by a
number of commentators (Dixon, 1983; Olson, 1984) that there is not one specific pattern of
characteristics that manifest in individuals with high-level spatial abilities. Combinations of
the traits described vary widely from individual to individual, yet there are some common
behaviours that will be seen in these individuals who process information visually (Mann,
2006). These common characteristics provide the basis of instruments designed to measure
visual-spatial ability and preferences for visual-spatial learning.
The claim by a number of researchers (Conrad, 1964; Holding, 1992; Matthews,
Hunt, & MacLeod, 1980) that individuals can transfer information from visual to verbal form
and back again supports Silverman’s (2005) claim that visual-spatial ability and
auditory-sequential ability fall on a spectrum. According to her, 33% of students have a strong
preference for using images, pictures, colours, and maps to organise and communicate ideas
style. 23% use verbal language, written word, and analytical thinking to organise and
communicate ideas (Silverman, 2005).
Debate exists in the literature about the application of multiple intelligences theory in
the classroom. Weber (1992) and Durie (1997) believe that multiple intelligences theory
should only underpin pedagogical strategies within the classroom, whilst Chapman and King
(2001) believe that it should solely inform assessment strategies. Ribot (2004) argues that the
theory of multiple intelligences should be applied to all elements of classroom teaching. This
is supported by Gardner and Walters (1993), Hearne and Stone (1995), and Hoerr (1994) who
suggest that educators should assess their students’ preferred learning style then provide
teaching and learning opportunities that correspond with this learning style to ensure quality
learning takes place. The preferred learning style of students is identified through measures
of typical performance, rather than measures of maximal performance (Cronbach, 1960;
Klehe Latham, 2008). By identifying secondary school students with a preference for
visual-spatial learning, teachers will be able to use appropriate pedagogical and assessment
strategies to cater for their individual educational needs. The concept of the VSL, developed
by Silverman (2005), is based on the research conducted by Gardner (1983) and others
(Freed, 1996; Masson 1996; Silverman, 1998). VSL are individuals who think primarily in
pictures and have visual strengths. They have a strong preference for using images, pictures,
colours, and maps to organise and communicate ideas (Silverman, 2005). ASL, on the other
hand, are individuals who think primarily in words and have auditory strengths. They use
verbal language, written word, and analytical thinking to organise and communicate ideas
Cognitive profiles. Although much work has been done on multiple intelligences
and spatial ability, very little research (Mann, 2005; Silverman, 2000; Van Nijnatten, 2013)
exists on identifying students who demonstrate a preference for visual-spatial learning. The
majority of the research has been conducted by Silverman (1989a, 1989b, 1997, 1999, 2000,
2005, 2013). Individuals differ in terms of the specific profile of intelligence they display.
Researchers discuss two methods of representing knowledge, the verbal code and the
imagistic code (Gardner, 1993). The assertion that there are differences between the
visual-spatial learning style and auditory-sequential learning style is supported by the work of
Bartlett (1932), Paivio (1971), and Richardson (1977) who claim that individuals can be
classified as either Visualizers or Verbalizers. Visualizers rely primarily on imagery when
attempting to perform cognitive tasks. Verbalizers, in contrast, rely primarily on
verbal-analytical skills. The concepts of the Visualizer and Verbalizer correspond with Silverman’s
(2000) concepts of the VSL and ASL. Presson and Hazelrigg (1984) argue that learning
through visual experience is more flexible. It allows for deeper understanding of content,
whilst increasing motivation to learn. This is exemplified by the adage “a picture is worth a
thousand words.”
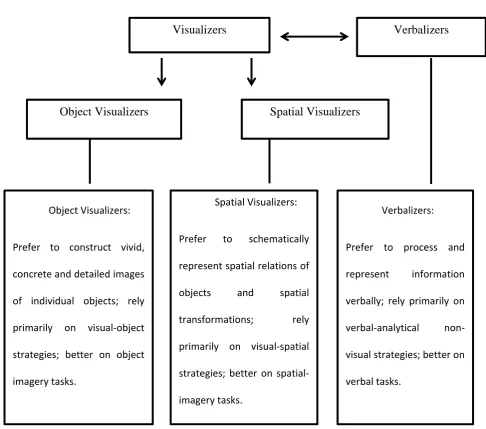
Kozhevnikov, Hegarty, and Mayer (2002a) state that there are two groups of
Visualizers, those with high spatial ability and those with low spatial ability. Visualizers with
low spatial ability are good at identifying the form, colour, brightness, and other aspects of an
object’s appearance (Kozhevnikov et al., 2002a). These people are good at pictorial imagery
and excel at constructing detailed and vivid mental images. High spatial Visualizers are good
at identifying the spatial relationships between parts of an object and how those objects move
three-
dimensional images (Kozhevnikov et al., 2002a). This is supported by Burton and Fogarty’s
(2003) assertion that high spatial Visualizers are better identified by instruments that use a
combination of geometrical shapes and self-report items, or items on self-report instruments
that reflect “objective” spatial ability tests.
This argument is also supported by Baron-Cohen and Hammer’s (1997) theory that
individuals with ASD have an extreme form of male brain. They begin their argument by
claiming that men, in general have superior spatial ability and reduced social skills, compared
with women. Not every male will have a spatial advantage but the likelihood of having a
spatial advantage is raised if one is male. Baron-Cohen and Hammer (1997) extend on this
argument by claiming than individuals with ASD have an extreme form of the male brain
type, high-level spatial ability and social skills deficits. They provide evidence for this claim
by referring to the research of Shah and Frith (1983) who found that children with this
pervasive developmental disorder performed better than typically developing peers on the
embedded figures test and block design subtest of the Weschler IQ tests. Frith (1989) claims
that individuals with ASD are especially gifted at spatial analysis.
Mathematical ability. Students with a preference for visual-spatial learning
demonstrate a preference for mathematical reasoning and problem solving (Hegarty &
Kozhevnikov, 1999). The new instrument, VSLQ, for measuring preferences for
visual-spatial learning builds on Silverman’s (2000) VSI by including items relating to
mathematical ability. Although mathematical reasoning and problem solving have been
identified by Silveman (2000) as characteristics of students who have a preference for
visual-spatial learning, no items relating to this were included in the VSI. Eight items relating to
developed as an instrument for measuring preferences for visual-spatial learning in secondary
school students. As such, the terminology used in the Australian Curriculum for
Mathematics influenced the development of the items. The terms ‘Algebra’ and ‘Geometry’
are used within the items because these are explicitly stated in the Achievements Standards
for Mathematics from Year Eight to Year Ten (Australian Curriculum, Assessment, and
Reporting Authority, 2016). Hattie (2008) argues that effective teachers make learning
visible for students and have a common language for learning. As such, secondary school
students within Australia are aware of the terminology used in the items within the VSLQ.
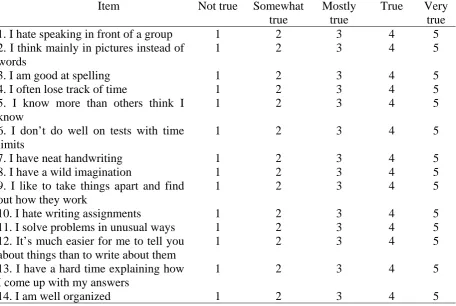
Table 2.1
Items on VSLQ Related to Mathematical Thinking
Item Content
10 I find problem solving questions in mathematics more interesting than regular
equations
13 When I am doing Mathematics the answers to the questions tend to just come to me
20 I hate studying algebra in mathematics
32 I love doing times tables
53 I am good at mathematics questions that I have been shown how to do; however, I
find problem solving questions difficult
57 I always show my working when completing problems in mathematics
61 I enjoy studying algebra in mathematics
62 I hate studying geometry (shapes and angles) in mathematics
Presentation of visual-spatial ability. Research suggests that there are differing
levels of ability within the group of students who display high-level visual-spatial ability and
a preference for visual-spatial learning (Blazhenkova, & Kozhevnikov, 2009, 2010;
Kozhevnikov, Kosslyn, & Shephard, 2005; Silverman, 2005). Johnson-Laird (1985)
analysed scores on intelligence tests and identified two factors, verbal ability and spatial
spatial relations among objects. It involves many sub skills, such as the visual manipulation
of objects (Gardner, 1993; Olson, 1984; West, 1997), the ability to comprehend the
relationships between fluid, changing patterns (Dixon, 1983), and the ability to manipulate
complex visual material (Cooper Regan, 1984; Shea et al., 2001). Spatial ability is a
dimension of cognitive ability that relates to how an individual perceives the world and
acquires new knowledge (Gardner, 1983, 1993; Shea et al., 2001). It consists of a number of
subcomponents: spatial visualisation, spatial awareness, and object visualisation
(Blazhenkova & Kozhevnikov, 2010). These subcomponents could constitute the underlying
factors that underpin the development of any psychometric instrument developed to measure
preferences for visual-spatial learning in secondary school students.
Individuals who possess spatial strengths are adept at using images to search for
solutions to problems and express their thoughts. Kwon, Reiss, and Menon (2000) assert that
‘visuospatial ability’ is a factor in working memory, which is responsible for the maintenance
and manipulation of spatial information. “Working memory refers to a brain system that
provides temporary storage and manipulation of the information necessary for such complex
cognitive tasks as language comprehension, learning, and reasoning” (Baddeley, 1992, p.
556). West (1997) suggests that there is a hierarchy of spatial thinking skills. This suggests
that there is a spectrum from auditory-sequential ability to high-level visual-spatial ability,
which corresponds with Silverman’s (2000) concepts of the ASL and VSL. Learning through
auditory-sequential methods means great precision but lacks flexibility. A person with
sequential dominance may perceive the world differently to someone with spatial dominance
(Silverman, 2000). According to Silverman (2005), individuals favour one method of
(2000) VSI by identifying where on the auditory-sequential learning and visual-spatial
learning spectrum a secondary school student falls.
Silverman’s (2000) VSI only includes items that measure preferences for
visual-spatial learning. In contrast, the VSLQ consists of items that measure preferences for both
visual-spatial learning and auditory-sequential learning. By demonstrating the reliability and
validity of the VSLQ this instrument will also build on the lack of statistical evidence
provided to support the efficacy of Silverman’s (2000) VSI. A short, reliable, and valid
questionnaire for measuring preferences for visual-spatial learning will allow a classroom
teacher to identify secondary school students with this learning preference. The teacher can
then use visual-spatial teaching strategies that will allow students with a preference for
visual-spatial learning to organise and communicate ideas, leading to educational success
within the classroom.
Spatial-ability and auditory-sequential spectrum. Research in the field of
psychology has established that there is a difference between visual-spatial and
auditory-sequential ability (Blazhenkova & Kozhevnikov, 2009, 2010; Kozhevnikov et al., 2002b;
Kozhevnikov et al., 2005). However, rather than being in binary opposition they are located
on a spectrum. This suggests that students can have a diverse array of characteristics. Within
this diverse array of characteristics is a preference towards visual-spatial ability or
auditory-sequential ability (Silverman, 2005). This is supported by a series of studies conducted by
Kozhevnikov et al. (2002a, 2002b), and Kozhevnikov et al. (2005). Kozhevnikov et al.
(2005) found that rather than individuals being solely Visualizers or Verbalizers there were
multiple sub-groups with crossovers between each. Verbalizers tended to be a homogenous
The assertion that visual-spatialand auditory-sequential ability falls on a spectrum is
supported by the work of Krutetskii (1976). It is believed that individuals can be classified
into three groups - Verbalizers, Visualizers, and Mixers. Verbalizers prefer verbal-logical
rather than imagery modes when attempting to solve problems. This category corresponds
with Silverman’s (2000, 2005) concept of the ASL. Visualizers are those who prefer to use
visual imagery. This category corresponds with Silverman’s (2000, 2005) concept of the
VSL. According to Silverman’s (2000) research, VSL have a preference for visual-spatial
learning. Mixers fall between the two previous categories and have no preference for either
visual or verbal learning.
Krutetskii’s (1976) claims about the existence of three different groups within the
student population are supported by Silverman’s (2000, 2005) assertion that 33% of students
are strongly visual-spatial. An additional 30% show a slight preference for the visual-spatial
learning style. Only 23% are strongly auditory-sequential. Moses (1980), Lean and
Clements (1981), and Presmeg (1986a, 1986b, 1992) assert that individuals can be placed on
a continuum with regard to their preference for using visual imagery whilst solving
mathematical problems. The development of a new instrument for measuring preferences for
visual-spatial learning will identify secondary school students who have a strong preference
for this type of learning. The presence of items on the VSLQ that measure preferences for
auditory-sequential learning also allow the diverse array of characteristics a student
demonstrates along the auditory-sequential and visual-spatial spectrum to be identified. By
demonstrating the reliability and validity of this instrument, users of this measure can ensure
that the results of this questionnaire are accurate. Classroom teachers can then use
and communicate ideas to their students (Silverman, 2005). Research has shown that these
strategies will lead to educational success for students with a preference for visual-spatial
learning.
Educational Developments Associated with Visual-Spatial Ability
The concept of the VSL has also been facilitated by historical developments in the
field of education. An educational innovation towards the end of the century was the
recognition that students learn differently from each other. With this revelation came the
introduction of personality types, learning styles, and multiple intelligences as a means of
adapting to the individual differences of students within the classroom context. In the later
decades of the twentieth century, research on the Visualizer-Verbalizer cognitive style began
to appear in the educational literature (Cox, 1999; Cox, Stenning, & Oberlander, 1994;
Riding & Cheema, 1991; Stenning, Cox, & Oberlander, 1995). It was first claimed that
students could be classified according to how they process mathematical information.
Students who used verbal-logical modes when solving mathematical problems were referred
to as an analytic-type student. Alternatively, students who preferred to use imagery were
referred to as a geometric-type student (Krutetskii, 1976).
Eventually, the idea that different cognitive styles are in binary opposition to each
other became unpopular. Researchers (Lean & Clements, 1981; Moses, 1980; Presmeg,
1986a, 1986b) hypothesised that students could be placed on a continuum based on their
preference for either the imagery or verbal-logical cognitive style. For this reason, a reliable
and valid psychometric instrument developed to measure preferences for visual-spatial
learning in secondary school students should include items that measure a preference for the