Products That Fail To Integrate
Benjamin Trinité,aEric C. Ohlson,aIgor Voznesensky,aShashank P. Rana,aChi N. Chan,aSaurabh Mahajan,aJason Alster,a Sean A. Burke,aDominik Wodarz,bDavid N. Levya
Department of Basic Science, New York University College of Dentistry, New York, New York, USAa
; Department of Ecology and Evolutionary Biology, University of California, Irvine, School of Biological Sciences, Irvine, California, USAb
Integration is a central event in the replication of retroviruses, yet
>
90% of HIV-1 reverse transcripts fail to integrate, resulting
in accumulation of unintegrated viral DNA in cells. However, understanding what role, if any, unintegrated viral DNA plays in
the natural history of HIV-1 has remained elusive. Unintegrated HIV-1 DNA is reported to possess a limited capacity for gene
expression restricted to early gene products and is considered a replicative dead end. Although the majority of peripheral blood
CD4
ⴙT cells are refractory to infection, nonactivated CD4 T cells present in lymphoid and mucosal tissues are major targets for
infection. Treatment with cytokine interleukin-2 (IL-2), IL-4, IL-7, or IL-15 renders CD4
ⴙT cells permissive to HIV-1 infection
in the absence of cell activation and proliferation and provides a useful model for infection of resting CD4
ⴙT cells. We found
that infection of cytokine-treated resting CD4
ⴙT cells in the presence of raltegravir or with integrase active-site mutant HIV-1
yielded
de novo
virus production following subsequent T cell activation. Infection with integration-competent HIV-1 naturally
generated a population of cells generating virus from unintegrated DNA. Latent infection persisted for several weeks and could
be activated to virus production by a combination of a histone deacetylase inhibitor and a protein kinase C activator or by T cell
activation. HIV-1 Vpr was essential for unintegrated HIV-1 gene expression and
de novo
virus production in this system.
By-passing integration by this mechanism may allow the preservation of genetic information that otherwise would be lost.
A
s for all retroviruses, integration of the newly reverse
tran-scribed human immunodeficiency virus type 1 (HIV-1)
cDNA genome into the host cell’s DNA has been observed to be an
essential replicative step, with the integrated provirus being the
exclusive template for all
de novo
virus production (
1
,
2
).
Integra-tion is mediated by the viral integrase enzyme, which is a product
of the
pol
gene and the target of the recently developed and highly
successful integrase inhibitor class of antiretrovirals (
3
). Since the
integrated provirus will remain for the life of the infected cell and
its descendants, integration is a major factor in HIV-1 persistence
(
4
,
5
).
Interestingly, irrespective of the activation status of the
in-fected CD4
⫹T cell,
ⱖ
90% of HIV-1 reverse transcripts fail to
integrate
in vivo
and
in vitro
(
6–10
).
In vivo
, this inefficiency of
integration results in an accumulation of unintegrated HIV-1
DNA (uDNA) in blood CD4
⫹T cells and monocytes (
7
,
8
,
11
,
12
),
as well as in lymphoid tissue (
8–10
), brain (
13
,
14
), and untreated
patients with high or low viral loads (
15
,
16
). During untreated
chronic infection, the majority of infected cells have been reported
to contain only unintegrated HIV-1 DNA (
7
). However, it
re-mains unclear whether unintegrated DNA plays any functional
role in the natural history of HIV-1 (
17
,
18
).
If the linear cDNA product of reverse transcription fails to
integrate, it can be degraded or become circularized. Linear
unin-tegrated HIV-1 DNA, one-long-terminal-repeat (1-LTR) circles,
and 2-LTR circles are all capable of limited transcription (
17
,
19–
21
), which can enhance T cell activation (
22
). Intriguingly, it has
been reported that similar numbers of integrated and
uninte-grated HIV-1 templates transcribe RNA (
23
). It is generally
ob-served that uDNA gene expression is higher in nonproliferating
cells than in proliferating cells, perhaps owing to a lack of dilution
of uDNA templates and their RNA and protein products (
17
,
24–
27
). The virion-associated Vpr protein transactivates uDNA,
en-hancing expression of early viral proteins in infected activated
CD4
⫹T cells (
28
,
29
). Vpr has several other activities (
30–33
),
including the ability to arrest cell proliferation (
34
) in the G
2/M
phase of the cell cycle (
35
,
36
), which is favorable to HIV-1
tran-scription (
37
,
38
), as well as the capacity to enhance HIV-1
repli-cation in nonproliferating cells (
33
,
39
,
40
), at least in part through
assisting with viral nuclear import (
30
,
41
,
42
).
Primate immunodeficiency viruses replicate most
effi-ciently in activated CD4
⫹T cells, which generate the majority
of virions
in vivo
(
43
,
44
). Resting CD4
⫹T cells derived from
peripheral blood are refractory to productive infection (
7
,
45–
48
) but can be rendered permissive to productive infection by
common gamma-chain cytokines, including interlukin-2 (IL-2),
IL-4, IL-7, and IL-15, without inducing activation or
activation-induced proliferation (
49–51
). During early HIV-1 infection in
humans and acute simian immunodeficiency virus (SIV)
infec-tion of rhesus macaques, many viral RNA-positive cells lack
acti-vation and proliferation markers and thus resemble resting CD4
⫹T cells (
52–58
). Infected nonactivated, nonproliferating CD4
⫹T
cells have been identified in high numbers near the sites of
muco-sal transmission (
53
,
57
) and in lymphoid tissues (
59
) and are
observed after
ex vivo
infection of lymphoid histocultures (
55
,
60–63
). These findings indicate that local environmental factors,
Received16 July 2013 Accepted9 September 2013
Published ahead of print18 September 2013
Address correspondence to David N. Levy, [email protected].
Supplemental material for this article may be found athttp://dx.doi.org/10.1128 /JVI.01939-13.
Copyright © 2013, American Society for Microbiology. All Rights Reserved.
doi:10.1128/JVI.01939-13
on November 7, 2019 by guest
http://jvi.asm.org/
such as common gamma-chain cytokines, contribute to virus
rep-lication in these cells (
55
,
57
,
60
,
64–66
). Common gamma-chain
cytokines provide a useful and convenient system for studying
HIV-1 replication in nonactivated, nonreplicating, permissive T
cells.
We have previously examined gene expression in activated
pri-mary CD4
⫹T cells and in transformed CD4
⫹T cells coinfected
with integrase-wild-type (Int-WT) and integrase-defective viruses
(
67
). We found that complementation of the integrase mutant
virus by the WT virus allowed the mutant to complete its
replica-tion cycle (
67
). In the present study, we examined uDNA gene
expression in primary resting CD4
⫹T cells rendered permissive to
productive HIV-1 infection by cytokine treatment. We found that
when infected cells were subsequently activated, uDNA HIV-1
functioned as a template for
de novo
virus production without the
assistance of an integrated helper virus. Vpr was essential for gene
expression and virus production in these cells. We also observed
that integration-inhibited HIV-1 DNA established a latent
reser-voir in cytokine-treated resting CD4
⫹T cells from which virus
production could be recruited several weeks after infection.
MATERIALS AND METHODS
Viruses.The viruses used are summarized in Fig. S1 in the supplemental material, and most have been described before, including those with mu-tations in the envelope, integrase, andvprgenes (67–69). All reporter viruses were constructed using the HIV-1 NL4-3 backbone (70). Virus names have been shortened from prior publication nomenclature (67,69) (see Fig. S1 in the supplemental material for the full names). Infectious virions were generated by polyethylenimine (PEI; Sigma) transfection (71) of 293T cells as described previously (67).envgene-defective viruses were pseudotyped with the HIV-1 NL4-3 envelope by cotransfection of 293T cells with a plasmid expressing the NL4-3 envelope, as described previously (67,69). Vpr complementation was achieved by coinfection with a Vpr-positive (Vpr⫹) virus containing an N136Y inactivating mu-tation in reverse transcriptase (72) (seeFig. 7CandD). Failure to express RNA from this virusde novowas documented by flow cytometry and quantitative reverse transcription-PCR (qRT-PCR) for viral RNA (un-published data). Design of plasmid construction strategies was greatly facilitated by the Apple OS X program DNA Strider (73). When down-stream quantitative PCR (qPCR) analysis for HIV-1 DNA was to be per-formed, virus stocks for infection were filtered through a 0.45- m-pore-size filter and then treated with Benzonase (Novagen), as per the manufacturer’s instructions, at 25 units/ml for 30 min at 37°C, followed by inactivation at⫺80°C overnight.
Cells.CD4⫹T cells were prepared by negative selection from the pe-ripheral blood of healthy donors using a Dynabeads Untouched CD4 magnetic bead separation kit (Invitrogen), as previously described (67). Purified cells were routinely ⱖ99% small, CD4⫹, CD25⫺, CD38⫺, CD69⫺, and HLA-DR⫺quiescent T cells. Blood was purchased from the New York Blood Center or was collected after informed consent of the donors and with approval of the New York University Institutional Re-view Board. Purified CD4⫹T cells were cultured at 2⫻106cells per ml in
Gibco Advanced RPMI 1640 with 10% fetal bovine serum (HyClone) plus penicillin and streptomycin (Gibco) and 50 M -mercaptoethanol (Sigma). Where indicated, the following cytokines were added to the cul-ture medium every 2 days: IL-4 (25 ng/ml; R&D Systems), IL-7 (2 ng/ml [seeFig. 3] or as indicated inFig. 4; R&D Systems), IL-15 (25 ng/ml; BioVision), or IL-2 (50 U/ml; obtained from NIH). Where indicated, cells were activated with Dynabeads Human T-Activator CD3/CD28 (Invitro-gen), as per the manufacturer’s instructions, for the amount of time indi-cated below. IL-2 (50 U/ml) was added 24 h after bead stimulation, and beads were magnetically removed on the second day. Where indicated, prostratin (Pro; 330 nM; Santa Cruz Biotechnology) and trichostatin A (TSA; 130 nM; Fisher) were applied 2 days prior to analysis.
Infections. The titers of the virus stocks were determined using TaqMan qRT-PCR for HIV-1 RNA (target in integrase) and normalized to a nominal 400 virion equivalents per cell for infection. Infections were performed by spinoculation (74) in the presence of 5g/ml DEAE dex-tran (Sigma) for 2 h at 1,200⫻gand 37°C. T cells were incubated for 2 additional hours and then treated with trypsin-EDTA and extensively washed to remove residual virions and carry-over plasmid DNA. Control infections performed without spinoculation resulted in lower infection frequencies but qualitatively similar results as spinoculation (unpublished findings), consistent with prior reports (74). Where indicated, reverse transcriptase inhibitors zidovudine (AZT) and efavirenz (1g/ml each) were applied at the time of infection and replenished in culture every 2 days. Where indicated, indinavir sulfate (2M) was applied to cells within 12 h of infection and replenished in culture every 2 days. Where indicated, the integration strand transfer inhibitor (InSTI) raltegravir (RAL; 1M or as indicated below) (75) was applied to the cells at the time of the infection and replenished in culture every 2 days. Unless specified otherwise, ralte-gravir was present during the entire time of the indicated experiments. All antiretrovirals were obtained from the NIH AIDS Research and Reference Reagent Program.
HIV-1 transmission assay.T cells were infected with the indicated virus in the presence or absence of raltegravir (1M). Seven days after infection, eFluor670-positive (eFluor670⫹) yellow fluorescent protein (YFP)-positive (YFP⫹) T cells were sorted to 100% purity and then cocul-tured at the ratio indicated below with uninfected IL-4-treated CD4⫹T cells labeled with CellTrace Violet (CTV; eBioscience). eFluor670 was from Invitrogen. During this mixing phase, the raltegravir was removed to allow integration of viruses infecting target cells. eFluor670-negative, CellTrace violet-positive target cells were gated on in order to measure YFP expression in postacquisition analysis. The coculture was performed in the presence of anti-CD3/CD28 activation beads (Invitrogen) plus IL-2 over 3 days, with or without the indicated antiretroviral controls. Indina-vir (2M) and T-20 (10g/ml) were added after sorting to a subset of cells to block superinfection prior to DNA PCR analysis.
Flow cytometry.Flow cytometry was performed on a Becton, Dickin-son FACSort flow cytometer upgraded by Cytek Development, Fremont, CA, to contain 488-nm, 407-nm, and 637-nm lasers and 5 fluorescence detectors. Green fluorescent protein (GFP) and YFP were detected in FL-1 and FL-2 using 510/21-nm and 550/30-nm filters, respectively, and a 540-nm short-pass dichroic splitter. Cyan fluorescent protein (CFP) was detected using a 575/15-nm filter off the 407-nm laser. Compensation was applied during data collection on the basis of single-color controls. Data collection was with CellQuest Pro software for Mac OS X (BD Biosci-ences). Flow data were analyzed using FlowJo (version 9) software for Mac OS X (Tree Star). Proliferation analysis was performed using eFluor670 (eBioscience) or CellTrace Violet (Invitrogen). CD4 and CD45RO bodies were purchased from BD Pharmingen. CD45RA and CCR7 anti-bodies were purchased from BioLegend. Intracellular staining for p24 was performed with a phycoerythrin (PE)-conjugated HIV-1 p24Gag anti-body (KC57-RD1; Beckman Coulter) on cells treated with a Cytofix/Cy-toperm kit (BD Bioscience). Antibody specificity was assessed with an isotype control IgG1-PE monoclonal antibody from BD Pharmingen. Fixation and permeabilization of cells resulted in a 1-log-unit reduction in GFP/YFP fluorescence. Cell sorting was performed using a BD FACSAria flow cytometer at the New York University Medical Center Flow Cytom-etry Core Facility.
HIV-1 recombination assay.The HIV-1 recombination assay has been previously described (67,69). In this system, heterozygous virions containing genomes from both YFP and CFP reporter viruses undergo recombination to generate a reporter gene that produced GFP fluores-cence in target cells. Infection of cells with a mixture of homozygous YFP and CFP reporter viruses produces little or no GFP fluorescence (69); thus, the appearance of GFP fluorescence in target cells positively demon-strates both recombination and the occurrence of a second round of HIV-1 replication. Modifications for this study were as follows: 375,000
on November 7, 2019 by guest
http://jvi.asm.org/
IL-4-treated resting CD4⫹T cells were infected with single-color YFP or CFP reporter viruses or coinfected with equal amounts of both. Raltegra-vir treatment of some cultures was maintained throughout the experi-ment. At 7 days after infection, 375,000 uninfected IL-4-treated resting CD4⫹T cells were added to each sample to provide more targets for virus transmission. At 11 days after infection, T cells were activated with anti-CD3/CD28 beads plus IL-2 for 2 days, and then the cultures were analyzed by flow cytometry, as described previously (67).
Quantification of HIV DNA and RNA.DNA from cells infected with Benzonase-treated viruses was purified using a DNeasy Blood & Tissue minikit or an AllPrep minikit (Qiagen) with RNase A (Sigma) digestion. Quantitative real-time PCR for DNA analysis was performed using a QuantiTect Probe PCR kit (Qiagen). Primers and TaqMan probes were purchased from Integrated DNA Technologies. Amplification and detec-tion were performed on a Chromo4 real-time PCR machine (Bio-Rad), and the data were analyzed using the manufacturer’s Opticon Monitor 3 software.
Quantification of total HIV DNA was performed using forward primer ZXF F (5=-AAGTAGTGTGTGCCCGTCTGT-3=), reverse primer ZXF R (5=-GCTTCAGCAAGCCGAGTC-3=), and probe ZXF (5=-56- FAM-TGTGACTCT-ZEN-GGTAACTAGAGATCCCTCAGACCC-3IABlk_FQ-3=, where FAM is 6-carboxyfluorescein, ZEN is an internal quencher (Integrated DNA Technologies [IDT]), and 3IABlk_FQ is the 3= Iowa black FQ quencher) (76). Quantification of 2-LTR circles was per-formed using forward primer 2L-f2 (5=-TGTTGTGTGACTCTGGTAACTA GAGATCCC-3=), reverse primer 2L-r2 (5=-GATATCTGATCCCTGGCCCT GG-3=), and probe 2L-z2 (5=-56-FAM-CCACACACAAGGCTACTTCCCT GATTGGCA G-3IABlk_FQ-3=).
Sequences for the 2-LTR primer were kindly provided by Dimitrios Vatakis and Jerome Zack, UCLA.
-Globin was detected with the primers and probes described previ-ously (76) and was used for normalization of the total number of HIV-1 DNA copies per cell and the number of 2-LTR HIV-1 DNA copies per cell. Standardization for quantification of total HIV-1 DNA was performed with 10-fold serial dilutions of genomic DNA extracted from Jurkat cells containing 2 integrated HIV-1 NL4-3 proviruses. Standardization for quantification of 2-LTR circles was performed using serial dilutions of a plasmid containing a single copy of the 2-LTR PCR target.
Quantification of integrated HIV DNA byAluPCR.Detection of integrated HIV-1 DNA was performed using a modification of the previ-ously describedAluPCR technique (67,77,78). The first PCR was per-formed using forward primer AluI (5=-TCCCAGCTACTGGGGAGGCT GAGG-3=, 40 nM) (77) and reverse primer gag2 (5=-GCTCTCGCACCC ATCTCTCTCC-3=, 400 nM) (78), or a control PCR was performed using the gag2 reverse primer only.
The following thermal cycling program was used: step 1, 95°C for 15 min; step 2, 93°C for 30 s; step 3, 60°C for 60 s; step 4, 70°C for 1 min 40 s; steps 2 through 4 were repeated 24 times.
The PCR product from the first PCR was diluted 10 times in nuclease-free water before addition to a new 96-well plate for second-round nested kinetic PCR. The second PCR amplification employed the internal ZXF primers and probe described above.
The second PCR used the following thermal cycling program: step 1, 95°C for 15 min; step 2, 94°C for 15 s; step 3, 60°C for 30 s; step 4, fluorescence data collection; and step 5, return to step 2, which was run 49 times.
A standard curve representing integrated HIV sequences was gener-ated from 10-fold dilutions of genomic DNA containing a known quan-tity of integrated HIV-1 DNA. To prepare the integration standard (IS), Jurkat cells were infected with envelope-defective, vesicular stomatitis vi-rus glycoprotein G-pseudotyped HIV-1 conferring resistance to puromy-cin, pNLpuro⌬vpr (34), and selected in puromycin (2g/ml; Sigma) for ⱖ2 weeks. The pNLpuro⌬vpr virus stock was filtered and Benzonase treated as described above. Genomic DNA was extracted using a Gentra PureGene kit (Qiagen). The HIV-1 DNA content (number of viral copies
per cell) was quantified by qPCR with ZXF primers, with the results nor-malized using standardization to the-globin gene level. The standard ranged from 2,500 integration copies per 1,000 total cells to 2.5 copies per 1,000 cells. To each serial dilution of IS was added genomic DNA from uninfected Jurkat cells to bring the total DNA content to 1,000 cell equiv-alents perl.
A Studentttest was performed to compare the cycle threshold (CT)
values fromAlu-gagandgag-only amplification replicates, and the aver-age integration event values were determined according to the IS. If no statistically significant difference was observed in the samples, indicating that the number of integration events was below the sensitivity of the assay, we monitored individual PCR replicates for the occurrence of Alu-gagamplification that reached aCTvalue lower than that for thegag-only
replicates by at least 2 standard deviations of thegag-only amplifications. In all the experiments where integration was inhibited by RAL treatment or the D116N mutation, the level of integration was based on the IS, but the positive integration values were not statistically significant. On the basis of the IS and the number of cells analyzed in multiple (ⱖ6) repli-cates, the sensitivity of our assay was minimally 1 integrated provirus per 300 (seeFig. 1G) and 140 (seeFig. 6D) cells, allowing an upper limit of integration to be assigned. InFig. 6D, integration was detected with sta-tistical significance when transmission was not inhibited.
qRT-PCR for quantification of virus stocks and virus output in su-pernatants from infected cells.RNA was isolated from virus-containing culture medium using an RNeasy minikit (Qiagen) with on-column DNase digestion (40 min). Quantitative real-time RT-PCR for RNA was performed with a QuantiTect Probe RT-PCR kit (Qiagen). qRT-PCR was performed using primers and TaqMan probes (Integrated DNA Technol-ogies) specific for a shared region of integrase RNA sequence and a QuantiTect Probe RT-PCR kit (Qiagen). Quantification of HIV-1 RNA was performed against serial 10-fold dilutions of a synthetic RNA mole-cule containing the integrase target (67) using forward primer FL-U Sense CAATTTCACCAGTACTACAGTT-3=), reverse primer FL Sense (5=-GAATGCCAAATTCCTGCTTGA-3=) (79), and probe FL-U (5=-56-FA M-AAGGCCGCC-ZEN-TGTTGGTGGGCG-3IABlk_FQ-3=).
Control assays for DNA carryover were routinely performed and were either completely negative or containedⱕ1/40,000 RNA molecules.
qRT-PCR for quantification of fully spliced HIV RNA in infected cells.RNA was isolated from cells using an RNeasy minikit (Qiagen). Quantitative real-time RT-PCR for RNA was performed with a Quanti-Tect Probe RT-PCR kit (Qiagen). qRT-PCR was performed using primers and TaqMan probes detecting fully spliced RNA specific for NL4-3 HIV. Quantification of FS HIV RNA was performed against serial 10-fold dilu-tions of a synthetic RNA molecule containing the fully spliced (FS) target using forward primer DNL 287 (5=-GGAGACAGCGACGAAGAGC-3=), reverse primer DNL 288 (5=-CTCTCCACCTTCTTCTTCTATTCC-3=), and probe DNL 289 (5=-56-CATCAGAACAGTCAGACTCATCAAGCT TCTCTATCAAAG-3IABlk_FQ-3=).
p24Gag enzyme-linked immunosorbent assay (ELISA) was performed by the Aaron Diamond AIDS Research Center using a PerkinElmer Alli-ance p24 HIV-1 antigen ELISA kit according to the manufacturer’s in-structions on triplicate serial dilutions of culture supernatants (see
Fig. 2F). RESULTS
This study employed a series of HIV-1 reporters containing a
fluorescent reporter gene (GFP, YFP, or CFP) expressed
coor-dinately with the early/late gene
nef
(see Fig. S1 in the
supple-mental material) (
67
,
69
). Experiments in which it was
desir-able to limit infection to a single round (see
Fig. 1
to
5
and
7
)
employed
env
gene-defective viruses that were pseudotyped
with an HIV-1 envelope protein. When HIV-1 transmission
was examined (see
Fig. 6
and Fig. S5 in the supplemental
ma-terial), the viruses expressed HIV-1 envelope protein from the
native virally encoded
env
gene.
on November 7, 2019 by guest
http://jvi.asm.org/
6% 2%
2%
17% 12%
7% 6%
1.2%
1.7%
Post-activation
Int-WT
Int-WT + RAL
GFP
SSC
Int-D116N
Bright Dim Pre-activation infection
IL-4 infection
5.1%
0.05%
0.03%
0.03%
0.03%
14% 8.7%
2.4% 2.8% MCF 1488
MCF 706
MCF 667
B
C
V
irus output
(percentage of 0
μ
M RAL)
Cmin Cmax
Pre-activation Post-activation
D
0 5,000 10,000 15,000 20,000 25,000 30,000
Int-WT Int-WT + RAL D116N
V
irions / µL
E
0 1 2 3 4
IL-4 Post IL-4 Post IL-4 Post
Copies / cell
Int-WT Int-WT + RAL D116N
<0.007
<0.010 <0.003 ND
G
A
F
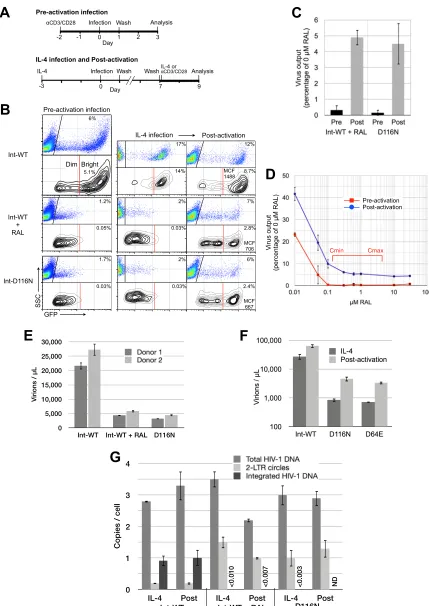
FIG 1De novovirus production from unintegrated HIV-1 when T cell activation follows infection. (A) Schematic of the protocols for infection and analysis of CD4⫹T cells either activated with anti-CD3/CD28 activation beads plus IL-2 prior to infection (preactivation) or treated for 3 days with IL-4 prior to infection (IL-4 infection) and every 3 days thereafter and then activated 7 days after infection (postactivation) or maintained unactivated in IL-4 throughout. Viruses were envgene defective and pseudotyped with the HIV-1 envelope for a single round of infection. (B) Flow cytometric analysis of infected cells. Dot plots display all
on November 7, 2019 by guest
http://jvi.asm.org/
[image:4.585.77.506.71.677.2]High-level gene expression and
de novo
virus production
from integration-inhibited HIV-1 when T cell activation
fol-lowed infection.
Initial tests indicated that among the cytokines
IL-2, IL-4, IL-7, and IL-15, IL-4 primed resting peripheral blood
CD4
⫹T cells for HIV-1 infection as well as or better than the other
cytokines (not shown; see
Fig. 3
) while consistently inducing the
least cell proliferation over the widest range of concentrations
for cells from multiple donors. IL-4 upregulates CXCR4 on CD4
⫹T cells (
80
,
81
) and increases HIV-1 expression in CD38
⫹resting
T cells (
82
,
83
), and in tonsils, IL-4 has been shown to increase the
permissiveness of resident CD4
⫹T cells to HIV-1 infection (
61
).
Based on these properties, we chose IL-4 stimulation as the model
system for the majority of the following studies.
We compared HIV-1 gene expression following infection of
IL-4-treated primary peripheral blood CD4
⫹T cells with
acti-vated CD4
⫹T cells. CD4
⫹T cells from the peripheral blood
mononuclear cells of healthy HIV-negative donors were
nega-tively selected using Dynabeads Untouched magnetic beads
(In-vitrogen), yielding a population that was consistently
ⱖ
99%
small, CD4
⫹, CD25
⫺, CD28
⫺, CD38
⫺, CD69
⫺, and HLA-DR
⫺resting T cells. One set of cells was activated 2 days prior to
infec-tion with anti-CD3/CD28 beads plus IL-2, a condiinfec-tion that we
refer to as “preactivation” (
Fig. 1A
). These cells were
phenotypi-cally activated (CD25
⫹, CD28
⫹, CD69
⫹, HLA-DR
⫹) and
prolif-erating at the time of infection (data not shown). In the second
instance, we applied IL-4 to the resting T cells for 3 days prior to
infection, a condition that we refer to as “IL-4 infection,” and then
activated these cells 5 or more days after infection, a procedure
that we refer to as “postactivation” (
Fig. 1A
). IL-4-treated T cells
were
ⱖ
98% small, CD25
⫺, CD28
⫺, CD38
⫺, CD69
⫺, and
HLA-DR
⫺and showed a 1% increase in activation from the level for
freshly isolated resting cells (not shown). The postactivation
pro-tocol was designed to simulate the
in vivo
situation in which an
infected resting T cell is stimulated via its T cell receptor during an
adaptive immune response. This sequence of events has been
pro-posed to aid the spread of HIV-1 from sites of transmission
(
59
,
64
).
As we have previously observed using these reporter viruses
(
67
), infection of preactivated CD4
⫹T cells with GFP reporter
virus with the wild-type integrase (Int-WT) generated a majority
GFP
⫹bright population of cells as well as a minority GFP
⫹dim
population (
Fig. 1B
, left). Our prior study demonstrated that the
GFP
⫹bright cells contain at least one integrated provirus per cell
and are thus the virus-producing population, while most of the
GFP
⫹dim cells contain only unintegrated genomes (
67
). When
integration was inhibited, either by applying the integrase
inhibi-tor raltegravir (RAL) (
75
) during infection with the Int-WT virus
or by infecting cells with a reporter virus containing a mutant
integrase gene (Int-D116N), only GFP
⫹dim cells were generated
in preactivated cells. Cells infected with Int-WT viruses in the
presence of raltegravir (
84
) and cells infected with D116 active-site
HIV-1 mutants (
85
,
86
) display 2- to 3-log and 3- to 4-log
reduc-tions in integration, respectively. It is worth pointing out that
these observations are enabled by the fact that the reporter gene
(GFP) is coordinately expressed with
nef
during the early phase of
HIV-1 gene expression. HIV-1 reporter systems in which the
re-porter gene is expressed as a late gene (
87–90
) do not permit the
examination of reporter expression from unintegrated DNA
fol-lowing infection of preactivated T cells.
Infection of IL-4-treated T cells generated GFP expression in a
pattern similar to that for preactivated cells, the salient feature
being the absence of GFP
⫹bright cells produced by infection with
RAL-treated or Int-D116N HIV-1 (
Fig. 1B
, middle). Surprisingly,
when we induced T cell activation in these infected IL-4-treated
cells
ⱖ
5 days subsequent to infection, a substantial population of
GFP
⫹bright cells that we had never previously observed under
any conditions was generated by integration-inhibited HIV-1
(
Fig. 1B
, right). The proportion of GFP
⫹bright cells generated by
infection with RAL-treated and D116N mutant HIV-1 isolates
was less than that produced by untreated Int-WT viruses (28% to
32% of the frequency for Int-WT virus), but they were still
⬎
10-fold too frequent to be the result of integration, according to
in-tegration frequencies after raltegravir treatment or treatment with
Int-D116N mutants published previously (
84–86
). Though they
also had GFP fluorescence 2.1- to 2.2-fold lower than that of the
Int-WT (no RAL treatment) GFP
⫹bright cells, their presence
nevertheless suggested the possibility of
de novo
HIV-1
produc-tion from unintegrated HIV-1.
Indeed, the postactivation protocol resulted in
de novo
HIV-1
synthesis from both Int-D116N and RAL-treated Int-WT HIV-1
at a rate about 5% of that from untreated Int-WT HIV-1 (
Fig. 1C
).
De novo
virus production from RAL-treated and D116N HIV-1
infections was statistically zero using the preactivation protocol.
Across all experiments, the postactivation output from
RAL-treated and D116N HIV-1 bulk cultures varied between 5% and
15% of that for untreated Int-WT virus (e.g., see
Fig. 2D
). The
nearly identical results from the Int mutant and RAL-treated
HIV-1 infections functioned to mutually confirm these results;
cells, while the contour plots present only GFP⫹cells, in order to more clearly illustrate the appearance of the GFP⫹bright populations. Data are representative of⬎5 independent experiments. SSC, side scatter; MCF, mean channel fluorescence. (C)De novovirus output measured by qRT-PCR for HIV-1 RNA in culture supernatants. Data represent averages and SDs from 3 independent experiments. The nonspecific release of virions from the initial inoculum was determined with a reverse transcriptase inhibitor control and was subtracted from the output obtained with no reverse transcriptase inhibitor. Reverse transcriptase inhibitor controls wereⱕ10% of the WT virus output. Data are expressed as a percentage of the virus output from T cells infected with Int-WT virus without RAL treatment. (D) RAL titration under preactivation and postactivation conditions. Virus output is expressed as a percentage of the output from Int-WT (non-RAL-treated) HIV-1, as described for panel C. Data represent averages and SDs from 3 independent experiments.CminandCmax, minimum and maximum
concentrations, respectively. (E) Virus production from FACS-purified GFP-infected T cells. IL-4-treated resting CD4⫹T cells were infected with Int-WT GFP reporter HIV-1 with and without raltegravir treatment (1M) or with Int-D116N GFP reporter HIV-1. Viruses wereenvdefective and pseudotyped with the HIV-1 envelope for a single round of infection. At 15 days after infection, GFP-positive cells were purified by FACS and then activated for 2 days with anti-CD3/CD28 activation beads plus IL-2. Raltegravir was removed prior to sorting. Virion production was analyzed by qRT-PCR for viral RNA. Data are from 2 independent experiments utilizing cells from 2 donors. (F) Comparison of two active-site integrase mutants. Cells were infected with Int-D116N or Int-D64 HIV-1 as described in panel A and the legends to panel C, and virus output was analyzed by qRT-PCR. (G) Analysis of HIV-1 DNA within GFP⫹sorted cells before and after T cell activation. DNA from 3⫻104to 10⫻104T cells from the experiment whose results are shown in panel E (donor 1) was extracted before
and after anti-CD3/CD28⫹IL-2-induced T cell activation. Viral DNA was analyzed by qPCR for total HIV-1 DNA, 2-LTR circles, and integrated DNA (see Materials and Methods). ND, none detected.
on November 7, 2019 by guest
http://jvi.asm.org/
0 2 4 6 8 10 12 14
Pre IL-4 Post
V
irus output
% of Integrating
Pre-Activation infection IL-4 infection and Post-activation
A
B
C
E
αCD3/CD28
eFluor670Infection Analysis
-2 0 1 3
Day
2 -1
Wash
-3 0 7 9
IL-4
Infection Analysis
Day
Wash Wash
eFluor670
IL-4 or
αCD3/CD28
1 10 100 1,000 10,000 100,000
Int-WT Int-WT + RAL D116N
V
irions / μL
IL-4 infection Post-activation
eFluor670
GFP GFP GFP GFP
p24Gag
Int-WT Int-WT + RAL Int-WT Int-WT + RAL
12% 7.2% 5.8% 7.9%
eFluor670
7.4% 0.2% 3.7% 3.8%
0.3 11 1.6
0.2 0.9 2.4
0.3 3.6 1.3
0.4 2.8 3.4 Pre-activation infection
eFluor670
p24Gag
p24Gag
GFP GFP
p24Gag
Late
Early
Int-WT Int-WT + RAL
eFluor670
3.5% 1.2%
2.3% 0.01%
0 0.01 0.3 0.03 1.4
0.7
F
0 10,000 20,000 30,000 40,000 50,000
Int-WT Int-WT + RAL D116N
V
irions /
μ
L
ND ND
G
D
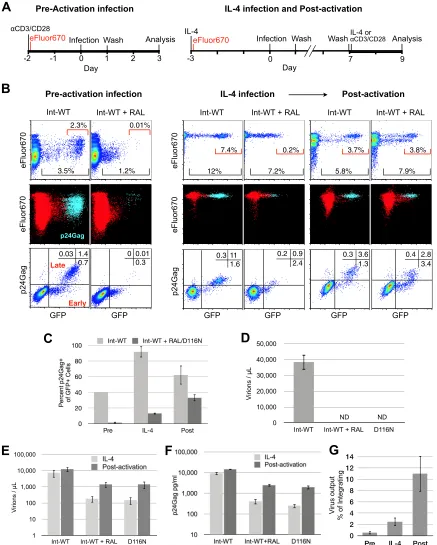
FIG 2De novoHIV-1 production from unintegrated templates is associated with a block in T cell proliferation. (A) Schematic of the protocols for infection and analysis of CD4⫹T cells. The protocols are identical to those shown inFig. 1A, except for the addition of eFluor670 staining. Viruses wereenvdefective and pseudotyped with HIV-1 envelope for a single round of infection. (B) Simultaneous analysis of cells for proliferation and GFP and intracellular p24Gag expression by flow cytometry. (Top row) Cells were analyzed without permeabilization/fixation, as described in the legend toFig. 1, for cell proliferation and GFP expression; (middle and bottom rows) cells were fixed and permeabilized for intracellular staining for p24Gag, which reduces GFP fluorescence but does not affect eFluor670; (middle row only) p24Gag⫹cells are highlighted in light blue, with p24Gag-negative cells shown in red; (bottom row only) cells with viruses in early gene expression are GFP⫹p24Gag negative (lower right quadrant), while cells with viruses in late gene expression that are producing HIV-1de novoare GFP⫹p24Gag⫹(upper right quadrant). (C) Efficiency of transition into late gene expression measured as the percentage of the GFP⫹cells that are also p24Gag⫹. Data represent the averages and SDs of two experiments. (D) Virus production under preactivation conditions measured by qRT-PCR. The output of control virus treated with reverse transcriptase inhibitor determined by qRT-PCR in Int-WT, RAL-treated, and D116N HIV-1 infections was 7.1%⫾0.3% of that from
on November 7, 2019 by guest
http://jvi.asm.org/
[image:6.585.75.512.82.627.2]however, in order to ensure that RAL was being used optimally, we
performed a dose-response assay under preactivation and
postac-tivation conditions, employing a 3,000-fold titration going from
partial activity to the maximal dose achievable without significant
cell toxicity (
Fig. 1D
). RAL was maximally effective at
⬎
0.3
M,
and no further inhibition of virion production or decrease in
GFP-positive (GFP
⫹) cells (see Fig. S2 in the supplemental
mate-rial) was observed at higher doses. RAL treatment of Int-D116N
mutant-infected cells failed to reduce the appearance of GFP
⫹cells further (see Fig. S2 in the supplemental material). In all cases,
application of reverse transcriptase inhibitors prevented the
ap-pearance of GFP
⫹cells, irrespective of virus or cell status (see Fig.
S2 in the supplemental material).
In order to perform a direct cell-to-cell comparison between
Int-WT, RAL-treated, and Int-D116N HIV-1, we sorted GFP
⫹cells from the IL-4 infection condition and then activated these
virus-expressing cells with anti-CD3/CD28 beads. Two days
fol-lowing activation, virus output from the sorted GFP
⫹cells
in-fected with RAL-treated Int-WT or Int-D116N HIV-1 was
be-tween 14.8% and 21.5% of the production from Int-WT HIV-1 on
a per cell basis (
Fig. 1E
). As expected, a second integrase active-site
mutant, the D64E mutant, yielded results essentially identical to
those for the Int-D116N mutant (
67
,
91
) (
Fig. 1F
).
We next performed DNA analysis of the GFP
⫹sorted cells to
directly test whether integrated proviruses could be the source of
de novo
virus production under conditions of RAL treatment and
D116N mutation. We measured between 2 and 3.5 total copies of
HIV-1 DNA per GFP
⫹cell (
Fig. 1G
), and cells infected with
Int-WT virus contained a single integrated provirus per cell. In
contrast, the RAL-treated cells and the D116N mutant-infected
cells contained at most 100 to 300 times fewer integrated genomes,
a rate of integrase-independent integration consistent with that
found in prior studies (
84–86
) and a level of integration too low to
be a significant contributor to either the appearance of GFP
⫹bright cells (or the p24Gag-positive [p24Gag
⫹] cells; see below) or
the
de novo
level of virus production observed. Raltegravir was
removed from raltegravir-treated cells on the day of cell sorting
and activation, yet integration did not follow, consistent with the
irreversibility of RAL binding to and inhibition of preintegration
complexes (PICs) (
3
). Consistent with the findings of prior studies
(
92–95
), 2-LTR circles were increased severalfold when
integra-tion was inhibited by RAL treatment or integrase mutaintegra-tion.
Im-portantly, no increase in either total DNA, 2-LTR circles, or
inte-gration was observed following T cell activation (
Fig. 1G
,
postactivation conditions), indicating that
de novo
virus
produc-tion from unintegrated DNA did not result from compleproduc-tion of
delayed reverse transcription, nuclear import, or integration
oc-curring subsequent to T cell activation (preintegration latency)
but, rather, was the result of gene expression from the
uninte-grated DNA itself. 2-LTR circles are formed exclusively following
nuclear import of the preintegration complex (
96–98
); thus, their
steady state before and after T cell activation indicates that this
process is completed prior to activation. We did not, however,
parse the contribution of linear unintegrated DNA or 1-LTR and
2-LTR circles to virus production.
De novo
HIV-1 production from unintegrated templates is
associated with a block in T cell proliferation.
We next examined
cell proliferation, GFP expression, and virion production
simul-taneously at the single-cell level by flow cytometry (
Fig. 2A
).
Pro-liferation was measured by dilution of eFluor670 staining during
cell division, and virion production was detected within cells by
intracellular p24Gag staining (light blue dots in the middle row of
Fig. 2B
). Viruses in the early (Rev-independent) phase of HIV-1
gene expression express only early proteins, including GFP, while
cells in the late, Rev-dependent productive phase express late
pro-teins, including both GFP and p24Gag.
eFluor670 dilution (
Fig. 2B
, top 2 rows) revealed that infection
of preactivated cells with Int-WT HIV-1 yielded GFP-positive
cells that multiplied but did so fewer times than the GFP-negative
cells (
Fig. 2B
). This finding is consistent with the previous finding
that Vpr inhibition allows at least one round of cell division after
infection of preactivated T cells (
36
). On the other hand, at 7 days
after infection, IL-4-treated cells showed little proliferation (
Fig.
2B
) and GFP
⫹cells had not proliferated at all. Postactivation of
these cells resulted in the proliferation of the GFP-negative and the
GFP
⫹p24Gag-negative (p24Gag
⫺) cells but not of the p24Gag
⫹cells, whether or not integration had been inhibited by raltegravir.
Postactivated GFP
⫹growth-arrested cells were enriched in the
G
2/M phase, which is consistent with Vpr-induced growth arrest
(see Fig. S3A in the supplemental material) (
36
). This failure to
divide even one time occurred despite successful activation of the
GFP
⫹cells, as measured by an increase in cell size and increased
expression of the activation markers CD25, CD38, and CD69 that
was similar to that of activated GFP-negative cells (see Fig. S3B in
the supplemental material). Thus, inhibition of cell division by
both integrated and unintegrated HIV-1 occurs through a known
mechanism (Vpr-induced growth arrest; see below) that does not
apparently interfere with T cell activation, at least by use of the
criteria measured here.
When p24Gag staining was plotted against GFP expression
(
Fig. 2B
, bottom row), the division between early (GFP
⫹p24Gag
⫺) and late (GFP
⫹p24Gag
⫹) expression was evident.
There was a 140-fold reduction in p24Gag
⫹cells when integration
was inhibited in preactivated cells (1.4% versus 0.01%), consistent
with the
ⱖ
2-log reduction of integrated proviruses measured in
Fig. 1G
as well as the repeated finding that
de novo
virus
produc-tion in preactivated cells requires integraproduc-tion (
Fig. 2D
) (
20
,
22
,
67
;
reviewed in references
17
and
21
). On the other hand, in
IL-4-treated cells and postactivated cells, there was an increase in late
p24Gag expression compared with that in preactivated cells (
Fig.
2B
and
C
) whether or not integration was inhibited. The high
number of p24Gag
⫹cells generated when integration was
inhib-ited by raltegravir is inconsistent with its published ability (
85
,
86
)
to block integration and our measurement of integration by PCR
Int-WT virus infections. Data represent the averages and SDs of 3 independent experiments. (E) Virus production under IL-4 infection and postactivation conditions measured by qRT-PCR. The output of control virus treated with reverse transcriptase inhibitor determined by qRT-PCR in Int-WT, RAL-treated, and D116N HIV-1 infections was 0.23%⫾0.09% of that from Int-WT virus infections treated with IL-4 only and 0.94%⫾0.05% of that from Int-WT virus infections postactivation. Data represent the averages and SDs of 3 independent experiments. (F) p24Gag ELISA of culture supernatants from one representative experiment whose results are shown in panel E. SDs represent multiple replicates of individual samples. (G) Virus production measured by qRT-PCR from RAL-treated Int-WT virus infections expressed as a percentage of the production from Int-WT virus infections not treated with RAL. Data are from 5 independent experiments.
on November 7, 2019 by guest
http://jvi.asm.org/
in
Fig. 1G
. By sheer numbers, the vast majority of p24Gag
expres-sion and virus production in postactivated cells can be the result
only of (late) gene expression from unintegrated templates.
De
novo
virus production was again measured, but this time it was
measured by both qRT-PCR (
Fig. 2E
and
G
) and p24Gag ELISA
(
Fig. 2F
), reaffirming the findings shown in
Fig. 1
and confirming
the validity of our qRT-PCR method. qRT-PCR results from 5
independent experiments are summarized in
Fig. 2G
.
Most of the experiments described in this report utilize
CXCR4-tropic (X4) HIV-1, as these viruses infect cells with a high
efficiency
in vitro
. We treated resting CD4
⫹T cells with IL-15,
which increases CCR5 expression (
99
,
100
), and then infected
them with a CCR5-tropic Int-D116N GFP reporter virus,
obtain-ing similar results for GFP and p24Gag from Int-D116N virus as
with CXCR4-tropic HIV-1, albeit at lower overall infection
fre-quencies (not shown).
IL-2, IL-4, IL-7, and IL-15 all prime resting CD4
ⴙT cells for
de novo
virus production from integrase mutant HIV-1.
In our
preliminary testing, we confirmed the findings presented in prior
reports (
49
,
50
,
81
,
83
) that exposure of resting peripheral blood
CD4
⫹T cells to IL-2, IL-4, IL-7, or IL-15 enhances infection
with-out inducing T cell activation. Prior studies have demonstrated
that cytokines have multiple influences on resting T cells that
in-crease the permissiveness of these cells to HIV-1 replication.
Among these findings are that IL-2 and IL-15 in lymphoid tissues
contribute to infection of naive T cells at least in part by relieving
the block to infection imposed by APOBEC3G (
66
) and that IL-7
drives T cells into the G
1bcell cycle phase that is associated with
permissiveness to infection (
50
). IL-7 enhances HIV-1 infection of
cervicovaginal tissues
ex vivo
(
101
), and IL-7 levels
in vivo
corre-late with and may contribute to the viral load (
102
). IL-2 and IL-7
can reactivate a subset of latent viruses (
103
,
104
), and on the basis
of this property, each has been tested in clinical trials for its
po-tential usefulness in viral eradication therapies (
105
,
106
).
We examined if these cytokines enhance
de novo
virus
produc-tion from Int-D116N HIV-1 similarly to IL-4. In each case, using
a concentration of cytokine that we predetermined to be optimal
for virus production and following the protocol described in
Fig.
1A
, we observed enhanced
de novo
virion production following
the postactivation protocol (
Fig. 3A
). Interestingly, for each
cyto-kine the integrase mutant responded to T cell activation with a
fold induction greater than that for the Int-WT virus (
Fig. 3B
).
Thus, while IL-4 appears to be the most effective cytokine for
postactivation-induced HIV-1 production from Int-D116N
HIV-1, it is not unique in this regard. This may not be surprising,
considering that each of these cytokines belongs to the common
gamma-chain family of cytokines that share signaling pathways
(
107–111
), aid the survival of both resting memory and naive T
cells, and forestall activation-induced cell death (
112–116
).
T cell homeostatic proliferation during the early stage of
vi-ral expression is antagonistic to the generation of virus from
integrase mutant HIV-1.
A well-defined activity of the cytokines
utilized in this study is induction of homeostatic proliferation in a
subset of cells (
109
,
110
,
117
,
118
). While seeking the optimal
concentration of each cytokine, we observed that a subset of T
cells proliferated in a dose-dependent manner in the days after
treatment with each cytokine and prior to HIV-1 gene
expres-sion (not shown). IL-7 displayed a particularly well-defined
and reproducible dose-response, and we obtained an
interest-ing result regardinterest-ing the ability of cells to generate
de novo
HIV-1 (
Fig. 4
). While cell proliferation prior to activation
in-creased with each increasing dose of IL-7 (
Fig. 4A
and
B
), the
0 50 100 150 200 250 300
Ø IL-2 IL-4 IL-7 IL-15 Int-WT
% of Int-WT
+ IL-4
0 5 10 15 20 25 30
Ø IL-2 IL-4 IL-7 IL-15 D116N
0 2 4 6 8 10 12
Ø IL-2 IL-4 IL-7 IL-15
Fold induction
A
B
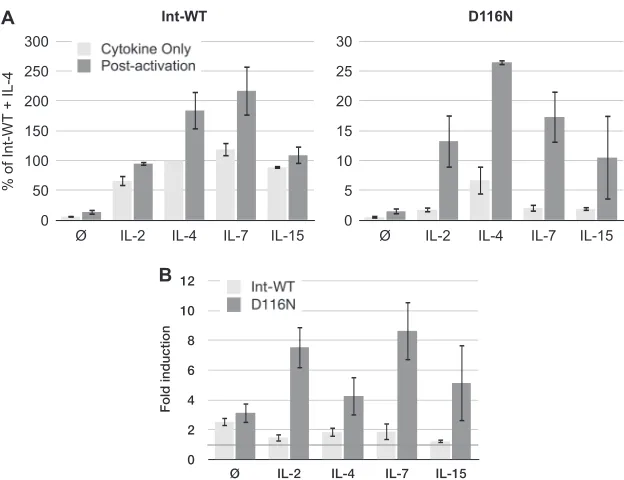
FIG 3Unintegrated HIV-1 generatesde novovirus in resting CD4⫹T cells rendered permissive to HIV-1 infection by cytokines IL-2, IL-4, IL-7, and IL-15. (A) The infection protocol was identical to that described inFig. 1A(resting infection, postactivation) for each cytokine: IL-2 (50 U/ml), IL-4 (25 ng/ml), IL-7 (2 ng/ml), and IL-15 (25 ng/ml). Viruses wereenvdefective and pseudotyped with the HIV-1 envelope for a single round infection. Data represent the averages and interexperimental SDs of 3 independent experiments. Virus outputs are expressed as a percentage of the virus production obtained with nonactivated, IL-4-treated T cells infected with Int-WT virus. (B) Fold induction of virus production following postactivation of infected cells calculated from the data inFig. 3A. The null symbols represent no treatment.
on November 7, 2019 by guest
http://jvi.asm.org/
[image:8.585.136.448.64.304.2]production of GFP
⫹bright cells and nearly maximal
de novo
virus production (
Fig. 4C
) from Int-WT virus were obtained
with almost no homeostatic proliferation induction. The
num-ber of GFP
⫹bright cells and high-level virus production from
Int-WT HIV-1 were maintained (20% drop in virus
produc-tion) as T cell proliferation increased.
In stark contrast, the effect on GFP expression and virus
pro-duction from Int-D116N HIV-1 dropped coordinately with
in-A
B
C
IL-7 ng/ml
0
0.2
1
5
25
50
IL-7
Post-activation
IL-7
Post-activation
Int-WT
D116N
5.6% 12% 21% 20% 15% 9.5%
4.4% 11% 13% 8.3% 5% 2.9%
0.3% 0.4% 0.8% 0.7% 0.6% 0.3%
3.0% 4.0% 5.7% 2.1% 0.5% 0.1%
2.3% 6.8% 14% 16% 12% 7.2%
3.8% 9.3% 10% 6.4% 3.8% 2.1%
0.0% 0.03% 0.02% 0.1% 0.1% 0.0%
1.9% 2.1% 2.3% 0.8% 0.1% 0.02%
0 4000 8000 12000 16000
0 0.2 1 5 25 50
0 75 150 225 300
0 0.2 1 5 25 50
0 50 100 150 200 250 300
GFP+ Bright Cells
0 250 500 750 1000 1250 1500
0 0.2 1 5 25 50 0 0.2 1 5 25 50
% Proliferated
30
25
20
15
10
5
0
D116N
V
irions/μ
L
30
25
20
15
10
5
0 Int-WT
IL-7 ng/ml IL-7 ng/ml
IL-7 ng/ml IL-7 ng/ml
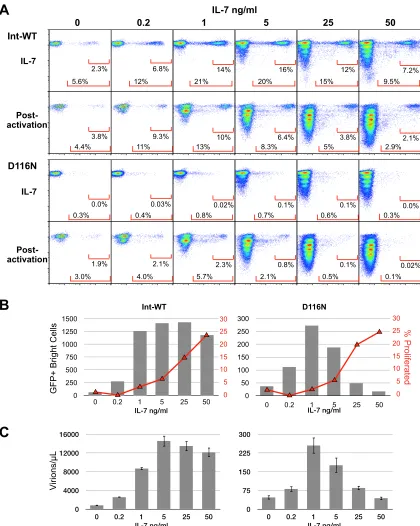
FIG 4T cell homeostatic proliferation is antagonistic to the generation of virus-producing cells infected with Int-D116N HIV-1. The infection protocol was identical to that described inFig. 1A, except that flow cytometry on cells under the IL-7-treated condition was performed on day 7 after infection, 2 days before postactivation analysis. Viruses wereenvdefective and pseudotyped with the HIV-1 envelope for a single round of infection. Data are from one experiment representative of 3 independent experiments. (A) Flow cytometric analysis of GFP expression and cell proliferation before (IL-7, day 7) and after (day 9) postactivation. (B) Percentage of cells that divided at least once before activation (red lines) (calculated using the FlowJo, version 9, proliferation platform) and number of GFP⫹bright cells obtained after postactivation in the experiment whose results are presented in A (bars). (C) Virus output from the cells for which the results are shown in panel A measured by qRT-PCR for HIV-1 RNA in culture supernatants.
on November 7, 2019 by guest
http://jvi.asm.org/
[image:9.585.82.502.66.592.2]creasing IL-7-induced proliferation, strongly suggesting that cell
proliferation soon after infection is antagonistic to
de novo
virus
production from unintegrated HIV-1 but not from integrated
HIV-1. This observation reinforces the notion that unintegrated
HIV-1 expression is facilitated by the absence of host cell
prolif-eration (
17
,
24–26
). The divergence between the behavior of
Int-WT and Int-D116N HIV in response to the various levels of
IL-7-induced homeostatic proliferation emphasizes the
distinc-tive nature of integrated and nonintegrated templates.
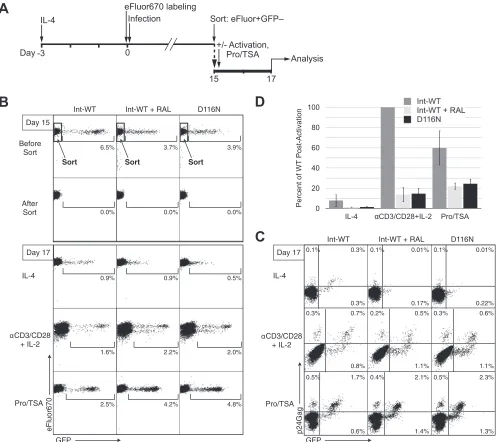
Durable latency is established by unintegrated HIV-1 in
rest-ing CD4
ⴙT cells.
Understanding the various forms of HIV-1
la-tency as well as the mechanisms for the establishment,
mainte-nance, and subsequent activation of latent viruses is necessary for
the development of shock-and-kill therapies intended to clear
la-tently infected cells (
119–121
). HIV-1 gene expression from
la-tently integrated genomes is inducible by T cell activation (
8
,
122–
124
) and by the synergistic activities (
125
,
126
) of protein kinase C
(PKC) activators (
127
) and agents that promote chromatin
re-modeling, including histone deacetylase inhibitors (HDACi),
such as trichostatin A (TSA) (
128
,
129
). HDACi have recently
been shown to increase expression from integrase mutant
lentivi-ral vectors in both dividing and nondividing cells (
130
). Both
HDACi and PKC activators are being tested for potential utility in
HIV-1 eradication strategies, where avoiding generalized T cell
activation is desirable (
120
,
131
).
Though unintegrated HIV-1 DNA is rapidly lost in dividing
cell populations (
132
,
133
), circular forms of uDNA are resistant
to degradation and persist indefinitely in nonproliferating cells,
such as resting primary CD4
⫹T cells (
26
,
85
,
134–137
). The
ex-periments described above demonstrated a reproducible increase
in the number of GFP
⫹cells following postactivation of cells
in-fected with RAL-treated and Int-D116N HIV-1, suggesting the
presence of silent unintegrated genomes. To directly test this
no-tion, we infected IL-4-treated resting CD4
⫹T cells with HIV-1
envelope-pseudotyped Int-WT, RAL-treated, and D116N mutant
GFP reporter viruses for a single round, cultured these cells for 15
days, and then removed the GFP
⫹cells by fluorescence-activated
cell sorting (FACS) (
Fig. 5A
). We placed the GFP-negative cells
back in culture to test the responsiveness of putative latent
ge-nomes to activation stimuli. Two days later there was a low level of
spontaneous GFP, p24Gag, and
de novo
virus expression from
Int-WT HIV-1-infected cells (
Fig. 5B
to
D
) but only low-level GFP
expression without virus production from RAL-treated and
Int-D116N HIV-1-infected cells. Both memory and naive CD4
⫹T
cells were latently infected by these X4 viruses (see Fig. S4 in the
supplemental material). Postactivation of the cells in 3
indepen-dent experiments induced 6.6- to 25.8-fold increases in virus
pro-duction from Int-WT HIV-1-infected cells and 5.1- to 23.8-fold
increases in
de novo
HIV-1 production from RAL-treated and
D116N HIV-1-infected cells.
De novo
virus production was again
reflected in an increase in p24Gag
⫹cells (
Fig. 5C
). Following
post-activation with anti-CD3/CD28 beads, the level of virion
produc-tion from RAL-treated and Int-D116N HIV-1-infected cells on a
per cell basis was 4.6- to 10.6-fold lower than that from Int-WT
HIV-1-infected cells. Interestingly, Pro-TSA was proportionately
stronger on RAL-treated and Int-D116N HIV-1 cells and weaker
on Int-WT (non-RAL-treated) HIV-1-infected cells, inducing
de
novo
the production of HIV-1 from RAL-treated and Int-D116N
HIV-1-infected templates that was only 1.6- to 3.1-fold lower than
that from Int-WT HIV-1-infected templates on a per cell basis. A
sorting performed 33 days after infection yielded similar results
(not shown).
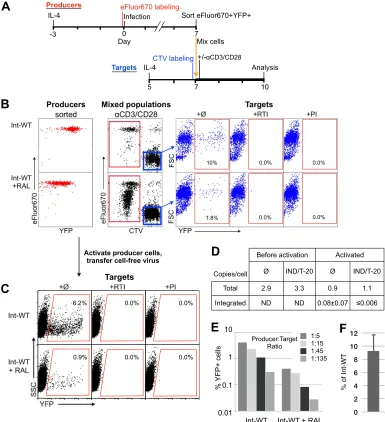
CD4
ⴙT cells activated after infection generate infectious
HIV-1, despite RAL treatment.
We next measured the infectivity
of viruses generated from Int-WT and RAL-treated HIV-1
through both cell-cell contact (
138
) and cell-free infection (
Fig.
6
). As diagrammed in
Fig. 6A
, we infected eFluor670-labeled
rest-ing cells with an
env
-positive YFP reporter virus and applied
ralte-gravir to half of the cells for 7 days, reported to be a sufficient
interval for dissolution of preintegration complexes (PICs) (
8
).
We purified YFP
⫹eFluor670
⫹double-positive cells by FACS and
then mixed them with CellTrace Violet-labeled target cells and
anti-CD3/CD28 activation beads (
Fig. 6B
). Raltegravir was
re-moved after sorting so that transmitted viruses could integrate in
newly infected target cells and generate YFP
⫹bright cells, thus
improving the sensitivity of the assay. At this point, RAL
inhibi-tion of PIC-mediated integrainhibi-tion would be irreversible (
3
). PCR
analysis performed on sorted YFP
⫹producer cells both before and
after activation confirmed the results shown in
Fig. 1G
that RAL
treatment resulted in less than 1 integration per 100 cells (
Fig. 6D
).
When virus transmission was not prevented by antiviral
treat-ment, increased integration was detected in producer cells after 3
days of activation, indicating that these cells could be
superin-fected.
The differential staining of producer and target cells allowed
positive discrimination of these two populations (
Fig. 6B
). To
control for nonspecific transfer of viruses or YFP, identical
cul-tures included reverse transcriptase inhibitors to block
de novo
infection of targets. As a further control, we pretreated a set of
producer cells with the protease inhibitor indinavir. This would
stop the
de novo
production of virions from producer cells but not
block infection of target cells by any virions remaining from the
initial inoculum. In each case, virus transmission was completely
blocked (
Fig. 6B
); thus, all transferred viruses were the result of
de
novo
virus production from the producer cells. Cell-cell transfer of
infectious HIV-1 from raltegravir-treated cells to primary CD4
⫹T
cells was 9 to 18% as efficient as that from an equal number of cells
infected with Int-WT HIV-1 across multiple experiments.
Trans-mission was also observed using D116N HIV-1 (not shown). In a
further independent experiment, a constant number of target cells
was mixed with various numbers of producer cells to control for
any effect of the different producer-target cell ratios (
Fig. 6E
and
F
). Each ratio resulted in an approximately 1-order-of-magnitude
lower level of transfer of infectious virus from RAL-treated cells.
In another test, supernatants from a separate set of postactivated
producer cells from the experiment whose results are shown in
Fig. 6B
were applied to Jurkat-Tat cells to test for cell-free
trans-mission (
Fig. 6C
). These supernatants transmitted infectious
HIV-1 at a similar relative efficiency as cell-cell transmission to
primary T cells. As with cell-cell transmission, reverse
transcrip-tase inhibitors or pretreatment with protease inhibitors prevented
transmission of infection to target cells.
Recombination between viruses generated from
uninte-grated HIV-1.
Recombination in retroviruses is a form of sexual
reproduction that combines the genetic information of two
parental viruses, allowing rapid evolutionary jumps that would
be difficult or impossible to achieve through single nucleotide
incorporation errors (mutation) alone. We have previously
de-scribed a system to measure recombination by flow cytometry
(
67
,
69
) and demonstrated that when integrated and
on November 7, 2019 by guest
http://jvi.asm.org/
grated HIV-1 isolates are present in the same cell,
recombina-tion can occur between their progeny genomes (
67
). To test the
ability of unintegrated HIV-1 to generate recombinant viruses
without the assistance of an integrated helper virus, we
per-formed this assay comparing cells infected with Int-WT,
RAL-treated, and D116N HIV-1 and observed levels of
recombina-tion that reflected the efficiencies of virus producrecombina-tion observed
in the experiments described above (see Fig. S5 in the
supple-mental material).
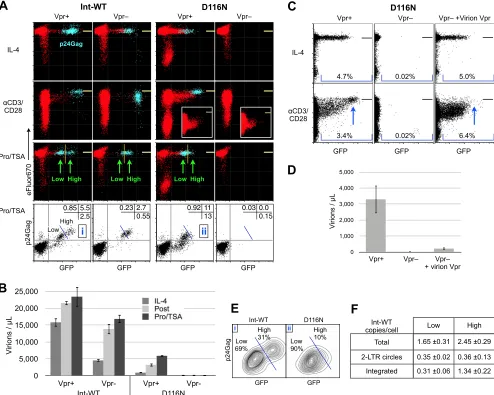
Vpr is required for gene expression and virus production
from Int mutant HIV-1 in resting T cells.
The Vpr protein is
incorporated into virions and delivered into cells by infecting
vi-rions, where it functions as an immediate early protein that can
bind to nucleoporins and importins (
139–142
), participate in viral
DNA remodeling prior to integration (
143
), facilitate nuclear
im-port (
30
,
41
,
42
), transactivate unintegrated HIV-1 DNA (
28
,
29
),
and induce cell cycle arrest (
144
). Vpr that is generated
de novo
in
cells during late gene expression can also cause cell growth arrest
Before Sort
After Sort
IL-4
αCD3/CD28 + IL-2
Pro/TSA
Int-WT Int-WT + RAL D116N
Sort
GFP
eFluor670
GFP
p24Gag
Day 17 Day 17
Day 15
IL-4
αCD3/CD28 + IL-2
Pro/TSA
6.5% 3.7% 3.9%
0.0% 0.0% 0.0%
0.9% 0.9% 0.5%
1.6% 2.2% 2.0%
2.5% 4.2% 4.8%
0.3% 0.01% 0.01%
0.7% 0.5% 0.6%
1.7% 2.1% 2.3%
Int-WT Int-WT + RAL D116N
Sort Sort
0.3% 0.1%
0.8%
0.17% 0.22% 0.3% 0.2% 0.3%
0.5% 0.4% 0.5%
0.6% 1.4% 1.3% 0.1% 0.1%
1.1% 1.1%
-3 0
15 17
IL-4 Infection
Analysis eFluor670 labeling
Sort: eFluor+GFP–
Day +/- Activation,Pro/TSA
A
B
C
0 20 40 60 80 100
IL-4 αCD3/CD28+IL-2 Pro/TSA
Percent of WT
Post-Activation
D
FIG 5Durable latency is established by unintegrated HIV-1 in resting CD4⫹T cells. (A) Schematic protocol for analyzing HIV-1 latency. eFluor670-stained CD4⫹T cells were treated with IL-4 for 3 days (IL-4 infection protocol) and then infected with Int-WT (with or without raltegravir) or D116N virus and maintained in culture for 15 days. Viruses wereenvdefective and pseudotyped with the HIV-1 envelope for a single round of infection. At 15 days after infection, GFP-negative (GFP⫺) cells were purified by FACS and then placed back in culture. Cells were cultured with IL-4 or stimulated for 2 days with either anti-CD3/ CD28 activation beads plus IL-2 (postactivation protocol) or prostratin plus TSA (Pro/TSA). Data are representative of⬎5 independent experiments. (B) GFP expression and cell proliferation analyzed by flow cytometry on the day of sorting (day 15) and 2 days after sorting (day 17) on unfixed cells. (C) GFP expression versus intracellular p24Gag staining 2 days after sorting (day 17). (D) Virus output measured by qRT-PCR on the culture supernatants of 65,000 cells per condition 2 days after sorting (day 17). Virus output is expressed as a percentage of the virus production obtained after activation with T cells infected with Int-WT virus. Data are from 3 independent experiments. The SDs represent interexperimental variability.
on November 7, 2019 by guest
http://jvi.asm.org/
[image:11.585.45.542.67.509.2]and transactivate HIV-1 (
145–150
). Vpr is important for HIV-1
replication in postmitotic macrophages and growth-arrested cell
lines (
37
,
41
; reviewed in reference
32
). These reports and the
negative correlation between cell proliferation and virus
produc-tion from integraproduc-tion-inhibited HIV-1 producproduc-tion that we
ob-served suggested a possible role for Vpr in this process.
We observed that Int-WT virus lacking the
vpr
gene was
capa-ble of generating GFP
⫹p24Gag
⫹cells, and in the absence of Vpr
these cells proliferated after activation (
Fig. 7A
). This conclusively
demonstrated that, as expected, Vpr was responsible for the block
in activation-induced proliferation observed in this system (
Fig.
2B
; see Fig. S3B in the supplemental material). Int-D116N HIV-1,
-3 0
10
IL-4 Infection
Analysis +/-αCD3/CD28
Sort eFluor670+YFP+
eFluor670 labeling
CTV labeling
7 Mix cells Producers
Targets
Day
IL-4
5
7
Activate producer cells, transfer cell-free virus
A
0.0% 0.0%
0.0% 0.0%
10%
1.8%
6.2%
0.9% 0.0% 0.0%
0.0% 0.0%
Targets
FSC
B
C
E
% YFP+
cells
Int-WT Int-WT + RAL
1:5 1:15 1:45 1:135
10
1
0.1
0.01
Producer:Target Ratio
0 2 4 6 8 10 12
% of Int-WT
F
Before acctivation ActivvatedCopies/cell Ø IND/T-20 Ø IND/T-20
Total 2.9 3.3 0.9 1.1
Integrated ND ND 0.08±0.07 ≤0.006
D
FIG 6Transmission of infectious virus generated from integration-inhibited HIV-1. (A) Schematic protocols for infection, transmission, and analysis of cells. eFluor670-labeled CD4⫹T cells were treated with IL-4 for 3 days and then infected with Int-WT, Env⫹, YFP reporter HIV-1 in the presence or absence of raltegravir (1M). At 7 days after infection, raltegravir was removed and then GFP⫹eFluor670⫹cells were purified by FACS and mixed at a 1:5 ratio with IL-4-treated, CellTrace Violet (CTV)-labeled autologous target CD4⫹T cells. This coculture was activated for 3 days with anti-CD3 anti-CD28 activation beads and IL-2 prior to analysis. (B) Flow cytometric analysis of the producer cells after isolation (left, in red), the mixed producer and target cells after activation (middle, in black), and the expression of YFP from the eFluor670-negative CTV-positive target T cells (rightmost 3 panels, in blue). Reverse transcriptase inhibitor (RTI) and protease inhibitor (PI) controls demonstrate specificity forde novovirus production. Reverse transcriptase inhibitors were added at the time of cell mixing, and protease inhibitors were added at the time of infection of producer cells and on subsequent days. Data are representative of 2 independent experiments. FSC, forward scatter. (C) Transmission by cell-free virus generated from postactivated producer cells. Culture supernatants from activated producer cells from the experiment whose results are shown in panel B were applied to Jurkat-Tat cells, which were analyzed 3 days later. Assays with reverse transcriptase inhibitor and protease inhibitor controls were performed as described for panel B. (D) qPCR analysis of total and integrated DNA in FACS-purified producer cells. No PCR amplification for integrated DNA was detected in samples prior to activation, with a detection limit ofⱕ0.0075 copy/cell (samples labeled ND [none detected]). (E) Independent experiment similar to that described for panel B but with the ratios of producer to target cells varied. The percentage of YFP⫹target cells was determined as described in the legend to panel B. (F) Transmission averages and SDs from panels B and D are expressed as a percentage of the value for untreated Int-WT HIV-1.
on November 7, 2019 by guest
http://jvi.asm.org/
[image:12.585.100.485.68.490.2]on the other hand, completely failed to express GFP fluorescence
and p24Gag protein even following postactivation or after
treat-ment with Pro-TSA (
Fig. 7A