METHOD DEVELOPMENT AND METHOD VALIDATION FOR THE ESTIMATION OF TOLTERODINE TARTRATE IN TABLET DOSAGE FORM
BY RP-HPLC
Dissertation
Submitted to
The Tamil Nadu Dr.M.G.R Medical University, Chennai. In partial fulfilment for the award of the degree of
MASTER OF PHARMACY In
PHARMACEUTICAL ANALYSIS
By
M.SHAJU
DEPARTMENT OF PHARMACEUTICAL ANALYSIS ULTRA COLLEGE OF PHARMACY
4/235,COLLEGE ROAD,THASILDAR NAGAR, MADURAI-625020.
DECLARATION
I hereby declare that this thesis work entitled “ METHOD DEVELOPMENT AND METHOD VALIDATION FOR THE ESTIMATION OF TOLTERODINE TARTRATE IN TABLET DOSAGE FORM BY RP-HPLC ” submitted to The Tamil Nadu Dr.M.G.R Medical University, Chennai was carried out by me in the Department of Pharmaceutical Analysis, Ultra College of Pharmacy, Madurai under the valuable and efficient guidance of Mr.V.SIVANAND, M.Pharm., Professor , Department of Pharmaceutical Analysis , Ultra College of Pharmacy, Madurai during the academic year May2012- March 2013. I also declare that the matter embodied in it is a genuine work and the same has not formed the basis for the award of any degree, diploma, associateship, fellowship of any other university or institution.
PLACE: MADURAI
ULTRA COLLEGE OF PHARMACY. 4/235, COLLEGE ROAD,
THASILDAR NAGAR, MADURAI.
________________________________________________________________________
CERTIFICATE
This is to certify that, this thesis work entitled “METHOD DEVELOPMENT AND METHOD VALIDATION FOR THE ESTIMATION OF TOLTERODINE TARTRATE IN TABLET DOSAGE FORM BY RP-HPLC” submitted in partial fulfilment of the requirements for the award of degree of Master of Pharmacy in Pharmaceutical Analysis of The Tamil Nadu Dr. M.G.R Medical University, Chennai is
a bonafide work carried out by M.SHAJU and was guided and supervised by me during the academic year May2012- March 2013.
Mr.V.SIVANAND,M.Pharm., PLACE: MADURAI PROFESSOR ,
DATE: DEPARTMENT OF PHARMACEUTICAL ANALYSIS, ULTRA COLLEGE OF PHARMACY,
ULTRA COLLEGE OF PHARMACY. 4/235, COLLEGE ROAD,
THASILDAR NAGAR, MADURAI.
________________________________________________________________________
CERTIFICATE
This is to certify that, this thesis work entitled “METHOD DEVELOPMENT AND METHOD VALIDATION FOR THE ESTIMATION OF TOLTERODINE TARTRATE IN TABLET DOSAGE FORM BY RP-HPLC” submitted in partial fulfilment of the requirements for the award of degree of Master of Pharmacy in Pharmaceutical Analysis of The Tamil Nadu Dr.M.G.R Medical University, Chennai is a
bonafide work carried out by M.SHAJU and was guided and supervised by Mr.V.SIVANAND, M.Pharm., Professor , Department of Pharmaceutical Analysis , Ultra College of Pharmacy, Madurai during the academic year May2012- March 2013.
Dr. C.VIJAYA, PROF.A.BABU THANDAPANI, Dean(P.G Programme), Principal,
Ultra College of Pharmacy, Ultra College of Pharmacy, Madurai. Madurai.
DATE:
ULTRA COLLEGE OF PHARMACY. 4/235, COLLEGE ROAD,
THASILDAR NAGAR, MADURAI.
________________________________________________________________________
CERTIFICATE
This is to certify that, this thesis work entitled “METHOD DEVELOPMENT AND METHOD VALIDATION FOR THE ESTIMATION OF TOLTERODINE TARTRATE IN TABLET DOSAGE FORM BY RP-HPLC” submitted in partial fulfilment of the requirements for the award of degree of Master of Pharmacy in Pharmaceutical Analysis of The Tamil Nadu Dr.M.G.R Medical University, Chennai is a
bonafide work carried out by M.SHAJU guided by Mr.V.SIVANAND, M.Pharm., Professor , Department of Pharmaceutical Analysis , Ultra College of Pharmacy, Madurai during the academic year May2012- March 2013 was evaluated by us.
EXAMINERS: 1.
2.
PLACE: MADURAI
METHOD DEVELOPMENT AND METHOD VALIDATION FOR THE ESTIMATION OF TOLTERODINE TARTRATE IN TABLET DOSAGE FORM
BY RP-HPLC
Dissertation
Submitted to
The Tamil Nadu Dr.M.G.R Medical University,Chennai. In partial fulfilment for the award of the degree of
MASTER OF PHARMACY In
PHARMACEUTICAL ANALYSIS
By
Reg No:26103428
DEPARTMENT OF PHARMACEUTICAL ANALYSIS ULTRA COLLEGE OF PHARMACY
4/235,COLLEGE ROAD,THASILDAR NAGAR, MADURAI-625020.
DECLARATION
I hereby declare that this thesis work entitled “METHOD DEVELOPMENT AND METHOD VALIDATION FOR THE ESTIMATION OF TOLTERODINE TARTRATE IN TABLET DOSAGE FORM BY RP-HPLC” submitted to The Tamil Nadu Dr.M.G.R Medical University, Chennai was carried out by me in the Department of Pharmaceutical Analysis , Ultra College of Pharmacy, Madurai under the valuable and efficient guidance of Mr.V.SIVANAND, M.Pharm., Professor , Professor and Head, Department of Pharmaceutical Analysis , Ultra College of Pharmacy, Madurai during the academic year May2012- March 2013. I also declare that the matter embodied in it is a genuine work and the same has not formed the basis for the award of any degree, diploma, associateship, fellowship of any other university or institution.
PLACE: MADURAI
ULTRA COLLEGE OF PHARMACY. 4/235, COLLEGE ROAD,
THASILDAR NAGAR, MADURAI.
________________________________________________________________________
CERTIFICATE
This is to certify that, this thesis work entitled “METHOD DEVELOPMENT AND METHOD VALIDATION FOR THE ESTIMATION OF TOLTERODINE TARTRATE IN TABLET DOSAGE FORM BY RP-HPLC” submitted in partial fulfilment of the requirements for the award of degree of Master of Pharmacy in Pharmaceutical Analysis of The Tamil Nadu Dr.M.G.R Medical University, Chennai is a bonafide work carried out by Reg No: 26103428 and was guided and supervised by me during the academic year May2012- March 2013.
Mr.V.SIVANAND,M.Pharm., PLACE: MADURAI PROFESSOR ,
DATE: DEPARTMENT OF PHARMACEUTICAL ANALYSIS, ULTRA COLLEGE OF PHARMACY,
ULTRA COLLEGE OF PHARMACY. 4/235, COLLEGE ROAD,
THASILDAR NAGAR, MADURAI.
________________________________________________________________________
CERTIFICATE
This is to certify that, this thesis work entitled “METHOD DEVELOPMENT AND METHOD VALIDATION FOR THE ESTIMATION OF TOLTERODINE TARTRATE IN TABLET DOSAGE FORM BY RP-HPLC” submitted in partial fulfilment of the requirements for the award of degree of Master of Pharmacy in Pharmaceutical Analysis of The Tamil Nadu Dr.M.G.R Medical University, Chennai is a bonafide work carried out by Reg No: 26103428 and was guided and supervised by Mr.V.SIVANAND, M.Pharm., Professor , Department of Pharmaceutical Analysis , Ultra College of Pharmacy, Madurai during the academic year May2012- March 2013.
Dr. C.VIJAYA, PROF.A.BABU THANDAPANI, Dean(P.G Programme), Principal,
Ultra College of Pharmacy, Ultra College of Pharmacy, Madurai. Madurai.
PLACE: MADURAI
ULTRA COLLEGE OF PHARMACY. 4/235, COLLEGE ROAD,
THASILDAR NAGAR, MADURAI.
________________________________________________________________________
CERTIFICATE
This is to certify that, this thesis work entitled “METHOD DEVELOPMENT AND METHOD VALIDATION FOR THE ESTIMATION OF TOLTERODINE TARTRATE IN TABLET DOSAGE FORM BY RP-HPLC” submitted in partial fulfilment of the requirements for the award of degree of Master of Pharmacy in Pharmaceutical Analysis of The Tamil Nadu Dr.M.G.R Medical University, Chennai is a
bonafide work carried out by Reg No: 26103428 guided by Mr.V.SIVANAND, M.Pharm., Professor , Department of Pharmaceutical Analysis , Ultra College of Pharmacy, Madurai during the academic year May2012- March 2013 was evaluated by us.
EXAMINERS:
1.
2.
PLACE: MADURAI
ACKNOWLEDGEMENT
Apart from my efforts, the success of this project depends largely on the encouragement and guidance of many others. I take the privilege and pleasure to express my gratitude to the people who have been instrumental in the successful completion of this project.
I express my extreme sense of gratitude and profound thanks to my guide, Mr.V.SIVANAND, M.Pharm., Ph.D., Asst Professor, Department of Pharmaceutical Analysis, for his precious guidance, encouragement, abundant help and timely suggestions which proved for the success of this work.
I do feel highly elated in manifesting a sense of gratitude to my honourable professors Prof. K.R Arumugam,M.Pharm., and Dr.A.Babu Dhandapani, M.Pharm.,Ph.D., who permitted me to do this project and for his constant encouragement throughout my work.
It is my privilege and honour to extend my profound gratitude and express my indebtedness to our Dean Dr.C.Vijaya. M.Pharm.Ph.D., for her valuable advice and innovative ideas throughout my project.
I wish to thank with pleasure and gratitude Mr.G.Pratheesh,M.Pharm.,M.D(A.M).,MBA., Assistant Professor Department of Pharmaceutical Analysis, for his valuable suggestions and support for the fulfilment of my dissertation.
My heartiest acknowledgement rented to Dr.K.G. Lalitha.,M.Pharm., Ph.D., Prof.Chandran, M.Pharm., Mr.K.Natarajan, M.Pharm., Mr.SenthilKumar, M.Pharm., Mr.T.Regupathi, M.Pharm., for their valuable suggestions throughout my thesis work.
I sincerely extend my thanks to Laboratory staff Mr.Sonai and all the Laboratory staffs in Ultra College of Pharmacy.
CONTENTS
S. No Contents Page No
1 Introduction 1
2 Literature Review 28
3 Aim and Plan of Work 33
4 Drug Profile 34
5 Instruments and reagent 35
6 HPLC Method development and Optimisation 36
7 Quantitative Determination of the Drug 38
8 Validation 39
Linearity and Range 40
Precision a. System precision b. Method precision 42
Specificity 45
Accuracy 47
Ruggedness 48
Robustness 49
Solution stability 51
Limit of Detection 52
Limit of Quantitation 53
System suitability 54
9 Results and Discussion 55
10 Conclusion 58
INTRODUCTION
1,2,3,4Living things are those, which make the entire world productive and interesting. The absence of the living things proves the world futile. Among the living things such as microorganism, plants, animals and human, it is the human being, which predominates, and there by leads and of course rules over the other.
As the days moves on rapidly it is a noted fact that the life style, culture and the environment of the mankind has changed tremendously. In this rapidly changing world the emergence of various life threatening illness, diseases and other serious syndromes have become vary common and also a part of life. In order to eradicate the emergence of the new diseases and also to get rid out of various existing diseases. The inventions of newer agents or newer molecules become the concern.
In the act of invention of newer agents and molecules there are various aspects to the considered such as easy availability, affordability, low manufacturing cost, high efficacy and
with minimal side effects.
Considering the various above said factors the medicinal chemists throughout the
world are seriously as well as sincerely involved in the newer drug synthesis and it determination to enable as well as to enhance the well being of the mankind.
The hundreds or thousands of new organic chemicals are prepared annually throughout the world and many of them entered into pharmacological screens to determine whether they have useful biological activity. This process of random screening has been considered inefficient but it has resulted in the identification of new drugs and it have been determined quantitatively.
ANALYTICAL CHEMISTRY1,4,7
Analytical chemistry is a scientific discipline used to study the chemical composition, structure and behaviour of matter. The purpose of this is to gather and interpret chemical information that will be of value to society in a wide range of contexts.
1. Definition of the problem.
2. Choice of technique and method. 3. Sampling
4. Sample pretreatment or conditioning 5. Qualitative analysis
6. Quantitative analysis
7. Preparation of report or certificate of analysis 8. Review of the original problem.
QUANTITATIVE ANALYSIS:
It is the determination of the absolute or relative amounts of elements, species or compounds present in sample.
QUALITATIVE ANALYSIS:
It is the identification of elements, species and/or compounds present in a sample. ANALYTICAL TECHNIQUE:
There are numerous chemical or physico-chemical processes that can be used to provide analytical information. The processes are related to a wide range of atomic and molecular properties and phenomena that enable elements and compounds to be detected and/or quantitatively measured under controlled conditions. Instrumental techniques are used for much analysis and constitute the discipline of instrumental analysis. Atomic or molecular spectrometry and chromatography, which together comprise the largest and most widely used groups of techniques, can be further subdivided according to their physico chemical basis. ANALYTICAL METHODS
Analytical methods are a detailed set of instructions for a particular analysis using a specified technique. Many standard analytical methods have been published as papers in analytical journals and other scientific literature, and in textbook form often, laboratory will develop their own "in-house methods" or adapt existing ones for specific purposes.
Method development forms a significant part of the work of most analytical laboratories and method validation and periodic revalidation is a necessity. Analytical methods must be shown to give reliable data, free from bias and suitable for the intended use. Most methods are multi step procedures, and the process of validation generally involves a stepwise approach in which optimized experimental parameters are tested for robustness that is sensitivity to variations in the conditions and sources of errors investigated.
problem. Analytical chemists to save time, to avoid chemical separation or to obtain
increased accuracy, may use instrumental method. The time saving feature can be realized in routine analysis, or where a considerable number of determinations are to be made. Most instrumental techniques fit into one of the three principal areas: Spectroscopy, Electrochemistry and Chromatography.
PRINCIPLE TYPES OF CHEMICAL INSTRUMENTATION: A. Spectrometric techniques:
Ultra violet and Visible Spectrophotometry
Fluorescence and Phosphorescence Spectrophotometry
Atomic Spectrometry (Emission and Absorption) Infrared Spectrophotometry
Raman Spectroscopy X-ray Spectroscopy
Radiochemical techniques including activation analysis Nuclear Magnetic Resonance Spectroscopy
Electron Spin Resonance Spectroscopy B. Chromatographic techniques
Gas Chromatography
High Performance Liquid Chromatography Thin layer Chromatography
C. Electrochemical techniques Potentiometry Voltametry Stripping Techniques Amperometric Techniques. Colorimetry Electrogravimetry Conductance Techniques D. Miscellaneous Techniques
Thermal Analysis Mass Spectrometry Kinetic Techniques E. Hyphenated Techniques:
ICP-MS (Inductivity Coupled Plasma Mass Spectrometry) GC-IR (Gas Chromatography - Infrared Spectroscopy) MS-MS (Mass Spectrometry - Mass Spectrometry) ANALYTICAL DEVELOPMENT:4,7,8,9,10
Devising accurate assay procedures for each ingredient of complex dosage formulations containing several therapeutically and chemically compatible drugs with very similar chemical nature is a monumental undertaking. Separation, identification and estimation of each ingredient in such complex formulations is a challenging task.
Not only are the multiple active constituents present but also they are usually there in widely divergent concentration depending upon their relative potency and therapeutic need of the patient.
The presence of excipients, additives and decomposition products further complicates the analysis. Therefore analytical development is done for new drugs where no compendial methods are available. Or, alternate method development for existing (Non Pharmacopoeial) products to reduce cost and time of analysis.
Method development is done for:
1. New products. 2. Existing products
Methods are developed for new products when no official methods are available. Alternate methods for existing (Non- Pharmacopoeial) products are developed to reduce the cost and time for better precision and ruggedness. Trial runs are conducted, method is
optimized and validated.
When alternate method proposed is intended to replace the existing procedure comparative laboratory data including merit/demerits are made available.
Selection of analytical method:
First stage in the selection or development of method is to establish what is being measured and how accurately it should be measured.
The following analytical techniques are usually employed for estimations different components in formulations:
1. Titrimetric and Gravimetric.
2. Ultraviolet and visible Spectrophotometry. 3. Thin layer chromatography.
6. Atomic absorption Spectrometry (AAS)
MAJOR STEPS IN SOLVING AN ANALYTICAL PROBLEM
Describe sample, Desired information & Appropriate methods
Define problem
Select appropriate method (s)
Analytical techniques
Obtain and store sample
Pretreat sample
Performed required measurements
Compare results with standards
Apply necessary statistical
Present results in form understandable to analyst
Present results to customer
Refined data into information
Information is transformed into useful knowledge
METHOD DEVELOPMENT:
For the development of an analytical method various steps are followed which are considered essential for establishing the required documental evidence to prove that the said method is ideal and reproducible. The various steps followed in developing an analytical method is shown in following table:
STEPS OF METHOD DEVELOPMENT:
Documentation starts at the very beginning of the development process, a system for full documentation of the development studies must be established. All data relating to these studies must be established. All data relating to these studies must be recorded in laboratory notebook or an electronic database.
1. Analyte standard characterization:
All known information about the analyte and its structure is collected i.e. physical and chemical properties, toxicity, purity, hygroscopic nature, solubility and stability.
The standard analyte (100% purity) is obtained. Necessary arrangement is made for the proper storage (refrigerator, desiccators, freezer)
When multiple components are to be analyzed in the sample matrix, the number of components is noted, data is assembled and the availability of standards for each one is determined.
Special attention has to be paid when samples are limited (small volume or mass) or an analyte is present at trace levels, it is noted.
Only those methods (MS, GC, HPLC etc.) that are compatible with sample stability are considered.
2. Method Requirements:
The goals or requirements of the analytical method that need to be developed are considered and the analytical figures of merit are defined. The required detection limits, selectively, linearity, range, accuracy and precision are defined.
3. Literature search and prior methodology:
4. Choosing a method:
Adaptation is more efficient than "reinventing the wheel". If any of the reported methods from the literature are adaptable to the current laboratory setting and future needs, it is determined.
Using the information in the literatures and prints, methodology is adapted. The methods are modified wherever necessary. Sometimes it is necessary to acquire additional instrumentation to reproduce, modify, improve or validate existing methods for in-house analytes and samples.
If there are no prior methods for the analyte in the literature, from analogy, the compounds that are similar in structure and chemical properties are investigated and are worked out. There is usually one compound for which analytical method already exist that is similar to the analyte of interest.
5. Instrumental setup and initial studies:
The required instrumentation is set up. Installation, operational and performance qualification of instrumentation using laboratory standard operating procedures (SOP's) are verified.
Always new consumables (e.g. Solvents, filters and gases) are used, for example, method development is never started, on a HPLC column that has been used earlier.
The analyte standard in a suitable injection / introduction solution and in known concentrations and solvents are prepared. It is important to start with an authentic, known standard rather than with a complex sample matrix. If the sample is extremely close to the standard (e.g. bulk drug), then it is possible to start work with the actual sample.
The analysis is done using analytical conditions described in the existing literature.
Feasibility of method with regard to the analytical figures of merit obtained is evaluated.
6. Optimization:
organized methodical plan, and every step is documented (in a lab notebook) in case
of dead ends.
7. Documentation of analytical figures of merit:
The originally determined analytical figures of merit Limit of Quantitation (LOQ), Limit of Detection (LOD), linearity, time per analysis, cost, sample preparation etc are documented.
8. Evaluation of method development with actual samples:
The sample solution should lead to unequivocal, absolute identification of the analyte peak of interest from all other matrix components.
9. Determination of percent recovery of actual sample and demonstration of quantitative sample analysis:
Percent recovery of spiked, authentic standard analyte into a sample matrix that is shown to contain no analyte is determined. Reproducibility of recovery (average +/- standard deviation) from sample to sample and whether recovery has been optimized has been shown. It is not necessary to obtain 100% recovery as long as the results are reproducible and known with a high degree of certainty.
The validity of an analytical method can be verified only by laboratory studies. Therefore documentation of the successful completion of such studies is a basic requirement for determining whether a method is suitable for its intended applications.
Brief description of the various analytical methods: B. SPECTROSCOPY:
In Spectrometric methods, the sample solution absorbs Electromagnetic Radiation from an appropriate source, and the amount absorbed is related to the concentration of the analyte in solution.
UV AND VISIBLE SPECTROSCOPY:
CHROMATOGRAPHY
It is the process of separating the components of mixtures (solutes) that are distributed between a stationary phase and a flowing mobile phase according to the rate at which they are transported through the stationary phase.
Chromatographic technique can be classified according to whether the separation takes place on a planar surface or in a column. They can be further subdivided into gas and liquid chromatography, and by physical form, solid or liquid of the stationary phase and the nature of the interactions of solutes with it known as sorption mechanism.
HPLC -- HIGH PRESSURE (PERFORMANCE) LIQUID CHROMATOGRAPHY High Performance Liquid Chromatography (HPLC) is a chemistry based tool for quantifying and analyzing mixtures of chemical compounds. It's used to find the amount of a chemical compound within a mixture of other chemicals. High Performance Liquid Chromatography (HPLC) is an analytical technique for the separation and determination of organic and inorganic solutes in any samples especially biological, pharmaceutical, food, environmental, industrial, etc. In a liquid chromatographic process a liquid permeates through a porous solid stationary phase and elutes the solutes into a flow-through detector. The stationary phase is usually in the form of small-diameter (5-10 mm) uniform particles, packed into a cylindrical column. The typical column is constructed from a rigid material (such as
stainless steel or plastic) and is generally 5-30 cm long and the internal diameter is in the range of 1-9 mm
1. Increase resolution of liquid chromatography by...
Use very small particles to get the large possible surface area 3 - 20 µ diameter
High pressure (up to 400 atmospheres) needed to get acceptable flow rates requires very strong particles to resist bed compression and crushing of particles.
1 Used in most of the normal modes discussed above although reversed phase is
probably the most common type of HPLC
2 Advantages: very high resolution (replaces Paper chromatography / Electrophoresis in most applications) and short run times.
REVERSED PHASE CHROMATOGRAPHY
1. Stationary Phase -- Apolar (hydrophobic) reversed with respect to cellulose chromatography
Hydrocarbon chains -- bound to an inert matrix; hydrophobicity varied by changing the hydrocarbon chain length
Aromatic groups
1 Mobile Phase -- depends upon hydrophobicity of stationary phase. Commonly use a more polar organic solvent: Acetonitrile, DMSO, EtOH, Ethylene glycol, Propanol, or mixtures of these with H2O. Also may use gradients.
CHROMATOGRAPHY SCALE:
• Analytical - Just Data [High Sensitivity]
• Semi-Preparative - Data and a small amount of purified analyte (gram)
• Preparative - Larger quantities of purified analytes (Kilograms) [High Capacity]
TYPES OF CHROMATOGRAPHY
There are three main types of chromatography, categorized by the mobile phase type:
• Gas (GC) • Liquid (LC)
• Supercritical fluid (SFC)
.MOBILE PHASE :
• Type of modifier (MeoH, Acetonitrile)
• Solvent Strength
• PH
• Type of buffer(Phosphate, acetate)
• Ionic strength (salts, Buffer concentration)
CHIRAL STATIONARY PHASES • Ligand exchange
• p-Donor p-acceptor (Pirkle) • Chiral Host-guest (cyclodextrin) • Immobilized proteins
• Immobilized polysaccharides
This is a highly specific mode of chromatography in which molecular recognition process takes place between the agents bonded to the stationary phase and the solutes. The principle of lock-key recognition similar to enzymes takes place. In size exclusion chromatography molecules are separated based on their molecular size in a sieving effect. The bigger molecules (higher molecular weight) elute earlier.
The system is calibrated using standards of known molecular weights and the unknown's molecular size distribution is determined from the calibration curve. Retention times are related to the log MW (logarithm of molecular weight). There are many variables to consider when selecting the mode of chromatography to work with. Since most of the applications use Reversed Phase, all these variables are taken into consideration during method development for this mode of HPLC.
HPLC COLUMNS:
1. The most efficient columns produce the sharpest peaks, which gives better separation by
minimizing band spreading
2. A tight narrow sample “band” is produced when a column’s stationary phase is uniformly packed (mechanical)
Separation can be achieved by controlling and manipulating these interactions, which effect the
relative retention times of the various sample components.
DATA SYSTEM - A means of controlling the system components and storing, processing
PUMPS:
A high pressure pump is required to force the mobile phase through the column at typical flow rates of 0.1-2 ml/min. The sample to be separated is introduced into the mobile phase by injection device, manual or automatic, prior to the column.
DETECTORS:
Instrument in the chromatographic system which senses the presence of a compound passing through, and provides an electronic signal to a recorder or computer data station. Output is usually peaks, that is, the chromatogram.
TYPES OF DETECTORS:
• UV – Ultraviolet light
o Lamp
o Grating/Lens - Wave length
o Flow Cell
o Photo Diode - Differential Light Output
• RI – Refractive Index
o Universal analyte detector
o Solvent must remain the same throughout separation
o VERY temperature sensitive
o Sometimes difficult to stabilize baseline
• FD – Fluorescence
o Excitation wavelength generates fluorescence emission at a higher wavelength
o Analytes must have fluorophore group
Can react analyte with fluorophore reagent
o Very sensitive and selective o More difficult methods transfer
o Results very dependent upon separation conditions
• MS – Mass Spectrometer
o Mass to charge ratio (m/z) o Allows specific compound ID
Electrospray, Atmospheric pressure chemical ionization, electron impact
The detector usually contains low volume cell through which the mobile phase passes carrying the sample components. Choosing a Detector.
Criteria RI UV/VIS Fluor. MS
Response Universal Selective Selective Selective
Sensitivity 4 microgram 5 nanogram 3 picogram 1 picogram
Linear Range 10 10 10 10
Flow Sensitive Yes No No Yes
Temp. Sensitive Yes No No No
Seven Basic Considerations in Choosing HPLC Operating Parameters: 1. Solubility - Hexane, Chloroform, Methanol, Water (buffer pH), other
2. Molecular Weight - Would GPC be useful in either the analysis or sample prep? 3. Functional Groups - Any ionizable groups? Acidic, Basic, or Neutral?
4. Sample Matrix - What amounts are expected in matrix for either analytical or preparative isolation?
5. Levels in Matrix - What amounts are expected in matrix for either analytical or preparative isolation?
6. Detectability - Any chromophores or fluorophores? Consider Redox or derivatization. Together with point #5, an appropriate detector is chosen.
7. How Do Species Differ - An important clue to manipulate selectivity in the separation, especially if compounds are similar in their structure.
VALIDATION:15,16
Validation is an approach to form a basis for written procedures for production and
process control which are designed to assure that the drug products have the identity, strength, quality and purity they purport or are represented possess.
FOOD AND DRUG ADMINSTRATION (FDA):
Establishing documentation evidence, which provides a high degree of assurance that specific process, will consistently produce a product meeting its predetermined specification and quality attributes.
WORLD HEALTH ORGANISATION (WHO):
Action of providing that any procedure, process, equipment, material, activity or system actually leads to the expected results.
EUROPEAN COMMITTEE (EC):
Action of providing in accordance with the principles of good manufacturing practice, that any procedure, processes, equipment material, activity or system actually lead to the expected results.
In brief validation is a key process for effective Quality Assurance. "Validation is establishing documental evidence which provides a high degree of assurance that a specific process or equipment will consistently produce a product meeting its predetermined specification and quality attributes".
OBJECTIVE OF VALIDATION:
The primary objective of validation is to form a basis for written procedures for production and process control which are designed to assure that the drug products have the identity, strength, quality and purity they purport or are represented to possess.
Quality, safety and efficacy must be designed and built into the product. Each step of the manufacturing process must be controlled to maximize the
probability that the finished product meets all quality and design specifications.
BENEFIT:
QUALITY: Customer-patient satisfaction. It has been built into the product. UNDERSTANDING EQUIPMENT, SYSTEMS, PROCESSES: Process
improvement, technology transfer, related product validation, rapid failure investigations, increased employee awareness.
COST REDUCTION:
• Increased efficiency, shortening lead-time resulting in lower inventories.
• Longer equipment life by operating the equipment as per manufacturer's specifications and the establishing of cost effective preventive maintenacne schedules.
• Possible reduced testing of raw materials bulk formulations and finished products
REGULATORY:
• Successful inspections
• Approved products
• Ability to export. PHASES OF VALIDATION:
• Design Qualification (DQ): Documented verification of the design of equipment and manufacturing facilities.
• Installation Qualification (IQ): Documented verification of equipment or system design and adherence to manufacturer's recommendations.
• Operational Qualification (PQ): Documented verification that equipment or system performance in the target operating range.
• Process performance Qualification (PQ): Documented verification that equipment or systems operate as expected under routine production conditions. The operation is reproducible, reliable and in a state of control.
• Process / Product Validation: Validation is establishing documented evidence, which provides a high degree of assurance that a specific process will consistently produce a product meeting its pre-determined specifications and quality attributes.
TYPES OF VALIDATION:
PROSPECTIVE VALIDATION: This is performed for all new equipment, products and processes. It is a proactive approach of documenting the design, specifications and performance before the system is operational. This is the most defendable type of validation.
CONCURRENT VALIDATION: This is performed in two instances i.e. for existing equipment; verification of proper installation along with specific operational tests is done. In case of an existing, infrequently made product,
data is gathered from at least three successful trials.
time, based on review and analysis of historical data. The source of such data
is production and QA/QC records. The issues to be addressed here are changes to equipment, process, specifications and other relevant changes in the past. DATA ELEMENTS REQUIRED FOR ASSAY VALIDATION:
Most common categories of assays for which validation data should be required. These categories are as follows.
CATEGORY I: - Analytical methods for quantitation of major components of bulk drug substances or active ingredients (including preservatives) in finished pharmaceutical products.
CATEGORY II: - Analytical methods for determination of impurities in bulk drug substances or degradation compounds in finished pharmaceutical products. These methods include quantitative assays and limit tests.
CATEGORY III: - Analytical methods for determination of performance characteristics (e.g. dissolution, drug release)
CATEGORY IV: - Identification test.
For each assay category, different analytical information is needed. Data
elements that is normally required for each of the categories of assays.
DATA ELEMENTS REQUIRED FOR VARIOUS CATEGORIES OF ASSAYS Analytical
performance characteristics
Assay category I
Assay category II
Assay category III
Assay category IV Quantitative Limit test
Accuracy Yes Yes ¤ ¤ No
Precision Yes Yes No Yes No
Specificity Yes Yes Yes ¤ Yes
Detection
limit No No Yes ¤ No
Quanititation
limit No No No ¤ No
Linearity Yes Yes No ¤ No
Range Yes Yes ¤ ¤ No
¤ may be required, depending on the nature of the specific test
Analytical monitoring of a pharmaceutical product or of specific ingredients within
the product is necessary to ensure its safety efficacy throughout all phases of its shelf life. Such monitoring is in accordance with the specifications elaborated during product development. Analytical validation is the cornerstone of process validation without a proven measurement system it is impossible to confirm whether the manufacturing process bas done what it purports to do. All new methods developed are validated.
Steps followed for validation procedures:
1. Proposed protocols or parameters for validations are established 2. Experimental studies are conducted.
3. Analytical results are evaluated. 4. Statistical evaluation is carried out.
5. Report is prepared documenting all the results. OBJECTIVE:
The objective of validation of an analytical procedure is to demonstrate that is suitable for its intended purpose. Validation of analytical methods is the process by which it is established laboratory studies that the performance characteristics of the method meet the requirements for the intended analytical applications. According to ICH, typical analytical performance characteristics that should be considered in the validation of the types of methods are
1. Accuracy 2. Precision
3. Specificity 4. Detection limit 5. Quantitation limit 6. Linearity
7. Range
The ICH documents give guidance on the necessity for revalidation in the following circumstances
1. Changes in the synthesis of the drug substances. 2. Changes in the composition of the drug product, and 3. Changes in the analytical procedures.
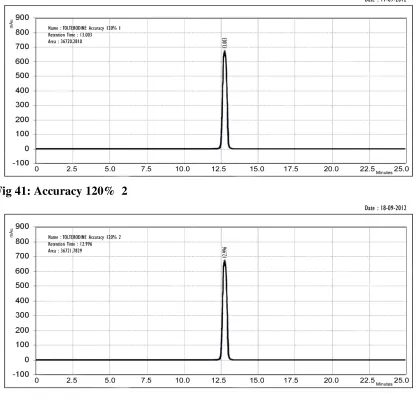
ACCURACY:
Accuracy is the closeness of test results obtained by that method to the true value. The accuracy of an analytical method should be established across its range.
Determination of accuracy:
In case of assay of a drug substance accuracy may be determined by application of the analytical method to an analyte of known purity (e.g. reference standard) or by comparison of the results of the method with those of a second well characterized method, the accuracy of which has been stated or defined. Accuracy is calculated as the percentage of recovery by the assay of the known added amount of analyte in the sample, or as the difference between the mean and the accepted true value, together with confidence intervals. The ICH documents recommended that accuracy should be assessed using a minimum of nine determinations over a minimum of three concentration levels, covering the specified range (i.e., three concentrations and three replicates of each concentration)
PRECISION:
Precision is the degree of agreement among individual test results when the method is applied repeatedly to multiple samplings of a homogenous sample. Precision of an analytical method is usually expressed as the standard deviation or relative standard deviation (coefficient of variation) of a series of measurement. Precision may be measure of either the degree of reproducibility or repeatability of the analytical method under normal operating conditions.
Determination of precision:
Precision of an analytical method is determined by assaying a sufficient number of aliquots of a homogenous sample to be able to calculate statistically valid estimates of standard deviation or relative standard deviation (coefficient of variation). The ICH documents recommend that repeatability should be assessed using a minimum of nine determinations covering the specified range for the procedure.
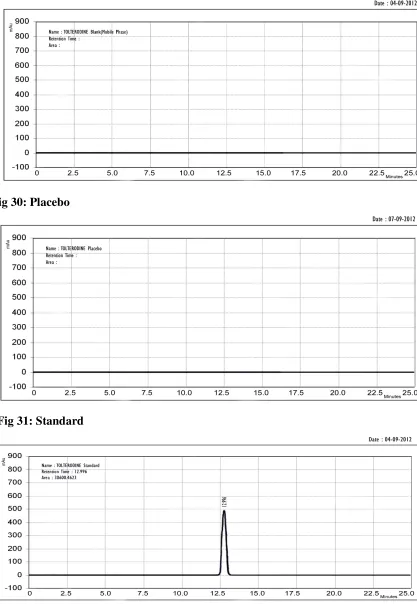
SPECIFICITY:
ICH documents defines specificity as the ability to assess unequivocally the analyte in the presence of compounds that may be expected to present, such as impurities, degradation products and matrix components.
IDENTIFICATION TESTS:
-It ensures that all the analytical procedures performed allow an accurate statement of
the content of impurities of an analyte. (e.g. related substances test, heavy metals limit, Organic volatile impurity test).
ASSAY:
It provides an exact result, which allows as accurate statement on the content or potency of the analyte in a sample.
SPECIFICITY:
ICH documents state that when chromatographic procedures are used, representative chromatograms should be presented to demonstrate the degree of selectivity and peaks should be appropriately labeled. Peak purity tests (e.g. Using diode array or mass spectrometry) may be useful to show that the analyte chromatographic peak is not attributable to more than one component.
DETECTION LIMIT
:-Characteristic of limit tests: Lowest amount of analyte in a sample that can be detected, but not necessarily quantities as an exact value, under the stated experimental conditions. The detection limit is usually expressed as the concentration of analyte (e.g. percentage parts per million) in the sample.
Determination of detection limit:
For instrumental and non-instrumental methods detection limit is generally determined by the analysis of samples with known concentrations of analyte and by establishing the minimum level at which the analyte can be reliably detected.
In case of instrumental analytical procedures that exhibit background noise, the ICH documents describe a common approach which is to compare measured signals from samples with known low concentrations of analyte with those of blank samples. The minimum concentration at which the analyte can be reliably detected is established. Typically acceptable signal-to-noise ratios are 2:1 or 3:1. Whatever method is used, the detection limit should be subsequently validated by the analysis of a suitable number of samples known to be near, or prepared at the detection limit.
QUANTITATION LIMIT:
Determination of Quantitation limit:
For instrumental and non-instrumental methods, the quantitation limit is generally determined by the analysis of samples with known concentration of analyte and by establishing the minimum level at which the analyte can be determined with acceptable accuracy and precision. In case of instrumental analytical methods that exhibit background noise, the ICH documents describe a common approach, which is to compare measured signals from samples with known low concentration of analyte with those of blank samples. A typically acceptable signal-to noise ratio is 10:1. Whatever method is used, the quantitation limit should be subsequently validated by the analysis of a suitable member of samples known to be near, or prepared at, the quantitation limit.
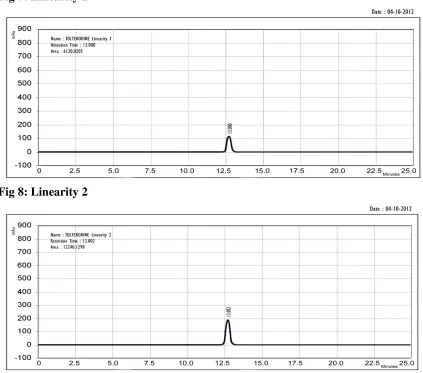
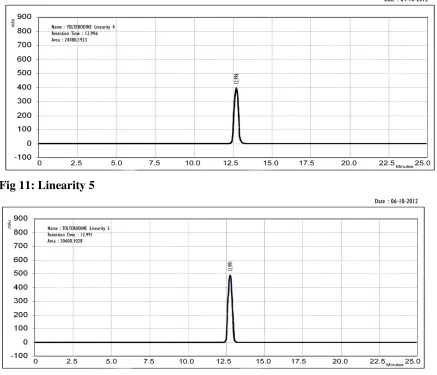
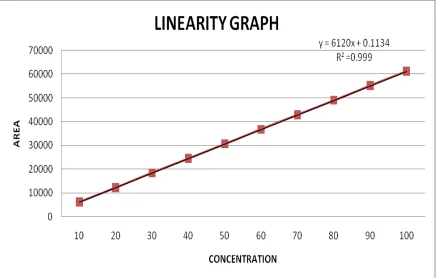
LINEARITY AND RANGE:
Linearity of an analytical method is its ability to elicit test results that are directly or by a well-defined mathematical transformation, proportional to the concentration of analyte in samples within a given range. The range of an analytical method is the interval between the upper and lower levels of analyte (including these levels).
That has been demonstrated to be determined with a suitable level of precision, accuracy and linearity using the method as written. Range is normally expressed in the same units as test results (e.g. found parts per million) obtained by the analytical method.
Determination of linearity and range:
Linearity should be established across the range of the analytical procedure. Initially by visual examination of a plot of signals as a function of analyte concentration of content. If
linear relationship appears, test results are established by appropriate statistical methods (e.g. by calculation of a regression line by the method of least squares)
The range of the method is validated by verifying that the analytical method provides acceptable precision, accuracy, and linearity when applied to sample containing analyte at the extremes of the range as well as within the range. ICH recommends that for the establishment of linearity, a minimum of five concentrations normally be used.
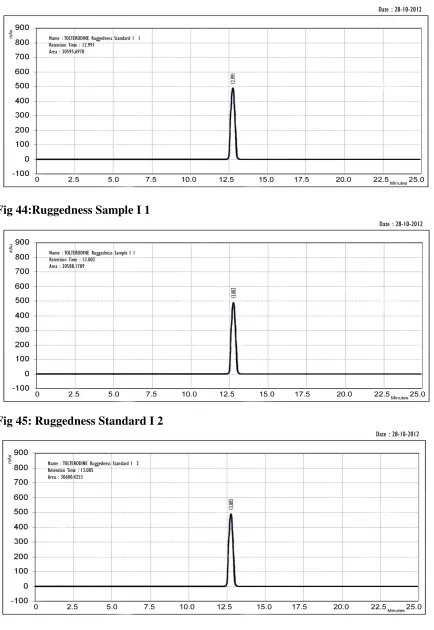
RUGGEDNESS:
Determination of ruggedness:
By analysis of aliquots from homogenous lots in different laboratories, by different analysis, using operational and environmental conditions that may differ but are still within the specified parameters of the assay. Degree of reproducibility of test results is then determined as a function of the assay variables.
SYSTEM SUITABILITY
:-According to USP system suitability are an integral part of chromatographic methods. These tests verify that the resolution and reproducibility of the system are adequate for the analysis to be performed. One consequence of the evaluation of robustness and ruggedness should be that a series of system suitability parameters is established to ensure that the validity of the analytical method is maintained whenever used.
System suitability tests are based on the concept that the equipment, electronics, analytical operations and samples constitute an integral system that can be evaluated as a whole.
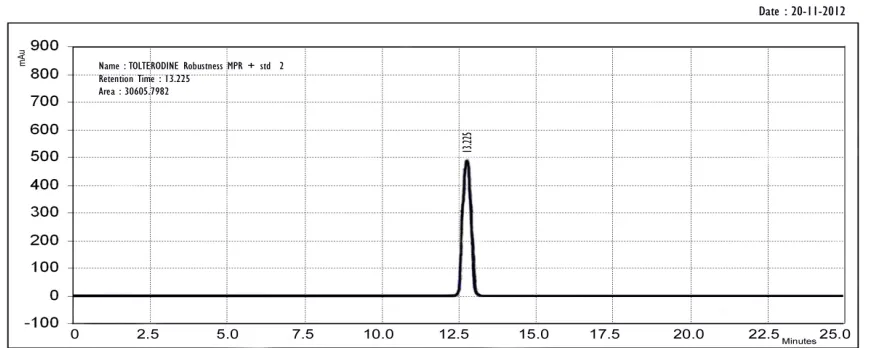
ROBUSTNESS:
Robustness of an analytical method is measure of its capacity to remain unaffectedly small but deliberate variations in method parameters and provides an indication of its reliability during normal usage.
INTERNATIONAL COMMITTEE ON HARMONIZATION (ICH) RECOMMENDATION
ASSAY TYPE VALIDATIONS
Identification tests area intended to ensure the identity of an analyte in a sample. This is
normally achieved by comparison of a property of the sample to that of a reference
standard.
Specificity
Impurities Quantitation are intended to accuately reflect the purity characteristic of
the sample. Different validation characteristics are required for a quantitative
test than for a limit test.
Accuracy, Precision, Specificity, Detection
limit, Quantitation limit, Linearity, Range.
Impurites limit are intended to reflect the
purity characteristics of the sample Specificity, Detection limit Content/ Potency; Dissolution are intended to
measure the analyte present in a given sample. A quantitative measurement of the
major components in the drug substance.
In the ICH-2QA: Text on Validation Analytical procedures, validation characteristics
versus type of analytical procedures are shown in following table
VALIDATION CHARACTERISTICS VERSUS TYPE OF ANALYTICAL PROCEDURES TEST FOR IMPURITIES
Type of
procedure Identification Quantitation Limit
Dissolution Measurement (content/Potency)
Accuracy No Yes No Yes
Precision
/repeatability No Yes No Yes
Intermediate
Precision No Yes
a No Yesa
Specificity Yes Yes Yes Yes
Detection limit No Nob
Yes No
Quantitation
limit No Yes No No
Linearity No Yes No Yes
Range No Yes No Yes
a. When reproducibility is performed. Intermediate precision is not needed. b. May be needed in some cases.
The ICHQ2B: Validation of Analytical procedures, describes the main objective of validation as the ability of an analytical procedure to demonstrates that the procedure is suitable for its intended purpose. The document stresses that well-characterized reference materials, with documented purity, should be used throughout the validation study.
The comparison of different official guidelines in case of parameters required to be validated for different assays is shown in following table
CRITERIA GMP FDA USP ICH
Accuracy X X X X
Precision X X X
Specificity X X X X
Detection limit X X
Quantitation
limit X X
Linearity X X X
Range X X
Reproducibility X X
Sensitivity X
Recovery X
LITERATURE REVIEW
Yanamandra R et al20
., developed a new rapid, simple, sensitive, selective and accurate
reversed-phase stability-indicating Ultra Performance Liquid Chromatography (RP-UPLC) technique for the assay of Tolterodine Tartrate in pharmaceutical dosage form, human plasma
and urine samples. The developed UPLC method is superior in technology to conventional HPLC with respect to speed, solvent consumption, resolution and cost of analysis. Chromatographic run time was 6 min in reversed-phase mode and ultraviolet detection was carried out at 220 nm for quantification. Efficient separation was achieved for all the degradants of Tolterodine Tartrate on BEH C18 sub-2-µm Acquity UPLC column using Trifluoroacetic acid and acetonitrile as organic solvent in a linear gradient program. The active pharmaceutical ingredient was extracted from tablet dosage form using a mixture of acetonitrile and water as diluent. The calibration graphs were linear and the method showed excellent recoveries for bulk and tablet dosage form. The test solution was found to be stable for 40 days when stored in the refrigerator between 2 and 8 °C. The developed UPLC method was validated and meets the requirements delineated by the International Conference on Harmonization (ICH) guidelines with respect to linearity, accuracy, precision, specificity and robustness. The intra-day and inter-day variation was found be less than 1%. The method was reproducible and selective for the estimation of Tolterodine Tartrate. Because the method could effectively separate the drug from its degradation products, it can be employed as a stability-indicating one.
Dwibhashyam VS et al21
With a short chromatographic run time, the proposed method can be used for the estimation
of large number of quality control samples in a short period.
Xia ZL et al22
.,developed a high-performance liquid chromatographic method for the separation of the enantiomers of tolterodine tartarate. The proposed method was applied to the determination of (S)-isomer in (R)-tolterodine tartarate, and satisfactory results were obtained. The enantiomers of tolterodine tartarate were separated on a Chiralpak AD-H (250 mm x 4.6 mm) column containing amylase tris-(3,5-dimethylphenyl-carbamate) at room temperature. The mobile phase consisted of n-hexane and isopropyl alcohol in the ratio of 85:15 (v/v) with 0.075% triethylamine (TEA) and 0.05% trifluoroacetic acid (TFA) as the additive. The flow rate was kept at 0.5 ml/min, and UV detection wavelength was set at 283 nm. The calibration curves of (S)-enantiomer in the concentration range from 0.05 microg/ml to 1 microg/ml range were linear. The relative standard deviations of within-day and between-day were less than 2% (n = 3). The limit of detection (LOD) was 0.75 ng (S/N = 3) and the limit of quantification (LOQ) was 0.05 microg/ml (RSD < 4.1%, n = 3). The determination recoveries of the (S)-enantiomer were in the range of 98.2-104.8%. The results demonstrated that the developed HPLC method was a reliable, simple technique and was applicable to the purity determination of (R)- tolterodine tartarate.
Guan Y et al23
.,developed and validated a sensitive, selective and efficient liquid chromatographic/tandem mass spectrometric (LC/MS/MS) method for the determination of glucosamine in healthy human urine. Urine samples were extracted by acetonitrile and derivatized with o-phthalaldehyde/3-mercaptopropionic acid. Analysis was then carried out using ESI source and methanol/0.2% ammonium acetate-0.1% formic acid mobile phase gradient elution, with tolterodine tartrate as the internal standard. The linear calibration curve ranged from 0.41µg/ml to 82.7µg/ml. The intra-day and inter-day precisions were less than 3.93% and 10.0%, respectively. The extraction recoveries determined at three concentration levels were higher than 88.6%. The method was successfully applied for determining the urine concentration of glucosamine up to 24h after oral administration of 1g glucosamine sulfate dispersible table (containing 785.08mg glucosamine) from a clinical pharmacokinetic study in healthy volunteers.
Macek J et al24
chromatography performed on a silica column (30mmx4.6mm, 3microm particles), the
mobile phase consisted of acetonitrile-20mM ammonium acetate (70:30, v/v). Quantification was through positive-ion m` ode and selected reaction monitoring at m/z 326-->147 for tolterodine, 342-->223 for the 5-hydroxymethyl metabolite and 260-->183 for the internal standard propranolol, respectively. The lower limit of quantitation was 49 and 46pg/ml using 0.5ml of plasma for the parent drug and its metabolite, respectively and linearity was observed up to 30ng/ml. Within-day and between-day precision expressed by relative standard deviation was less than 11% and inaccuracy did not exceed 7% at all levels. The assay was applied to the analysis of samples from a pharmacokinetic study.
Xia ZL et al25
.,developed a high-performance liquid chromatographic method for the separation of the enantiomers of tolterodine tartarate. The proposed method was applied to the determination of (S)-isomer in (R)-tolterodine tartarate, and satisfactory results were obtained. The enantiomers of tolterodine tartarate were separated on a Chiralpak AD-H (250 mm x 4.6 mm) column containing amylase tris-(3,5-dimethylphenyl-carbamate) at room temperature. The mobile phase consisted of n-hexane and isopropyl alcohol in the ratio of 85:15 (v/v) with 0.075% triethylamine (TEA) and 0.05% trifluoroacetic acid (TFA) as the additive. The flow rate was kept at 0.5 ml/min, and UV detection wavelength was set at 283 nm. The calibration curves of (S)-enantiomer in the concentration range from 0.05 microg/ml to 1 microg/ml range were linear. The relative standard deviations of within-day and between-day were less than 2% (n = 3). The limit of detection (LOD) was 0.75 ng (S/N = 3) and the limit of quantification (LOQ) was 0.05 microg/ml (RSD < 4.1%, n = 3). The determination recoveries of the (S)-enantiomer were in the range of 98.2-104.8%. The results demonstrated that the developed HPLC method was a reliable, simple technique and was applicable to the purity determination of (R)- tolterodine tartarate.
Böttiger Y et al26
carbamazepine (five patients), and on the 6th day of 4 mg twice-daily tolterodine (12
subjects). Five subjects also took 100 mg and 50 mg of ketoconazole for 3 days before concomitant intake with omeprazole. The mean log10(omeprazole/omeprazole sulfone) ratio was 0.18 3 h after intake of omeprazole alone. After concomitant intake of ketoconazole, the corresponding value was 1.38 (p<0.001); after intake of carbamazepine it was -0.42 (p<0.05); and after tolterodine it was 0.29 (not significant). In the five subjects taking increasing doses of ketoconazole, the ratio was 0.11, 0.79, 1.2, and 1.5 after 0, 50, 100, and 200 mg of ketoconazole, respectively. The correlation between the metabolic ratios from the AUC((0-6h)) and from the single 3-h samples was very good, with a correlation coefficient of 0.92 (p<0.001). A single blood sample taken 3 h after intake of 20 mg of omeprazole can be reliably used to phenotype for both CYP2C19 and CYP3A4 activity.
Zhang B et al27
.,developed a selective and sensitive high performance liquid chromatography-electrospray ionization mass spectrometry method for the determination of tolterodine tartrate in human plasma. With oxybutynin as internal standard, tolterodine
tartrate was extracted from plasma with n-hexane: isopropanol (95:5, v/v). The organic layer was evaporated and the residue was redissolved in mobile phase comprised of acetonitrile-water (10 mM CH3COONH4, pH 3.0)=50:50 (v/v). An aliquot of 10 microl was chromatographically analyzed on a prepacked Shimadzu Shim-pack VP-ODS C18 column (150 mmx2.0 mm I.D.) by means of selected-ion monitoring (SIM) mode mass spectrometry. Standard curves were linear (r=0.9993) over the concentration range of 0.1-30.0 ng/ml and had good accuracy and precision. The within- and between-batch precisions were within 10% relative standard deviation. The limit of detection (LOD) was 0.05 ng/ml. The validated LC-ESI-MS method has been used successfully to study tolterodine tartrate pharmacokinetic, bioavailability and bioequivalence in 20 healthy male volunteers.
Hosseinpour F et al28
.,carried a work on the following ,Porcine CYP2D25, microsomal vitamin D(3) 25-hydroxylase, catalyzes the essential first step in the bioactivation of the prohormone vitamin D(3). Although CYP2D25 shows a high degree of sequence identity
mutated to the equivalent residues in CYP2D6, an enzyme not active in 25-hydroxylation.
Western blot analysis of microsomes from transformed yeast cells showed that both the wild-type and mutant CYP2D25 were expressed at comparable levels. The 25-hydroxylase activity of recombinant mutant CYP2D25 was completely lost whereas the activity toward tolterodine remained virtually unaffected. The results implicate that residues in SRS-3 of CYP2D25 are important determinants for its function in vitamin D(3) metabolism.
Swart R et al29
.,developed a method where a capillary solid-phase extraction (SPE) system has been coupled directly to electrospray tandem mass spectrometry for quantification of free tolterodine and metabolite concentrations in plasma. The unbound fraction of these compounds was obtained by ultrafiltration of plasma. The ultrafiltrate was directly injected onto the SPE capillary (4 mm x 200 microm, 5 microm C18). After desalting and clean-up of the sample, the analytes were eluted in backflush mode with methanol-1 mM triethylamine (70:30, v/v), providing considerable solute focusing. Elution from the SPE capillary was improved by inserting a short trapping capillary between the SPE capillary and the MS
AIM AND OBJECTIVE OF WORK
Literature review reveals that few methods have been published for analysis of Tolterodine tartrate tablets in the biological fluids and samples. But the methods are somewhat costlier as they are using costlier solvents and the detectors used by them are mostly PDA detectors. So, the objective of this work was to develop and validate an isocratic RP-HPLC method for quantitative analysis of Tolterodine tartrate in tablet dosage form which is very easy for the analyst to analyse and by using the economic
solvents with UV detector as this detector is commonly available detector.
PLAN OF WORK
Method Development Parameters Done By RP-HPLC Selection of detector wavelength
Selection of column
Selection of mobile phase composition and pH Selection of flow rate
Validation of the Developed Method a) Linearity
b) System precision c) Method precision d) Specificity
e) Accuracy f) Ruggedness
g) Robustness
h) Limit of detection and quantification i) Solution stability
DRUG PROFILE
Tolterodine tartrate
Description : White-to-Off-White Crystalline PowderIUPAC Name : (R)-2-(3-(Bis(1-methylethyl)amino)-1-phenylpropyl)-4-methylphenol (R-(R',R'))-2,3-dihydroxy butanedioate
Synonym : (+)-R)-2-{a-[2-(Diisopropylamino)ethyl]benzyl}-p-cresol tartrate Chemical Formula : C26H37NO7
Chemical Structure :
Molecular Weight : 475.6 Melting Point : 205-210°C
Solubility : The solubility in water is 12 mg/mL. It is soluble in methanol, slightly soluble in ethanol, and practically insoluble in toluene.
INSTRUMENTS AND REAGENTS
InstrumentsSl.No Name of the instrument Make Model
1 UV-VIS Double beam
Spectrophotometer Shimadzu AL-2401
2 HPLC-UV Agilent LC-2011
3 Millipore Millipore Simplicity
4 Electronic balance Shimadzu AD220D
Reagents and Chemicals
S.NO Name Grade Manufacturer/Supplier
1 ACN HPLC MERCK
2
Di sodium hydrogen
Phosphate
HPLC MERCK
3 Millipore water -
-4 Phosphoric acid HPLC MERCK
Standard
The reference standard Tolterodine tartrate was obtained as gift sample and authenticity and purity of the sample was certified by Ranbaxy.
Formulation
METHOD DEVELOPMENT AND OPTIMIZATION
1. Selection of wavelength
The known concentration of Tolterodine tartrate was taken and dissolved in water. The resulting solution was then scanned between 200 to 400 nm and is shown in fig 1.Maximum absorbance was found at 302nm and it was selected for the analysis of Tolterodine tartrate.
2. Optimization of Chromatographic Parameters a. Selection of mode of operation
As the drug was polar in nature, RP-HPLC was preferred.
b. Selection of mobile phase
The method development of Tolterodine tartrate required adequate resolution of the drug peak in the chromatogram. Different solvent systems were tried to get the proper resolution
3. Preparation of mobile phase
Acetonitrile and Di sodium hydrogen phosphate in the ratio 27:73 was taken and the pH of the mobile phase was maintained at 7.6 with phosphoric acid and it was filtered. Then it was degassed.
4. Selection of flow rate
The flow rate for Tolterodine tartrate was tried at different rates. Finally 1ml/min was selected at which the peak was free from any fronting or tailing effects.
Preparation of Phosphate Buffer (pH 7.6):
Place 50 ml of 0.2M potassium dihydrogen phosphate in a 200ml volumetric flask, add 42.4ml of 0.2M sodium hydroxide and then add water to volume.
5. Determination of retention time
Standard solution of Tolterodine tartrate:
with diluent. Then from the resulting solution 1ml was taken and made upto
10ml with diluents. The solution was then filtered through 0.45µ membrane filter.
20µl of the solution was injected and the chromatogram was recorded
and it is shown in fig 3.
FIXED CHROMATOGRAPHIC CONDITIONS
Instrument : AGILENT LC-2011with UV-VIS Detector
Column : C18
Wavelength : 302nm
Flow rate : 1ml/min
Injection : 20µl
Mobile Phase : Buffer: ACN (73:27) pH maintained at 7.6 with
phosphoric acid
QUANTITATIVE ESTIMATION OF THE DRUG
Sample : Tolterodine tartrateLabel claim : 1mg
Standard solution of Tolterodine tartrate
100mg of Tolterodine tartrate standard was accurately weighed and transferred into a 100ml volumetric flask. Then diluent was added and the volume was made upto the mark. From the stock solution 10ml was pipetted out into a 100ml volumetric flask and the volume was made up to the mark with diluent. Then from the resulting solution 1ml was taken and made upto 10ml with diluents. The solution was then filtered through 0.45µ membrane filter.
Sample preparation
20 Tolterodine tartrate tablets were randomly selected, weighed and their average weight was calculated. Then the sample equivalent to 100mg was weighed and transferred into a 100ml volumetric flask. Diluent was added and then the volume was made up to the mark. The solution was then shaken well to dissolve the contents and then filtered.10ml of the filtrate was diluted to 100ml
with diluent. Then from the resulting solution 1ml was taken and made upto 10ml with diluents. The solution was then filtered through 0.45µ membrane filter.
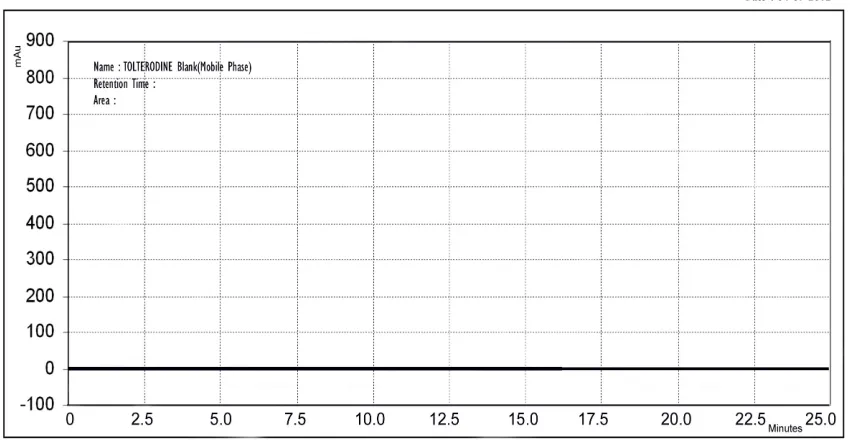
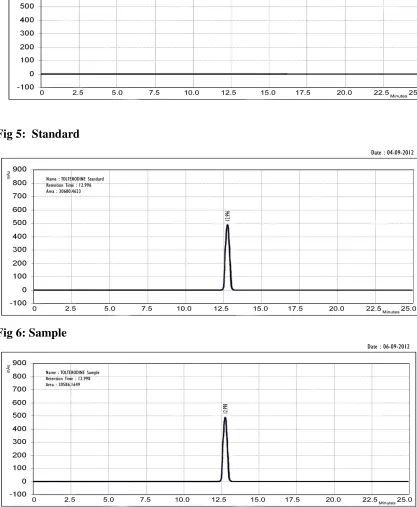
The amount of Tolterodine tartrate present in the tablet formulation was calculated by comparing the peak area of the standard and sample which is given in fig 5 & 6. The reports are given in table 1.
Amount of drug present in the tablet =
Sample area Standard dilution Potency
--- x --- x --- x Average weight of tablet Standard area Sample dilution 100
Percentage content = --- x 100 Label claim
VALIDATION
Validation of an analytical method is a process to establish by laboratory studies that the performance characteristics of the method meet the requirements for the intended analytical application. Performance characteristics are expressed in terms of analytical parameters.
Design of experiment:
Typical analytical parameters used in assay validation are,
• Specificity
• Linearity and range
• Limit of quantification
• Limit of detection
• Accuracy
• Precision
- System precision - Method precision
• Robustness
• Ruggedness
• System suitability studies - Resolution