Copyright © 2000, American Society for Microbiology. All Rights Reserved.
In Vivo Genomic Footprinting of the Human T-Cell Leukemia Virus
Type 1 (HTLV-1) Long Terminal Repeat Enhancer Sequences
in HTLV-1-Infected Human T-Cell Lines with
Different Levels of Tax I Activity
SHOIBAL DATTA, NAYANTARA H. KOTHARI,ANDHUNG FAN* Cancer Research Institute and Department of Molecular Biology and Biochemistry,
University of California, Irvine, California 92697 Received 19 April 2000/Accepted 16 June 2000
The Tax protein of human T-cell leukemia virus type 1 (HTLV-1) enhances viral gene expression through sequences in the U3 region of the viral long terminal repeat. These sequences consist of three imperfect 21-bp repeats (TRE-1s) and a region between the promoter-central and promoter-proximal 21-bp repeats (TRE-2). The TRE-1s contain a core cyclic AMP response element (CRE) motif and can be bound by CREB, ATF-1, ATF-2, and other members of the CREB-ATF superfamily of transcription factors. Tax enhances CREB binding to TRE-1 in vitro, and it promotes dimerization of CREB as well as other bZIP proteins. Using ligation-mediated PCR on in vivo dimethyl sulfate-treated HTLV-1-infected cell lines MT-2 and MT-4, we have compiled a profile of protein occupancy in the HTLV-1 enhancer sequences in the presence of high (MT-2) and low (MT-4) levels of biologically active Tax I. The in vivo footprinting showed that all three TRE-1s were bound by protein(s), but only in MT-2 cells. In MT-2 cells, all TRE-1s showed strong protection of the G residues in the central CRE, and the footprints extended to differing degrees into the GC-rich flanking sequences. This indicated Tax I-dependent loading of transcription factors onto the HTLV-1 TRE-1s in vivo. In vivo footprinting on TRE-2 in-dicated that this region was bound by proteins regardless of the Tax I status of the cell line. However, the presence of Tax I increased the extent and altered the profile of proteins binding TRE-2 in vivo.
Human T-cell leukemia virus type 1 (HTLV-1) is the caus-ative agent of adult T-cell leukemia and HTLV-1-associat-ed myelopathy/tropical spastic paraperesis (11, 31, 35, 49). HTLV-1 is the prototype of the HTLV-bovine leukemia virus family of complex retroviruses. It encodes a protein, Tax I, that enhances viral gene expression through sequences in the U3 region of the viral long terminal repeat (LTR) (7, 8, 40). Tax I can activate the viral promoter as well as a wide number of cellular promoters (2, 13, 15, 16, 23). It is generally believed that Tax I enhances transcription by interacting with cellular transcription factors that, in turn, bind the target DNA se-quences.
The organization of the HTLV-1 LTR is illustrated in Fig. 1. The elements that impart Tax I responsiveness to the LTR consist of three imperfect 21-bp repeats (TRE-1s) (4, 9, 33, 36, 37, 39) and a region between the promoter-central and pro-moter-proximal 21-bp repeats (TRE-2) (24, 28). Each TRE-1 contains a near-consensus cyclic AMP response element (CRE) as well as GC-rich flanking sequences. At least two TRE-1s are required for activation by Tax (4, 24, 28, 36). Since Tax I does not efficiently bind TRE-1 DNA in vitro by itself (1, 12, 29), previous studies have focused on identifying cellular proteins that bind TRE-1 directly or in conjunction with Tax I. By a variety of in vitro techniques, these studies have identified CREB and other members of the CREB/ATF superfamily of transcription factors as the primary proteins that specifically interact with TRE-1 (17, 30, 42, 44, 50). All of the cellular proteins that bind the TRE-1 DNA or Tax I are bZIP proteins.
It has also been shown that Tax I promotes dimerization of bZIP proteins and DNA binding (3, 34, 45).
The GC-rich flanking sequences are required for activation of each TRE-1 by Tax I both in vivo and in vitro (5, 10, 17, 28, 32, 51). It has recently been shown that Tax I can contact the DNA within the GC-rich flanking sequences in vitro (22). These contacts are at symmetric positions on either side of the CRE (19). Tax may act as an anchor for recruiting the cellular coactivator CREB-binding protein to the transcription com-plex.
The HTLV TRE-2 region, between the promoter-central and promoter-proximal TRE-1s, can also mediate transactiva-tion by Tax I (24, 28). TRE-2 is not capable of Tax response by itself; it can impart a Tax response only in the presence of at least one TRE-1 (28). TRE-2 contains binding sites for a large number of transcription factors, including AP-2, HNF-3, Ets family members, NFB, and Sp1.
In this study, we have analyzed the in vivo protein occupancy of the HTLV-1 LTR in infected human T-cell lines by in vivo dimethylsulfate (DMS) footprinting. This is an important issue for HTLV-1 (as well as all other retroviruses), since actual regulation of the viral LTR occurs when the provirus is orga-nized in the host cell chromatin. Although the previous in vitro studies were essential for dissecting the molecular mechanisms of Tax I activation, it has been unclear if all of the protein-DNA interactions predicted from the in vitro experiments oc-cur in vivo in HTLV-1-infected cells. The in vivo footprinting described in this report addressed this question and provided interesting (and sometimes unexpected) answers.
MATERIALS AND METHODS
Cell lines.In vivo footprinting was performed on the cell lines MT-4 (21) and MT-2 (26), both human T-cell cell lines isolated from cord blood lymphocytes that were cocultured with cells from patients with adult T-cell leukemia. The
* Corresponding author. Mailing address: Cancer Research Insti-tute, Department of Molecular Biology and Biochemistry, University of California, Irvine, CA 92697. Phone: (949) 824-5554. Fax: (949) 824-4023. E-mail: hyfan@uci.edu.
8277
on November 9, 2019 by guest
http://jvi.asm.org/
AIDS Research and Reference Reagent Program provided the MT-4 and MT-2 cells used in this study. The cell lines were cultured in RPMI 1640 medium supplemented with 10% fetal bovine serum.
Transfections and reporter assays.MT-2 or MT-4 cells were cotransfected with pHTLV-I LTR-SEAP (a reporter construct with the HTLV-1 LTR driving the secreted alkaline phosphatase reporter gene [SEAP] and either pRL-null (a
promoterlessRenillaluciferase reporter plasmid; Promega) or pRL-tk (aRenilla
luciferase reporter plasmid driven by the herpes simplex virus thymidine kinase gene promoter; Promega). The ratio of reporter to coreporter DNA was 15:1.
Transfections were carried out in triplicate using 4g of total DNA per
trans-fection. The reagent used for the transfections was DMRIE-C (Gibco/BRL), and cells were transfected according to the manufacturer’s instructions. The medium was sampled for SEAP activity 72 h posttransfection. The assays for SEAP were performed using a Phospha-Light chemiluminescent reporter gene assay kit (Tropix, Inc.) according to the manufacturer’s instructions.
Western blots.Whole-cell protein lysates from MT-2 and MT-4 cells were separated by sodium dodecyl sulfate-polyacrylamide gel electrophoresis (SDS-PAGE) on a 10% gel, and the proteins were transferred to a nitrocellulose membrane by using a semidry transfer unit. The membrane was then blocked in a solution of Tris-buffered saline containing 5% bovine serum albumin and 0.05% Tween 20 for 1 h at room temperature and incubated with a polyclonal antibody to Tax I (a kind gift from K.-T. Jeang, Bethesda, Md.) in blocking solution overnight at 4°C. The membrane was then washed repeatedly with a solution of 0.05% Tween 20 in Tris-buffered saline and incubated with a secondary antibody conjugated to horseradish peroxidase for 1 h at room temperature. The mem-brane was then washed as above, developed with reagents for chemiluminescent detection (Pierce), and exposed to film.
In vivo DMS treatment of HTLV-1-infected cells.Exponentially growing sus-pension cultures of MT-2 and MT-4 cells were counted and harvested by
cen-trifugation at 500⫻g. To obtain partial DMS methylation in vivo, three
inde-pendent samples of 0.5⫻108to 1⫻108cells were treated with 1 ml of growth
medium containing 1% DMS for 1 min at 37°C. Exposure to DMS was stopped by the addition of 49 ml of ice-cold phosphate-buffered saline (PBS) followed by immediate low-speed centrifugation. Residual DMS was removed by an addi-tional PBS wash. The pelleted cells were resuspended in 0.3 ml of PBS. Genomic DNA was harvested by the addition of 2.7 ml of cell lysis solution (300 mM NaCl, 50 mM Tris-Cl [pH 8.0], 25 mM EDTA [pH 8.0], 0.2% [vol/vol] SDS, 0.2 mg of proteinase K/ml). As a control, genomic DNA was also harvested from untreated MT-4 and MT-2 cultures in parallel. The samples were incubated at 37°C for 4 h to overnight, after which the genomic DNA was phenol-chloroform extracted and ethanol precipitated.
In vitro DMS treatment of DNA.Genomic DNA from control cultures was
subjected to DMS treatment in vitro by incubation with 1% DMS in H2O for 1
min at 25°C. The reaction was stopped by the addition of ice-cold DMS stop
buffer (1.5 M sodium acetate [pH 7.0], 1 M-mercaptoethanol, 100g of yeast
tRNA/ml) immediately followed by the addition of 2.5 volumes of ethanol on dry
ice. Samples were precipitated by incubation at⫺70°C for at least 30 min and
pelleted by centrifugation in a microcentrifuge for 15 min at 4°C. DNA pellets
were allowed to air dry for 10 min and resuspended in 200l of 1 M piperidine
in H2O for 15 min at room temperature prior to cleavage.
Piperidine cleavage.Following in vivo and in vitro DMS treatment, genomic DNA from each cell type was cleaved at all methylated guanine residues by
incubation in 200l of 1 M piperidine for 30 min at 90°C. The piperidine was
removed by lyophilization, and the cleaved DNA pellets were resuspended in 360
l of TE buffer (10 mM Tris-Cl, 1 mM EDTA [pH 7.5]). Residual piperidine was
removed by two successive ethanol precipitations (addition of 40l of 3 M
sodium acetate followed by 1 ml of 100% ethanol) and incubation for 30 min at
⫺70°C. DNA samples were pelleted by microcentrifugation for 15 min at 4°C and
resuspended in 500l of TE buffer. The DNA pellets were ethanol precipitated
a second time by the addition of 170l of 8 M ammonium acetate plus 670l
of isopropanol and incubation for at least 30 min at⫺70°C. The precipitated
samples were pelleted by centrifugation as above, washed with 500l of 75%
ethanol, and centrifuged for 5 min at room temperature. The resulting DNA
pellets were resuspended in double-distilled H2O at a final concentration of 0.4
g/l.
LMPCR.Two micrograms of DMS-treated, piperidine-cleaved genomic DNA was used for ligation-mediated PCR (LMPCR) as described by Mueller and Wold (27), with minor modifications. Single-stranded DNA fragments with gua-nine residues at both termini result from the DMS treatment and piperidine cleavage. To provide appropriate substrates for linker ligation, double-stranded, blunt-ended molecules were generated by primer extension from an HTLV-1-specific oligonucleotide (Fig. 1, oligo 1). This first-strand primer extension was
accomplished by incubation of 2g of DMS-treated, piperidine-cleaved DNA
with 0.3 pmol of oligo 1, 1⫻Vent DNA polymerase buffer (New England
Biolabs), 4 mM MgSO4, 0.25 mM deoxynucleoside triphosphates (dNTPs), and
0.5 U of Vent DNA polymerase (New England Biolabs) in a total volume of 30
l. The DNA was denatured at 95°C for 5 min, annealed by incubation at 55°C
for 20 min, and extended by a subsequent incubation of 10 min at 72°C. Ligation of the unidirectional linker as described by Mueller and Wold (27) (Fig. 1) was
completed by the addition of 20l of 110 mM Tris-Cl (pH 7.5)–17.5 mM
MgCl2–50 mM dithiothreitol and 25l of 10 mM MgCl2–20 mM dithiothreitol–3
mM ATP (pH 7.0)–4M unidirectional linker (in 50 mM Tris-Cl [pH 7.7])–3 U
of T4 DNA ligase (Gibco/BRL). This mixture was incubated at 17°C overnight, after which the DNA was recovered by ethanol precipitation. The precipitated
DNA pellet was resuspended in 50 l of H2O, and PCR amplification was
accomplished by the addition of 50l of a mixture containing 2⫻Vent buffer,
8 mM MgSO4, 5 mM dNTP mix, 1 pmol of HTLV-1 oligo 2 (Fig. 1), 1 pmol of
LMPCR.1 (Table 1), and 1 U of Vent DNA polymerase. These samples were placed in a thermocycler and cycled 17 times using a profile of 95°C for 1 min, 66°C for 2 min, and 72°C for 1 min, with a final extension of 10 min at 72°C. Following amplification, HTLV-1-specific PCR products were labeled by the
addition of 5l of labeling buffer (2 mM each dNTP, 1⫻Vent polymerase buffer,
8 mM MgSO4, 1 U of Vent polymerase, 2.3 pmol of an HTLV-1-specific32
[image:2.612.128.471.72.203.2]P-end-labeled oligonucleotide [Fig. 1, oligo 3]) and subjected to two rounds of ampli-fication at 95°C for 1 min, 69°C for 2 min, and 72°C for 1 min. Each reaction product was then phenol-chloroform extracted and ethanol precipitated prior to electrophoresis on a 6% sequencing polylacrylamide gel. The reactions were visualized by autoradiography using Kodak BioMax MR film and analyzed by storage phosphor technology using a Molecular Dynamics 445 SI PhosphorIm-ager and ImageQuant software.
FIG. 1. Schematic of the HTLV-1 LTR and relative positions of oligonucleotides used for LMPCR.⫹1 signifies the start site of transcription. Relative positions of the HTLV-1-specific oligonucleotides used in LMPCR (see Materials and Methods for details) are also shown. Oligonucleotides ending in -S were used to analyze the lower strand, while those ending in -AS were used to analyze the upper strand.
TABLE 1. Sequences of oligonucleotides used for LMPCR
Name Sequence
1-S...5⬘GCCCCAATATCCCCCGG 3⬘
2a-S...5⬘GCCTTAGAGCCTCTCAGTGAAAAACATTTCCGT 3⬘
3a-S...5⬘GAGCCTCTCAGTGAAAAACATTTCCGTGAAACAG 3⬘
2b-S...5⬘CTAAAGACAAATCATAAGCTCAGACCTCCGGG 3⬘
3b-S...5⬘TCATAAGCTCAGACCTCCGGGAAGCCACC 3⬘
1-AS...5⬘TCGTAACTGGAGGGACCGGG 3⬘
2a-AS...5⬘TTCAGGAGGCACCACAGGCGGG 3⬘
3a-AS...5⬘CCACAGGCGGGAGGCGGCAGAA 3⬘
2b-AS...5⬘GGACGGCTTGACAAACATGGGGAGG 3⬘
3b-AS...5⬘CTTGACAAACATGGGGAGGAAATGGGTGGT 3⬘
LMPCR.1...5⬘-GCGGTGACCCGGGAGATCTGAATTC-3⬘
LMPCR.2...5⬘-GAATTCAGATC-3⬘
on November 9, 2019 by guest
http://jvi.asm.org/
[image:2.612.53.294.261.383.2]Oligonucleotide sequences.A schematic of the relative positions of the oligo-nucleotides used for LMPCR is shown in Fig. 1. The sequences of the nested HTLV-1 primer set used for LMPCR are shown in Table 1. LMPCR.1 and LMPCR.2 are the unidirectional linkers described by Mueller and Wold (27).
RESULTS
To identify the patterns of protein binding to the HTLV-1 U3 region in vivo, we used in vivo DMS footprinting and LMPCR on the HTLV-1-infected cell lines MT-2 and MT-4. In this technique, the cells were initially treated in vivo with DMS under conditions that resulted in the partial methylation of guanine residues at the N-7 position. DNA was then ex-tracted from the cells and treated with piperidine, which spe-cifically cleaves at methylated bases. The cleaved DNA was then subjected to a primer extension reaction using an HTLV-1-specific oligonucleotide. This resulted in double-stranded DNA terminating at guanine residues that were methylated and cleaved on the opposite strand from the primer. The dou-ble-stranded DNA was then blunt-end ligated to a double-stranded linker, thus making it amenable to amplification by nested PCR. This amplification was performed using oligonu-cleotides specific for the linker and the HTLV-1 U3 region. The amplified DNA was then subjected to a final round of extension using an end-labeled HTLV-1 U3-specific oligonu-cleotide, and the reaction products were visualized by PAGE on a DNA sequencing gel followed by autoradiography or phosphorimaging. As a control, high-molecular-weight DNA was isolated from the appropriate cell line, treated with DMS in vitro, cleaved with piperidine, and processed in parallel with the in vivo samples. If proteins occupy the DNA, then the guanine residues within the occupied region will have re-stricted access to DMS. This will result in a protection from methylation, reflected by diminished intensities of the corre-sponding bands on the autoradiograph compared to the con-trol (in vitro-methylated) DNA. Alternatively, hypersensitivity to DNA methylation has also been noted at bases where pro-tein is bound to DNA; this is due to increased localization of DMS created by hydrophobic pockets at the interface of glob-ular protein domains and DNA or to alterations in the local topology of the DNA induced by protein binding. Hypersen-sitivity is reflected by a marked increase in the intensity of a band for in vivo-methylated DNA compared to control in vitro-methylated DNA.
Tax I activity in MT-2 and MT-4 cells. To determine the
effect of Tax I on protein binding to the HTLV-1 LTR, we analyzed two infected cell lines, MT-2 and MT-4, generated by cocultivation of human cord blood with cells from patients infected by HTLV-1 (21, 26). Although both cell lines contain proviral DNA, MT-2 is a high-level producer of HTLV-1, whereas MT-4 does not produce detectable virus. The expres-sion defect in MT-4 cells has been shown to be extensive methylation of the proviral genome (38). This defect is revers-ible upon treatment with 5-azacytidine, an inhibitor of meth-ylation (38). Upon treatment with 5-azacytidine, MT-4 cells make viral RNA and protein at levels that are comparable to those produced by MT-2, suggesting that MT-4 cells contain all transcription factors necessary to transactivate the HTLV-1 LTR. There has been some question recently about the origins and behavior of MT-4 cells obtained from different sources (18). Also, there have been different reports on the amount of Tax protein made by MT-4 cells. While some investigators reported that they make very low amounts of Tax I protein (38), others reported amounts almost equivalent to those pro-duced by MT-2 (18). To characterize the relative amounts of biologically active Tax I protein in our MT-2 and MT-4 cells, we determined their abilities to activate a Tax I-responsive reporter plasmid in a transient transfection assay. The reporter plasmid contained the SEAP gene under the control of the HTLV-1 LTR. SEAP activity was determined 72 h posttrans-fection and is shown in Table 2. The MT-2 cell line transacti-vated the HTLV-1 LTR-SEAP construct approximately 67-fold more than the MT-4 cell line. This indicated that the MT-2 cells have substantially higher levels of biologically active Tax I protein compared to the MT-2 cells.
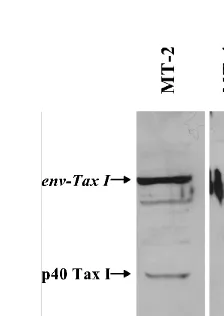
[image:3.612.53.294.82.212.2]We also analyzed the total amounts of Tax I protein in the two cell lines by Western blot analysis using a polyclonal anti-body to Tax I (Fig. 2). MT-2 cells produced slightly higher amounts of p40 Tax I compared to MT-4 cells. However, the MT-2 cells additionally produced a large amount of a ca. 70-kDa Env-Tax I fusion protein described previously (25). Thus, the MT-2 cells produce significantly higher amounts of immu-noreactive Tax I than MT-4 cells. Taken together with the reporter assays, these data also suggest that the Env-Tax I
[image:3.612.373.485.502.660.2]FIG. 2. Western blot analysis of Tax I levels in MT-2 and MT-4 cells. Whole-cell protein lysates from MT-2 and MT-4 Whole-cells were separated by SDS-PAGE and subjected to Western blot analysis using a polyclonal antibody to Tax I as described in Materials and Methods. The positions of authentic p40 Tax I as well as the Env-Tax I fusion protein made by MT-2 cells are indicated (see text for details). The band between p40 Tax I and Env-Tax I seen in both cell lines is a nonspecific band that is also observed in human T cells that do not express Tax I (not shown).
TABLE 2. Tax I activity in MT-2 and MT-4 cellsa
Cell line SEAP Renillab SEAP/Renillac Avg
MT-4 0.440 15.98 0.028
0.190 14.47 0.013 0.543 13.67 0.040
Avg 0.027
MT-2 51.14 30.43 1.681
63.31 27.23 2.283 77.89 52.07 1.496
Avg 1.82
Fold activation
(MT-2/MT-4) 67.41
aTranscriptional activation of a Tax I-responsive reporter construct in MT-2
and MT-4 cells was determined by transfecting MT-2 and MT-4 cells with pHTLV-1 LTR-SEAP (see Materials and Methods).
bpRL-null, a promoterlessRenillaluciferase construct that has low levels of
background transcription, was used as a coreporter to normalize for transfection efficiency.
cRelative SEAP activity in MT-2 or MT-4 cells after correction for
transfec-tion efficiency.
on November 9, 2019 by guest
http://jvi.asm.org/
fusion protein is most likely biologically active. In any event, the data in Table 2 indicated that, functionally, MT-2 cells were Tax Ihighwhile MT-4 cells were Tax Ilow.
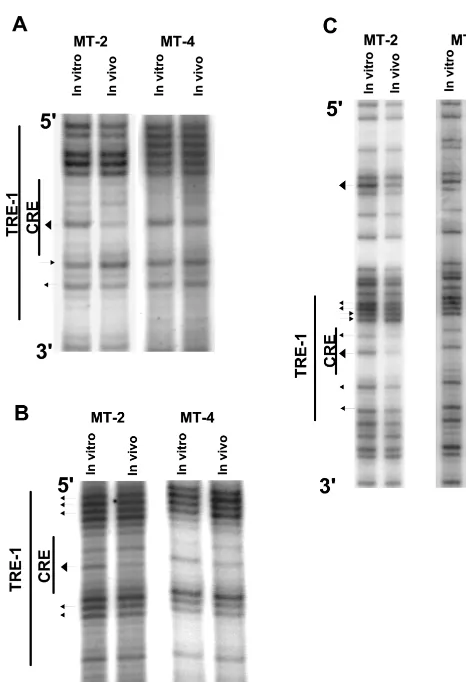
In vivo footprinting of the lower strand of the HTLV-1 TRE-1s. We first analyzed the lower (or minus) strand of the HTLV-1 U3 region in MT-2 and MT-4 cells by in vivo foot-printing (Fig. 3), as it is significantly G rich. The locations of the primers (1-S plus 2a-S/3a-S or 1-S plus 2b-S/3b-S) are shown in Fig. 1. The results for the promoter-distal TRE-1 for both cell lines are shown in Fig. 3A. While MT-4 cells showed no evidence for protein occupancy within TRE-1 (no protec-tions or hypersensitive sites), MT-2 cells showed a major pro-tection of the central guanine residue within the CRE. In addition, MT-2 cells also had one hypersensitive and one pro-tected G residue in the 3⬘ GC-rich flanking sequences. We termed protections major if the reduction in cleavage at a particular residue was greater than 50%, as quantified by phos-phorimaging (see below).
The results for the promoter-central TRE-1 for both cell lines are shown in Fig. 3B. MT-2 cells showed a major protec-tion of the central guanine within the CRE, and some of the
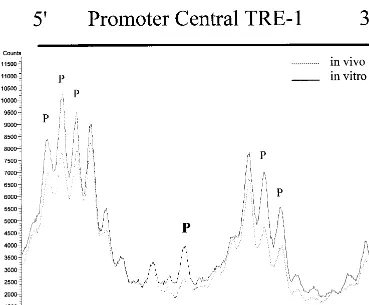
guanine residues in the 5⬘and 3⬘GC-rich flanking sequences were also protected. Quantification by phosphorimaging of the same MT-2 lanes as in Fig. 3B is shown in Fig. 4. In contrast, MT-4 cells again showed no indication of protein binding within the CRE. The mild hypersensitivity of the G residues at the 5⬘end of the TRE in MT-4 cells shown in Fig. 4 was not reproducibly observed.
Analysis of the lower strand of the promoter-proximal TRE-1 is shown in Fig. 3C. This TRE-1 showed more extensive protein binding compared to the other two TRE-1s. As for the other two TRE-1s, the central G residue within the CRE was strongly protected, and the other G residue was also protected. Two of the four G residues in the 5⬘ GC-rich flank were protected, and the remaining two were hypersensitive. The 3⬘
G residues were also protected. The lower strand also showed a major protection in a G residue downstream of the promot-er-proximal TRE-1 (5⬘on the minus strand). This residue lay in the middle of a predicted NF-1 binding site. In general, however, protected or hypersensitive G residues were not ob-served outside of the TRE-1s and TRE-2 (discussed in detail below).
In summary, in vivo footprints were detected on the lower strands of all three TRE-1s, but only in the MT-2 cells (see Fig. 6). The CRE in each TRE-1 was protected, but the footprints on the proximal, central, and distal TRE-1s differed in terms of the protections and hypersensitivities of GC-rich sequences flanking the CRE within each element.
In vivo footprinting of the upper strand of the HTLV-1
TRE-1s.Analysis of the upper (or plus) strand of the HTLV-1
U3 region is shown in Fig. 5. Due to the distance of the nested primers (2a-AS and 3a-AS) from the TRE-1s (Fig. 1), we were unable to resolve fragments for the upper strand of the pro-moter-distal TRE-1. Two other sets of primers failed to resolve this element. The footprint of the promoter-central TRE-1 is shown in Fig. 5A. This repeat has three G residues within the CRE on the upper strand. In MT-2 cells, the first two guanine residues were protected (major protection of the central G), while MT-4 cells did not shown any protections or hypersen-sitivities within this region. Analysis of the promoter-proximal TRE-1 is shown in Fig. 5B. In MT-2 cells, both guanine resi-dues within the CRE were strongly protected. Additionally, all three G residues within the 5⬘ GC-rich flank were strongly protected. Again, the MT-4 cell line did not show any appciable DNA-protein interactions within this element. The re-sults of the upper-strand analysis were consistent with rere-sults of the lower-strand analysis in that there were protections on the CRE in the central and proximal TRE-1s, but only in the MT-2 cells.
A summary of the upper-strand in vivo footprints of the HTLV-1 TRE-1s in MT-2 cells is shown in Fig. 6. Together, the results provide evidence for factor binding at the CREs in each TRE-1, and the central G residue within each CRE was strongly protected. Evidence for factor binding to sequences flanking the CRE was found for the proximal and central TRE-1s as well.
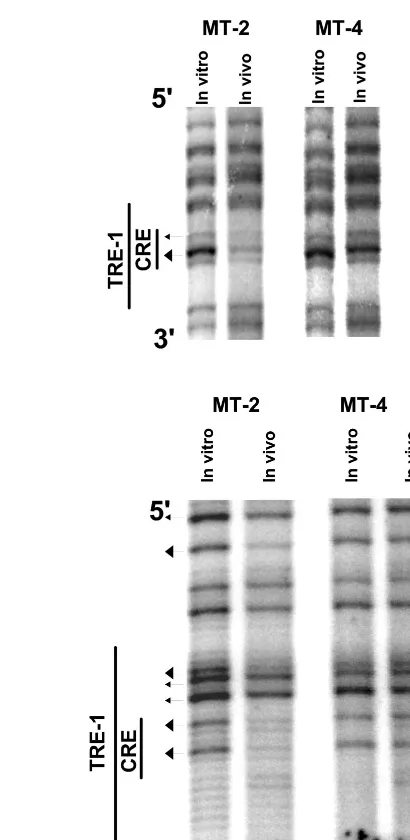
In vivo footprinting on the HTLV-1 TRE-2 sequences. We
[image:4.612.57.290.69.410.2]also analyzed the TRE-2 region between the promoter-central and promoter-proximal TRE-1s. This region contains potential binding sites for a number of transcription factors, including Sp1, NFB, the Ets family proteins PEA-3 and PU.1, HNF-3, and AP-2 (see Fig. 8). The NFB and Sp1 sites are contained in the same DNA sequences on opposite strands, and the same is true for the PU.1 and PEA-3 elements. Analysis of the lower strand of the TRE-2 is shown in Fig. 7A. In MT-4 cells, hy-persensitivity of two of the five G residues within the predicted Sp1/NFB binding site was observed. Also, three consecutive
FIG. 3. In vivo DMS footprinting of the lower strand of the TRE-1s. DNAs from in vivo DMS-treated MT-2 and MT-4 cells were piperidine cleaved and subjected to LMPCR as described in Materials and Methods. The reaction products were separated on polyacrylamide gels and exposed to film. Autora-diograms corresponding to the three TRE-1s are shown. (A) Promoter-distal
TRE-1. A band is missing in the 5⬘GC-rich flank most likely because the proviral
DNA contains a base other than the predicted guanine residue at that position. (B) Promoter-central TRE-1. (C) Promoter-proximal TRE-1. Arrowheads point-ing toward bands indicate hypersensitive residues; arrowheads pointpoint-ing away from bands indicate protected residues. Larger arrowheads indicate major pro-tections or hypersensitive sites.
on November 9, 2019 by guest
http://jvi.asm.org/
G residues in the putative AP-2 binding site were mildly pro-tected. In contrast, the MT-2 cells demonstrated a stronger and more extensive binding pattern compared to the MT-4 cell line. In MT-2 cells, all five G residues in the predicted Sp1/ NFB binding site were protected, and a number of residues were strongly protected. In addition, all G residues in the PEA-3 and AP-2 elements were either hypersensitive or pro-tected, and the protections over the AP-2 site were particularly strong.
Analysis of the upper strand of TRE-2 again showed evi-dence for DNA-protein interactions in MT-2 cells (Fig. 7B). Strong protections were observed in all three of the guanine residues within the predicted Sp1/NFB binding site, and both G residues within the HNF-3 site were also strongly protected. MT-4 cells showed a weakly protected G residue immediately 5⬘to the Sp1/NFB site, but other G residues did not show in vivo protection or sensitivity.
The footprints of the TRE-2 region in both cell lines are summarized in Fig. 8. The AP-2 site was occupied in both cell lines, but the protections in MT-2 cells were significantly stron-ger than those observed in MT-4 cells. Also, different G resi-dues were protected in the two cell lines. This raises the pos-sibility that the same site was (or was not) occupied by different protein complexes in the two cell lines. The HNF-3 site was occupied in MT-2 but not MT-4 cells, as was the PU.1/PEA-3 site. Similar to AP-2, the Sp1/NFB site was differentially bound in the two cell lines. The footprints in the Sp1/NFB region were very different between MT-2 and MT-4, suggesting that different proteins or protein complexes may occupy the sites.
We additionally observed protections in four out of the five
G residues present in both strands in the eight base pairs immediately upstream from the Sp1/NFB site in MT-2 cells. Likewise, two G residues immediately downstream from the HNF-3 site on the upper strand were protected in MT-2, al-though the G residues on the lower strand corresponding to the same region were not hypersensitive or protected. Both of these regions failed to yield matches for transcription factor binding sites when searched against the transcription factor database TRANSFAC under relatively lax parameters (mini-mum 50% match).
DISCUSSION
[image:5.612.117.486.66.371.2]In this study, we carried out in vivo footprinting on the HTLV-1 LTR in infected T-cell lines. These experiments pro-vided insight into the binding of factors to different motifs in the HTLV-1 LTR in the context of integrated proviruses. The results provide new information that complements the previ-ous extensive in vitro experiments on binding of cellular factors to HTLV-1 DNA. In particular, it was possible to test if the protein-DNA interactions predicted from the in vitro binding experiments were observed in vivo. By comparing MT-2 and MT-4 cells, it was possible to study factor binding to the HTLV-1 LTR in cells with or without functional Tax I protein. The most interesting result that emerged from this study was the fact that there was no evidence for factor binding to the TRE-1s (21-bp repeats) in MT-4 cells, while there was binding in MT-2 cells. Thus, in vivo, Tax I appears to be required for binding of cellular factors to the TRE-1s. This was particularly noteworthy, since in vitro experiments have indicated that fac-tors (bZIP proteins of the CREB/ATF superfamily) can bind FIG. 4. PhosphorImager quantitation of the MT-2 lower-strand promoter-central TRE-1. The gel in Fig. 3B was exposed to a storage phosphor screen. The image was scanned, and the graph was generated by using ImageQuant 5.0 software. The protected and hypersensitive residues shown in Fig. 3B are indicated.
on November 9, 2019 by guest
http://jvi.asm.org/
to TRE-1 DNA (the central CRE in particular) in the presence or absence of Tax I (17, 30, 41, 44, 50). The in vivo Tax I-dependent binding might reflect a higher affinity for the bind-ing of these factors to the central CRE in the presence of Tax I. Indeed, increased affinity of CREB for TRE-1 DNA in the presence of Tax I has been reported (5, 47, 48, 51).
As indicated above, each TRE-1 contains a central CRE, and Tax I protein can form an in vitro complex with CREB and TRE-1 DNA (5, 51). Methylation interference footprinting of the in vitro CREB–TRE-1 or Tax I–CREB–TRE-1 complexes has shown that CREB contacts all three GC base pairs within the central CRE motif (TGACG) (32). In MT-2 cells, the in vivo footprinting showed strong protection of all G’s in the TRE-1 CREs, consistent with binding of CREB in vivo. How-ever, it is possible that other members of the CREB/ATF family of transcription factors (either as homodimers or het-erodimers) could also bind and protect the G’s in the central CREs. It has also been shown that Tax I extends the in vitro
footprint in a CREB–TRE-1 complex by contacting the minor groove of the GC-rich flanking sequences (22). The in vivo footprinting of the TRE-1s in MT-2 cells showed additional protected G residues in the sequences flanking the central CREs, particularly for the promoter-proximal TRE-1. Thus, the in vivo footprints of the TRE-1s in MT-2 cells were gen-erally consistent with patterns predicted from the in vitro foot-printing experiments.
[image:6.612.80.285.78.498.2]It was noteworthy that while the central CREs were strongly protected in the in vivo footprints of all three TRE-1s in MT-2 cells, the extents of protection in the GC-rich flanking se-quences differed. The most extensive footprints in the flanking sequences were observed for the promoter-proximal TRE-1 (all G residues protected or hypersensitive), the central TRE-1 showed intermediate protein interactions (some G residues not protected), and the distal TRE-1 showed minimal protec-tions in the flanking sequences (although only the lower strand could be analyzed) (Fig. 6). One possible explanation for this could be that the different TRE-1s bind CREB or Tax I in vivo but with different affinities, resulting in differential spreading of the footprints to the flanking sequences. The different af-finities could result from differences in nucleotide sequences or from relative proximity to the basal promoter elements. Alter-natively, different protein complexes might bind the different TRE-1s due to sequence differences. It has been observed that the different TRE-1s can form qualitatively different protein-DNA complexes in gel shift assays (43, 46).
[image:6.612.311.538.382.690.2]FIG. 5. In vivo DMS footprinting of the upper strand of the promoter-central (A) and promoter-proximal (B) TRE-1s. In vivo DMS LMPCR was performed on MT-2 and MT-4 cells as described for Fig. 3.
FIG. 6. Summary of TRE-1 footprints in the MT-2 cell line. The footprint data presented in Fig. 3 and 5 are summarized on the individual TRE-1 se-quences. The CRE is in bold. “H” indicates hypersensitivity, and “P” indicates protection; bolded P’s and H’s reflect strong interactions. The upper strand of the promoter-distal TRE-1 is italicized to indicate that it was not analyzed.
on November 9, 2019 by guest
http://jvi.asm.org/
We also analyzed in vivo footprints over the TRE-2 se-quences. In contrast to the TRE-1s, where footprints were observed only in MT-2 cells, footprints were observed in both MT-2 and MT-4 cells, although the patterns were quite differ-ent. In MT-4 cells, the main footprint was characterized by one strong and one weak hypersensitive site in the NFB/Sp1 re-gion (as well as weak protection over the AP-2 site), while most other G residues in the TRE-2 were not protected. In contrast, in MT-2 cells, there were extensive footprints over the TRE-2 sequences; indeed, all G residues in the identified motifs in this region were protected (or hypersensitive), and only three G residues in the entire region were not protected. Thus, while there may be limited factor binding to the TRE-2 region in the absence of Tax I, the transactivator protein leads to extensive factor binding to this region. Even for the NFB/Sp1 region, where there was evidence for factor binding in both MT-2 and MT-4 cells, it was clear that different proteins were bound. In MT-4 cells, the footprint consisted of hypersensitive sites in two of five G residues; in MT-2 cells, four of the five G residues were protected, including the G residue that was strongly hy-persensitive in MT-4 cells. The factors bound to the TRE-2 sequences in MT-2 cells remain to be elucidated. It will be important to couple these in vivo studies with additional in vitro experiments (e.g., antibody supershift experiments).
In vivo footprinting indicated that the strongest protein-DNA interactions were for the promoter-proximal TRE-1 and TRE-2, while weaker or more limited interactions were ob-served for the distal and central TRE-1s. This might suggest that the promoter-proximal TRE-1 and TRE-2 are the critical elements for transcriptional activity of the HTLV-1 LTR in MT-2 cells. Indeed, it has been shown that together these two
elements are sufficient for Tax I responsiveness of the HTLV-1 LTR (24, 28).
[image:7.612.58.290.71.336.2]These studies were carried out on cell lines that contain multiple copies of HTLV-1 provirus (some defective) inte-grated into the genome (6, 20). The in vivo footprinting de-scribed here is an averaged analysis of all of the HTLV-1 proviruses in a given cell line, regardless of whether they were transcriptionally active or inactive. If inactive proviruses in MT-2 cells contained fewer or no bound factors, this would have reduced the apparent strength of protections or hyper-sensitivities in the active proviruses in the footprints. Con-versely, particularly strong protections or hypersensitive sites might have originated from both active and inactive proviruses. It should be noted that due to locations of the LMPCR primers, analysis of the lower strand involved amplification from both the upstream and downstream LTRs. In contrast, the primers used for analysis of the upper strand would spe-cifically amplify fragments for the upstream LTR. (It was not possible to design primers that would exclusively analyze the lower strand in the upstream LTR, since this would require knowledge of the flanking host cell sequences for each provi-rus.) Transcription for the virus initiates in the upstream LTR and terminates in the downstream LTR, and it has been shown that the downstream LTR is less transcriptionally active (14). It seems quite possible that transcription factors might be loaded on the upstream LTR but not on the downstream LTR. It was interesting that protections on the upper strand were generally stronger than those on the lower strand (e.g., compare Fig. 3 and 5). This would be consistent with differential loading of factors on the upstream and downstream LTRs.
FIG. 7. In vivo DMS footprinting of TRE-2 in the MT-2 and MT-4 cell lines. In vivo DMS LMPCR was performed on MT-2 and MT-4 cells. (A) Lower strand of TRE-2 in MT-2 and MT-4 cells. The predicted binding sites for different transcription factors for this strand are also indicated. Some transcription factor binding sites overlap other binding sites on the opposite strand (Fig. 8). (B) Upper strand of TRE-2 in MT-2 and MT-4 cells.
FIG. 8. Summary of TRE-2 footprints in the MT-2 and MT-4 cell lines. The footprint data presented in Fig. 6 are summarized on the TRE-2 sequence. Predicted transcription factor binding sites are shown in bold. Conventions are the same as for Fig. 6.
on November 9, 2019 by guest
http://jvi.asm.org/
[image:7.612.317.544.419.690.2]In summary, this report represents the first detailed in vivo footprint analysis of the HTLV-1 LTR. The results indicated Tax I-dependent loading of factors onto both the TRE-1s and TRE-2. Within the TRE-1s, there was evidence for factor binding at the central CREs, as well as binding to flanking GC-rich sequences. Moreover, the strongest footprints were observed for the promoter-proximal TRE-1 and TRE-2. These results confirm and extend prior in vitro footprinting experi-ments on the HTLV-1 LTR.
ACKNOWLEDGMENTS
This work was supported by NIH grant RO1-CA32455. The support of the UCI Cancer Research Institute and the Chao Family Compre-hensive Cancer Center is acknowledged.
We thank K.-T. Jeang and Jennifer Nyborg for advice, reagents, and suggestions.
REFERENCES
1.Altman, R., D. Harrich, J. A. Garcia, and R. B. Gaynor.1988. Human T-cell leukemia virus types I and II exhibit different DNase I protection patterns.
J. Virol.62:1339–1346.
2.Ballard, D. W., E. Bohnlein, J. W. Lowenthal, Y. Wano, B. R. Franza, and W. C. Greene.1988. HTLV-1 tax induces cellular proteins that activate the
kappa B element in the IL-2 receptor alpha gene. Science241:1652–1655.
3.Baranger, A. M., C. R. Palmer, M. K. Hamm, H. A. Giebler, A. Brauweiler, J. K. Nyborg, and A. Schepartz.1995. Mechanism of DNA-binding
enhance-ment by the human T-cell leukaemia virus transactivator Tax. Nature376:
606–608.
4.Brady, J., K. T. Jeang, J. Duvall, and G. Khoury.1987. Identification of p40x-responsive regulatory sequences within the human T-cell leukemia
virus type I long terminal repeat. J. Virol.61:2175–2181.
5.Brauweiler, A., P. Garl, A. A. Franklin, H. A. Giebler, and J. K. Nyborg.
1995. A molecular mechanism for human T-cell leukemia virus latency and
Tax transactivation. J. Biol. Chem.270:12814–12822.
6.Cavrois, M., S. Wain-Hobson, and E. Wattel.1995. Stochastic events in the amplification of HTLV-1 integration sites by linker-mediated PCR. Res.
Virol.146:179–184.
7.Felber, B. K., H. Paskalis, C. Kleinman-Ewing, F. Wong-Staal, and G. N. Pavlakis.1985. The pX protein of HTLV-1 is a transcriptional activator of its
long terminal repeats. Science229:675–679.
8.Fujisawa, J., M. Seiki, T. Kiyokawa, and M. Yoshida.1985. Functional activation of the long terminal repeat of human T-cell leukemia virus type 1
by a trans-acting factor. Proc. Natl. Acad. Sci. USA82:2277–2281.
9.Fujisawa, J., M. Seiki, M. Sato, and M. Yoshida.1986. A transcriptional enhancer sequence of HTLV-1 is responsible for trans-activation mediated
by p40 chi HTLV-1. EMBO J.5:713–718.
10. Fujisawa, J., M. Toita, and M. Yoshida.1989. A unique enhancer element
for thetransactivator (p40tax) of human T-cell leukemia virus type 1 that is
distinct from cyclic AMP- and 12-O
-tetradecanoylphorbol-13-acetate-re-sponsive elements. J. Virol.63:3234–3239.
11. Gessain, A., F. Barin, J. C. Vernant, O. Gout, L. Maurs, A. Calender, and G. de The.1985. Antibodies to human T-lymphotropic virus type-1 in patients
with tropical spastic paraparesis. Lancetii:407–410.
12. Giam, C. Z., and Y. L. Xu.1989. HTLV-1 tax gene product activates tran-scription via pre-existing cellular factors and cAMP responsive element.
J. Biol. Chem.264:15236–15241.
13. Greene, W. C., W. J. Leonard, Y. Wano, P. B. Svetlik, N. J. Peffer, J. G. Sodroski, C. A. Rosen, W. C. Goh, and W. A. Haseltine.1986. Trans-activator gene of HTLV-II induces IL-2 receptor and IL-2 cellular gene expression.
Science232:877–880.
14. Herman, S. A., and J. M. Coffin.1986. Differential transcription from the
long terminal repeats of integrated avian leukosis virus DNA. J. Virol.60:
497–505.
15. Hoyos, B., D. W. Ballard, E. Bohnlein, M. Siekevitz, and W. C. Greene.1989. Kappa B-specific DNA binding proteins: role in the regulation of human
interleukin-2 gene expression. Science244:457–460.
16. Inoue, J., M. Seiki, T. Taniguchi, S. Tsuru, and M. Yoshida.1986. Induction
of interleukin 2 receptor gene expression by p40xencoded by human T-cell
leukemia virus type 1. EMBO J.5:2883–2888.
17.Jeang, K. T., I. Boros, J. Brady, M. Radonovich, and G. Khoury.1988. Characterization of cellular factors that interact with the human T-cell
leu-kemia virus type 1 p40x-responsive 21-base-pair sequence. J. Virol.62:4499–
4509.
18. Jeang, K. T., D. Derse, M. Matocha, and O. Sharma.1997. Expression status of Tax protein in human T-cell leukemia virus type 1-transformed MT4 cells: recall of MT4 cells distributed by the NIH AIDS Research and Reference
Reagent Program. J. Virol.71:6277–6278.
19. Kimzey, A. L., and W. S. Dynan.1998. Specific regions of contact between
human T-cell leukemia virus type 1 Tax protein and DNA identified by
photocross-linking. J. Biol. Chem.273:13768–13775.
20. Kobayashi, N., H. Konishi, H. Sabe, K. Shigesada, T. Noma, T. Honjo, and M. Hatanaka.1984. Genomic structure of HTLV (human T-cell leukemia virus): detection of defective genome and its amplification in MT-2 cells.
EMBO J.3:1339–1343.
21. Koyanagi, Y., Y. Hinuma, J. Schneider, T. Chosa, G. Hunsmann, N. Koba-yashi, M. Hatanaka, and N. Yamamoto.1984. Expression of HTLV-specific
polypeptides in various human T-cell lines. Med. Microbiol. Immunol.173:
127–140.
22. Lenzmeier, B. A., H. A. Giebler, and J. K. Nyborg.1998. Human T-cell leukemia virus type 1 Tax requires direct access to DNA for recruitment of
CREB binding protein to the viral promoter. Mol. Cell. Biol.18:721–731.
23. Leung, K., and G. J. Nabel.1988. HTLV-1 transactivator induces
interleu-kin-2 receptor expression through an NF-kappa B-like factor. Nature333:
776–778.
24. Marriott, S. J., I. Boros, J. F. Duvall, and J. N. Brady.1989. Indirect binding
of human T-cell leukemia virus type 1tax1to a responsive element in the
viral long terminal repeat. Mol. Cell. Biol.9:4152–4160.
25. Miwa, M., K. Shimotohno, H. Hoshino, M. Fujino, and T. Sugimura.1984. Detection of pX proteins in human T-cell leukemia virus (HTLV)-infected cells by using antibody against peptide deduced from sequences of X-IV
DNA of HTLV-I and Xc DNA of HTLV-II proviruses. Gann75:752–755.
26. Miyoshi, I., I. Kubonishi, S. Yoshimoto, T. Akagi, Y. Ohtsuki, Y. Shiraishi, K. Nagata, and Y. Hinuma.1981. Type C virus particles in a cord T-cell line derived by co-cultivating normal human cord leukocytes and human
leukae-mic T cells. Nature294:770–771.
27. Mueller, P. R., and B. Wold.1989. In vivo footprinting of a muscle specific
enhancer by ligation mediated PCR. Science246:780–786. (Erratum248:802,
1990.)
28. Numata, N., K. Ohtani, M. Niki, M. Nakamura, and K. Sugamura.1991. Synergism between two distinct elements of the HTLV-1 enhancer during
activation by the trans-activator of HTLV-1. New Biol.3:896–906.
29. Nyborg, J. K., W. S. Dynan, I. S. Chen, and W. Wachsman.1988. Binding of host-cell factors to DNA sequences in the long terminal repeat of human T-cell leukemia virus type 1: implications for viral gene expression. Proc.
Natl. Acad. Sci. USA85:1457–1461.
30. Nyborg, J. K., M. A. Matthews, J. Yucel, L. Walls, W. T. Golde, W. S. Dynan, and W. Wachsman.1990. Interaction of host cell proteins with the human T-cell leukemia virus type 1 transcriptional control region. II. A comprehen-sive map of protein-binding sites facilitates construction of a simple chimeric
promoter responsive to the viral tax2 gene product. J. Biol. Chem.265:
8237–8242.
31. Osame, M., K. Usuku, S. Izumo, N. Ijichi, H. Amitani, A. Igata, M. Matsu-moto, and M. Tara.1986. HTLV-1 associated myelopathy, a new clinical
entity. Lanceti:1031–1032.
32. Paca-Uccaralertkun, S., L. J. Zhao, N. Adya, J. V. Cross, B. R. Cullen, I. M. Boros, and C. Z. Giam.1994. In vitro selection of DNA elements highly responsive to the human T-cell lymphotropic virus type 1 transcriptional
activator, Tax. Mol. Cell. Biol.14:456–462.
33. Paskalis, H., B. K. Felber, and G. N. Pavlakis.1986. Cis-acting sequences responsible for the transcriptional activation of human T-cell leukemia virus
type 1 constitute a conditional enhancer. Proc. Natl. Acad. Sci. USA83:
6558–6562.
34. Perini, G., S. Wagner, and M. R. Green.1995. Recognition of bZIP proteins
by the human T-cell leukaemia virus transactivator Tax. Nature376:602–605.
35. Poiesz, B. J., F. W. Ruscetti, A. F. Gazdar, P. A. Bunn, J. D. Minna, and R. C. Gallo.1980. Detection and isolation of type C retrovirus particles from fresh and cultured lymphocytes of a patient with cutaneous T-cell lymphoma.
Proc. Natl. Acad. Sci. USA77:7415–7419.
36. Rosen, C. A., R. Park, J. G. Sodroski, and W. A. Haseltine.1987. Multiple sequence elements are required for regulation of human T-cell leukemia
virus gene expression. Proc. Natl. Acad. Sci. USA84:4919–4923.
37. Rosen, C. A., J. G. Sodroski, and W. A. Haseltine.1985. The location of cis-acting regulatory sequences in the human T cell lymphotropic virus type
III (HTLV-III/LAV) long terminal repeat. Cell41:813–823.
38. Saggioro, D., M. Panozzo, and L. Chieco-Bianchi.1990. Human
T-lympho-tropic virus type 1 transcriptional regulation by methylation. Cancer Res.50:
4968–4973.
39. Shimotohno, K., M. Takano, T. Teruuchi, and M. Miwa.1986. Requirement of multiple copies of a 21-nucleotide sequence in the U3 regions of human T-cell leukemia virus type I and type II long terminal repeats for trans-acting
activation of transcription. Proc. Natl. Acad. Sci. USA83:8112–8116.
40. Sodroski, J. G., C. A. Rosen, and W. A. Haseltine.1984. Trans-acting tran-scriptional activation of the long terminal repeat of human T lymphotropic
viruses in infected cells. Science225:381–385.
41. Tan, T. H., M. Horikoshi, and R. G. Roeder.1989. Purification and charac-terization of multiple nuclear factors that bind to the TAX-inducible en-hancer within the human T-cell leukemia virus type 1 long terminal repeat.
Mol. Cell. Biol.9:1733–1745.
42. Tan, T. H., R. Jia, and R. G. Roeder.1989. Utilization of signal transduction
on November 9, 2019 by guest
http://jvi.asm.org/
pathway by the human T-cell leukemia virus type 1 transcriptional activator
Tax. J. Virol.63:3761–3768.
43. Tillmann, M., and B. Wigdahl.1994. Identification of HTLV-1 21 bp
repeat-specific DNA-protein complexes. Leukemia8(Suppl. 1):S83–S87.
44.Tsujimoto, A., H. Nyunoya, T. Morita, T. Sato, and K. Shimotohno.1991. Isolation of cDNAs for DNA-binding proteins which specifically bind to a
tax-responsive enhancer element in the long terminal repeat of human T-cell
leukemia virus type 1. J. Virol.65:1420–1426.
45.Wagner, S., and M. R. Green.1993. HTLV-1 Tax protein stimulation of
DNA binding of bZIP proteins by enhancing dimerization. Science262:
395–399.
46.Wessner, R., J. Yao, and B. Wigdahl.1997. Sp family members preferentially interact with the promoter proximal repeat within the HTLV-1 enhancer.
Leukemia11(Suppl. 3):10–13.
47.Yin, M. J., and R. B. Gaynor.1996. Complex formation between CREB and Tax enhances the binding affinity of CREB for the human T-cell leukemia
virus type 1 21-base-pair repeats. Mol. Cell. Biol.16:3156–3168.
48. Yin, M. J., and R. B. Gaynor.1996. HTLV-1 21 bp repeat sequences facil-itate stable association between Tax and CREB to increase CREB binding
affinity. J. Mol. Biol.264:20–31.
49. Yoshida, M., I. Miyoshi, and Y. Hinuma.1982. Isolation and characterization of retrovirus from cell lines of human adult T-cell leukemia and its
implica-tion in the disease. Proc. Natl. Acad. Sci. USA79:2031–2035.
50. Yoshimura, T., J. Fujisawa, and M. Yoshida.1990. Multiple cDNA clones encoding nuclear proteins that bind to the tax-dependent enhancer of HTLV-1: all contain a leucine zipper structure and basic amino acid domain.
EMBO J.9:2537–2542.
51. Zhao, L. J., and C. Z. Giam.1992. Human T-cell lymphotropic virus type 1 (HTLV-1) transcriptional activator, Tax, enhances CREB binding to HTLV-1 21-base-pair repeats by protein-protein interaction. Proc. Natl.
Acad. Sci. USA89:7070–7074.