METHOD DEVELOPMENT AND VALIDATION OF DEXIBUPROFEN
FOR RELATED SUBSTANCES IN TABLET DOSAGE FORM BY
REVERSE PHASE HIGH PERFORMANCE LIQUID
CHROMATOGRAPHY
Dissertation Submitted to
The Tamil Nadu Dr. M.G.R. Medical University Chennai - 600032
In partial fulfillment of the requirements for the award of the degree of
MASTER OF PHARMACY
(Pharmaceutical Analysis)
Submitted by
K.SUGANYA SRI
Register No: 26091872 Under the Guidance of
PROFESSOR.A.MEENA, M. Pharm.,Ph.D., Head of the department Pharmaceutical Analysis
K.K. COLLEGE OF PHARMACY
GERUGAMBAKKAM, CHENNAI - 600122.
CERTIFICATE
This is to certify that the dissertation entitled METHOD DEVELOPMENT AND
VALIDATION OF DEXIBUPROFEN FOR RELATED SUBSTANCES IN TABLET
DOSAGE FORM BY REVERSE PHASE HIGH PERFORMANCE LIQUID CHROMATOGRAPHY’’ is a bonafide and genuine research work carried out at Department of
Pharmaceutical Analysis, K. K. College of Pharmacy, Chennai – 600122, by MRS.K.SUGANYA
SRI during the academic year 2011-2012 under my direct guidance and supervision. This
dissertation submitted in partial fulfillment for the award of Degree of Master of Pharmacy
(Pharmaceutical Analysis) to The Tamil Nadu Dr. M.G.R Medical University, Chennai – 600032.
GUIDE
CERTIFICATE
This is to certify that the dissertation entitled “ METHOD DEVELOPMENT AND
VALIDATION OF DEXIBUPROFEN FOR RELATED SUBSTANCES IN TABLET
DOSAGE FORM BY REVERSE PHASE HIGH PERFORMANCE LIQUID CHROMATOGRAPHY’’ is a bonafide and genuine research work carried out by
MRS.K.SUGANYA SRI during the academic year 2011-2012 under the guidance of A.MEENA,
Principal, K.K. College of Pharmacy, Chennai – 600122. This dissertation submitted in partial
fulfillment for the award of Degree of Master of Pharmacy (Pharmaceutical Analysis) to The
Tamil Nadu Dr. M.G.R Medical University, Chennai – 600032.
HEAD OF DEPARTMENT
Dr. V. VAIDHYALINGAM.,M.Pharm.,PhD.,
ACKNOWLEDGEMENT
This book is written in dedication to the God almighty who has blessed me with the peace of
mind, courage and strength and also with affectionate dedication to my loving parents, brothers,
friends and my husband who throughout the years have given me lot of encouragement, valuable
ideas and timely support whenever needed.
First and foremost, I wish to express my deepest gratitude to respected Prof.
K.R.Arumugan, M.Pharm. Chairman of K.K.College of pharmacy, Chennai for his help and
support.
I also wish to express my deep gratitude to Mrs.A.Meena, M.Pharm, (Ph.D)
Prinicipal K.K.College of pharmacy for her heartily cooperation and valuable guidance
throughout these two years of my M.Pharm course. She has always given me lot of
encouragement, valuable ideas and timely support whenever needed.
I wish to express my deep gratitude to Prof. Dr. V. Vaidhyalingam, M.Pharm, Ph.D.,
Director and head of the department K.K.College of pharmacy for his heartily cooperation and
valuable guidance throughout these two years of my M.Pharm course.
I was fortunate enough to undertake present work under the supervision of my guide
Dept. Of Pharmaceutical analysis K.K.College of pharmacy, for her generous guidance, moral
support, constructive criticism, kind supervision and constant encouragement in bringing this
work to conclusion. I am extremely thankful to madam for her positive and enthusiastic attitude
I am deeply indebted to the teaching staff of the department who was always a source
of knowledge and inspiration to me, especially Mrs. Sugantha savitha, M.Pharm, Mrs. Sonia
M.Pharm, for their prompt assistance and cooperative attitude.
I wish my greatful thanks to Mr.Karthikeyan (AR&D) the manager of Shasun
Chemicals., Puducherry for allowed me to do my project work.
Acknowlwdge is due to my colleague’s, friends V.Sathiya, M.Venkatesan,
D.Ramesh, M.Lalitha, and all my seniors for their encouragement and valuable guidance
during the course of my dissertation work.
I am in debt to my parents and my husband D.Prabu who are the foundation stone of
the platform and standing on today. Also I want to thank all of those, whom I may not be able to
name individually, for helping me directly and indirectly.
It gives me an immense pleasure to acknowledge with gratitude, the help rendered by
host of people, to whom I owe in a substantial measure in the successful completion of this
project.
K.SUGANYA SRI
ABBREVIATIONS
Department of Pharmaceutical Analysis
ABBREVIATIONS
%
-
Percentage
ºC
-
Degree Celcius
CONC.
-
Concentration
g/mol
-
Gram per mole
H2O2
-
Hydrogen Peroxide
HCL
-
Hydrochloric acid
HPLC
-
High Performance Liquid Chromatography
ICH
-
International Conference on Harmonisation
LOD
-
Limit of Detection
LOQ
-
Limit of Quantification
mg
-
Milligram
ml
-
Milliliter
µg
-
Microgram
µl
-
Microliter
nm
-
Nanometer
NaOH
-
Sodium Hydroxide
pH
-
Negative Logarithm of Hydrogen Ion
r
2-
Correlation coefficient
RRF
-
Relative Response Factor
RSD
-
Relative Standard Deviation
SD
-
Standard Deviation
UV
-
Ultra Voilet Spectroscopy
CONTENTS
S.NO. TITLE PAGE NO.
1
INTRODUCTION1
2
LITERATURE REVIEW13
3
DRUG PROFILE16
4
AIM AND PLAN OF WORK20
5
EXPERIMENTAL WORK21
6
RESULTS AND DISCUSSION28
7
SUMMARY AND CONCLUSION68
8
CHROMATOGRAMS70
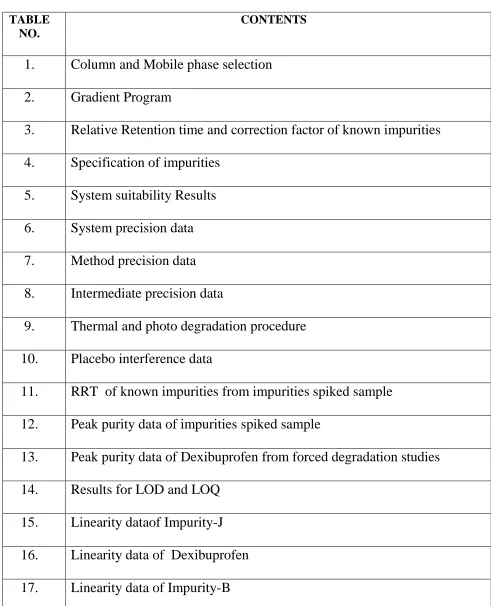
LIST OF TABLES
TABLE NO.
CONTENTS
1.
Column and Mobile phase selection
2.
Gradient Program
3.
Relative Retention time and correction factor of known impurities
4.
Specification of impurities
5.
System suitability Results
6.
System precision data
7.
Method precision data
8.
Intermediate precision data
9.
Thermal and photo degradation procedure
10.
Placebo interference data
11.
RRT of known impurities from impurities spiked sample
12.
Peak purity data of impurities spiked sample
13.
Peak purity data of Dexibuprofen from forced degradation studies
14.
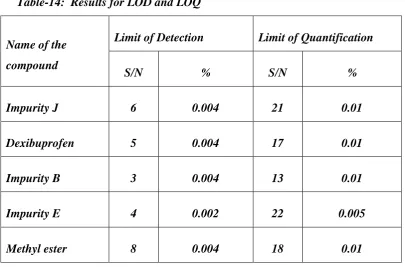
Results for LOD and LOQ
15.
Linearity dataof Impurity-J
16.
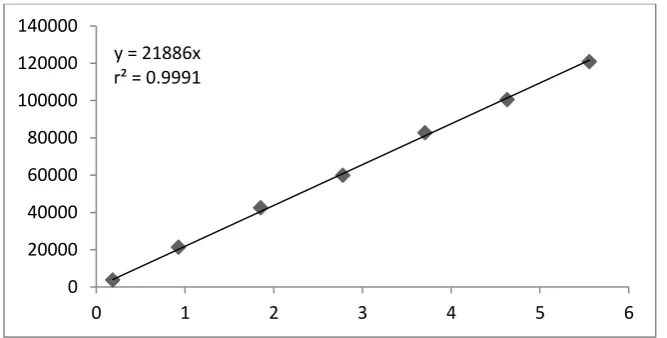
Linearity data of Dexibuprofen
[image:8.612.56.547.90.696.2]18.
Linearity data of Impurity-E
19.
Linearity dataof Methyl ester
20.
Slope, y-intercept, co-efficient of correlation data
21.
Summary of RRF values
22.
Accuracy data of Dexibuprofen and impurities
23.
Solution stability data of standard solution at ambient condition
24.
Solution stability data of impurities spiked sample solution
25.
Filter validation data
26.
Robustness study data for flow rate variation
27.
Robustness study data for solvent variation
28.
Robustness study data for wavelength variation
LIST OF FIGURES
S. No.
CONTENTS
1
Linearity graph of Impurity-J
2
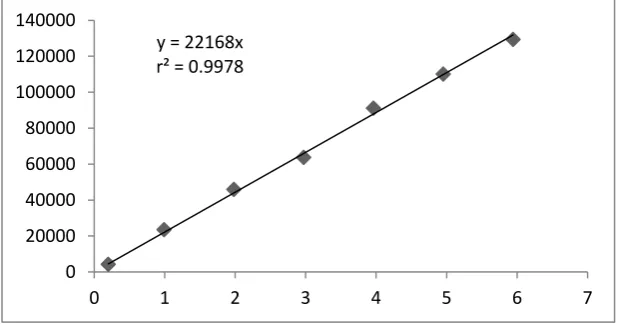
Linearity graph of Dexibuprofen
3
Linearity graph of Impurity-B
4
Linearity graph of Impurity-E
5
Linearity graph of Methyl ester
6
Method development – Blank
7
Method development - Placebo Solution
8
Method development - Standard solution
9
Method development - Sample solution
10
System suitability solution
11
Specificity - Impurity-J
12
Specificity - Impurity-B
13
Specificity - Impurity-E
14
Specificity - Methyl ester
15
Specificity – Impurity spiked sample
16
Specificity- Forced degradation study - Acid stressed sample
S. No.
CONTENTS
18
Specificity - Forced degradation study - Peroxide stressed
sample
19
Limit of Detection & Limit of Quantification - LOD Solution1
20
Limit of Detection & Limit of Quantification - LOD Solution 2
21
Limit of Detection & Limit of Quantification - LOD Solution 3
22
Limit of Detection & Limit of Quantification - LOD Solution 4
23
Limit of Detection & Limit of Quantification - LOD Solution 5
24
Limit of Detection & Limit of Quantification - LOD Solution 6
25
Limit of Detection & Limit of Quantification - LOQ Solution 1
26
Limit of Detection & Limit of Quantification - LOQ Solution 2
27
Limit of Detection & Limit of Quantification - LOQ Solution 3
28
Limit of Detection & Limit of Quantification - LOQ Solution 4
29
Limit of Detection & Limit of Quantification - LOQ Solution 5
30
Limit of Detection & Limit of Quantification - LOQ Solution 6
31
Linearity Solution - LOQ Level
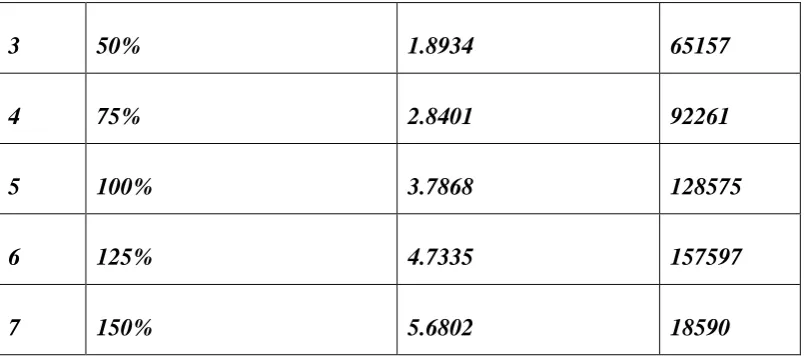
32
Linearity Solution - 25 % Level
33
Linearity Solution - 50 % Level
34
Linearity Solution - 75 % Level
S. No.
CONTENTS
36
Linearity Solution -125 % Level
37
Linearity Solution - 150 % Level
38
Accuracy - LOQ Level 1
39
Accuracy - LOQ Level 2
40
Accuracy - LOQ Level 3
41
Accuracy - 100 % Level 1
42
Accuracy - 100 % Level 2
43
Accuracy - 100 % Level 3
44
Accuracy - 150 % Level 1
45
Accuracy - 150 % Level 2
INTRODUCTION
Department of Pharmaceutical Analysis Page 1
1. INTRODUCTION
1.1. ANALYTICAL METHOD DEVELOPMENT
HPLC method development and validation is important for the analysis of drugs in any
formulation. The method which is used for quantitation or identification of drug should be a
validated one. It must be able to detect or quantitate the particular drug in the presence of
other components. Before starting any method development one should have knowledge
about the information of nature of the sample, separation goals, number of compounds
present, chemical structures, molecular weights, pKa values, solubility and UV spectrum of
the compounds. Perhaps maximum method development involves the trial and error
procedures.
The most difficult problem usually occurs in method development is where to start, what
type of column is worth trying with what kind of mobile phase. While there are a number of
HPLC methods available to the development chemist, perhaps the most commonly applied
INTRODUCTION
Department of Pharmaceutical Analysis Page 2
A typical pharmaceutical compound is considered to be an active pharmaceutical
ingredient (API) of less than 1000 Daltons, either soluble in water or in an organic solvent.
The water soluble drug is further differentiated as ionic or nonionic which can be separated
by reverse phase. Similarly, the organic soluble drugs can be classified as polar and non polar
and equally separated by reverse phase. In some cases the non polar API may have to be
separated using adsorption or normal phase HPLC, in which mobile phase would be non
polar organic solvent. The other chromatographic modes may need to be considered for
separation. These include ion exchange, chiral and size exclusion chromatography. Samples
like proteins, peptides nucleic acids and synthetic polymers analyzed by using some special
columns or ion pair reagents (i.e. 0.1% TFA).
1.1.1. General conditions to initiate HPLC method development
In general, one begins with reversed phase chromatography, when the compounds are
hydrophilic in nature with many polar groups and are water soluble. The organic phase
concentration required for the mobile phase can be estimated by gradient elution method. For
aqueous sample mixtures, the best way to start is with gradient reversed phase
chromatography. Gradient can be started with 5-10% organic phase in the mobile phase and
the organic phase concentration can be increased up to 100% within 20-30 min. Separation
can be optimized by changing the initial mobile phase composition and the slope of gradient
according to the chromatogram obtained from preliminary sample run. The initial mobile
phase composition can be estimated on the basis of where the compounds of interest were
eluted, namely at what mobile phase composition. Changing the polarity of a mobile phase
INTRODUCTION
[image:18.612.119.581.116.400.2]Department of Pharmaceutical Analysis Page 3
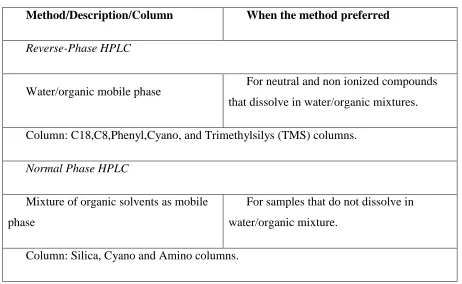
Table-1: Column & mobile phase selection shall be done as per the table given below
Method/Description/Column When the method preferred
Reverse-Phase HPLC
Water/organic mobile phase For neutral and non ionized compounds
that dissolve in water/organic mixtures.
Column: C18,C8,Phenyl,Cyano, and Trimethylsilys (TMS) columns.
Normal Phase HPLC
Mixture of organic solvents as mobile
phase
For samples that do not dissolve in
water/organic mixture.
Column: Silica, Cyano and Amino columns.
The elution strength of a mobile phase depends upon its polarity, the stronger the polarity,
higher is the elution. Ionic samples (acidic and basic) can be separated, if they are present in
associated form. Dissociation of ionic samples may be suppressed by proper selection of pH.
The optimized chromatogram is the one in which all the peaks are symmetrical and are well
separated in less run time.
The peak resolution can be increased by using a more efficient column (column with
higher theoretical plate number), which can be achieved by using a column of smaller
particle size, or a longer column in length. These factors will increase the analysis time. Flow
INTRODUCTION
Department of Pharmaceutical Analysis Page 4
The parameter that are affected by the changes in chromatographic conditions are,
Capacity factor (K’).
Selectivity (α).
Column efficiency (N).
Peak asymmetry factor or Tailing factor (As).
1.1.2. Selection of mobile phase
The selection of the mobile phase mainly based on the solubility and polarity of the
compound. Usually, in RP-HPLC method water and organic solvents are used as the mobile
phase. In NP-HPLC method non polar solvents like Hexane and THF were used. If the
sample contains ionic or ionizable compounds, then use of a buffered mobile phase to ensure
the reproducible results.
In many cases, a silanophilic interaction causes tailing, mainly for the basic compounds
due to ion-exchange interaction. This can usually be reduced or suppressed by the use of
mobile phases modifiers (0.1% v/v triethylamine for basic analyte or 1% v/v glacial acetic
acid for the acidic analyte), or a combination thereof. Whenever buffers or other mobile
phase are used, check the solubility in mobile phase. This is especially true for gradient
applications. Acetonitrile is the preferred organic modifier in reversed phase chromatography.
The elution strength increases in the order methanol, acetonitrile and tetrahydrofuran. The
retention changes by roughly 10% for every 1% change in the concentration of organic
modifier.
1.1.3. Mobile phase composition
In reverse phase chromatography, the separation is mainly controlled by the hydrophobic
interaction between drugs molecules and the alkyl chains on the column packing materials.
Most chromatographic separation can be achieved by choosing the optimum mobile phase
INTRODUCTION
Department of Pharmaceutical Analysis Page 5
by choosing the qualitative and quantitative composition of aqueous and organic
portions.Most widely used solvents in reverse phase chromatography are Methanol and
Acetonitrile. Tetrahydrofuran is also used but to a lesser extent.
A drug solution having all possible known impurities can be used for checking the
extent of separation with different mobile phase ratios. Alternatively, solution of stressed
drug substance can be used to check for separation of impurities.Silica based column with
different crosslinkings in the increasing order of polarity are as follows.
<---Non-polar---Moderately polar----Polar--->
C18<C8<C6<Phenyl<Amino<Cyano<Silica.
Experiments are to be conducted using different columns with different mobile phase to
achieve best separation in chromatography. A column which gives separation of all the
individual impurities and degradants from each other and from API peak and which is rugged
for variation in mobile phase shall be selected.
1.1.4. Selection of column
The HPLC column is the heart of the method, performing the critical separation. The
column must possess the selectivity, efficiency and reproducibility to provide good
separation. Commonly used reversed phases are crosslinking the Si-OH groups with alkyl
chains like, C8 (octylsilane), C18 (octadecylsilane) and nitrile groups (CN), phenyl groups
(-C6H6) and amino groups (-NH2). They are chemically different bounded phases and
demonstrate significant changes in the selectivity using the same mobile phase. During
method development selection of column can be streamlined by starting with shorter column
(150, 100 or even 50 mm long). By selecting a shorter column with an appropriate phase run
time can be minimized so that an elution order and an optimum mobile phase can be quickly
determined. The following are the parameters of a chromatographic column which are to be
INTRODUCTION
Department of Pharmaceutical Analysis Page 6
Length and diameter of the column.
Packing material.
Shape of the particles.
Size of the particles.
% of carbon loading.
Pore volume.
Surface area.
End capping.
1.1.5. Selection of Column temperature
Temperature variation over the course of a day has quite significant effect on HPLC
separations. This can even occur in air conditioned rooms. While temperature is a variable
that can affect the selectivity, its effect is relatively small. Always it is preferable to optimize
the chromatographic conditions with column temperature as ambient. However, if the peak
is symmetry could not be achieved by any combination of column and mobile phase, then the
column temperatures above ambient can be adopted. The increase in column temperature
generally will result in reduction in peak asymmetry and peak retentions. When found
necessary, the column temperatures between 30ºC and 80ºC shall be adopted. If a column
temperature of above 80ºC is found to be necessary, packing materials which can withstand
to that temperature shall be chosen.
1.1.6. Selection of flow rate
Flow rate, more for isocratic than gradient separation, can sometimes be useful and
readily utilized to increase the resolution, although its effect is very modest. The slower flow
rate will also decrease the column back pressure.
Flow rate shall be selected bases on the following data.
INTRODUCTION
Department of Pharmaceutical Analysis Page 7
Column back pressures
Separation of impurities.
Peak symmetries.
Preferably the flow rate shall be not more than 2.5 ml/min. check the ruggedness of the
method by varying the flow rate by ± 0.2 ml from the selected flow rate. Select the flow rate
which gives least retention times, good peak symmetries, least back pressures and better
separation of impurities from each other and from API peak.
The mobile phases are pumped at different flow rates so as to achieve the required
composition and then mixed in a chamber and then introduced into the column. While
optimizing the separation of impurities, it is to be decided whether Low-pressure gradient
[not more than 80% organic phase is to be pumped] or High-pressure gradient [more than
80% of the organic phase is to be pumped]. While optimizing the gradient program,
especially using low viscous solvents like acetonitrile and phosphate buffers, it is
recommended to mix about 10% aqueous portion preferably the same buffer used in mobile
phase to avoid pumping problems.
1.1.7. Selection of detector wavelength
Selection of detector wavelength is a critical step in finalization of the analytical method
for impurities and degradants. Inject the impurity and API standard solutions into the
chromatographic system with photodiode array detector and collect the spectra. Also conduct
forced degradation studies and collect the UV spectra of all the major degradation products.
Overlay the spectra of all the compounds and select a wavelength which is most common and
gives higher responses for all compounds.
1.1.8. Selection of Diluents for Test preparation
Diluent for test preparation is selected initially based on solubility of the drug substances
and known impurities.Finalization of diluent is based on its extraction efficiency peak
symmetries and resolution of Impurities and diluent blank injection interference. Inject the
INTRODUCTION
Department of Pharmaceutical Analysis Page 8
system and establish the non-interference of blank in estimation of impurities and the effect
of diluent on resolution of impurities and peak symmetries.
Conduct experiments to optimize the extraction of API in presence of recipients at
different test concentrations using the diluent chosen based on solubility and select the test
concentration at which the extraction is most efficient. Select a diluent in which all the
known impurities/degradants and drug substances are soluble, in which the extraction is
complete, due to which there is no blank interference, in which the peak symmetries and
resolution between impurities is found to be satisfactory.
1.1.9. Selection of Test concentration, Injection volume
The test concentration is generally chosen based upon the response of API peak and
impurities at the selected detector wavelength. The test concentration shall be finalized after
it is proved that API is completely extractable at the selected test concentration. Generally an
injection volume of 10 to 20µl is recommended for estimation of impurities.
If the extractions are found to be difficult, then the test concentrations can be kept low and
the injection volume can be increase up to 50 µl but it is to be ensured that at the selected
injection volume the column is not overloaded, resolution between individual impurities and
the peak symmetries are not compromised. After the test concentration and the diluent is
finalized, prepare a test solution and keep the filtered solution in closed condition in a
stoppered flask on the bench top and observe for any precipitation or turbidity after 24 hours.
The solution should not show any turbidity/precipitation.
1.2.ANALYTICAL METHOD VALIDATION4
1.2.1. Types of Analytical Procedures to be validated
The validation of analytical procedures is directed to the four most common types of
INTRODUCTION
Department of Pharmaceutical Analysis Page 9
Identification tests
Quantitative tests for impurities' content
Limit tests for the control of impurities
Quantitative tests of the active moiety in samples of drug substance or drug
product or other selected component(s) in the drug product.
The objective of the analytical procedure should be clearly understood since this will
govern the validation characteristics which need to be evaluated. Typical validation
characteristics which should be considered are listed below.
Accuracy
Precision
Repeatability
Intermediate Precision
Specificity
Detection Limit
Quantitation Limit
Linearity
Range
This list should be considered typical for the analytical procedures cited but occasional
exceptions should be dealt with on a case-by-case basis. It should be noted that robustness is
not listed but should be considered at an appropriate stage in the development of the
analytical procedure.
Furthermore revalidation may be necessary in the following circumstances
Changes in the synthesis of the drug substance.
Changes in the composition of the finished product.
Changes in the analytical procedure.
The degree of revalidation required depends on the nature of the changes. Certain other
INTRODUCTION
Department of Pharmaceutical Analysis Page 10
1.2.2. Specificity
Specificity is the ability to assess unequivocally the analyte in the presence of
components which may be expected to be present. Typically these might include impurities,
degradants, matrix, etc. Lack of specificity of an individual analytical procedure may be
compensated by other supporting analytical procedure(s).
This definition has the following implications:
Identification: to ensure the identity of an analyte.
Purity Tests: to ensure that all the analytical procedures performed allow an accurate
statement of the content of impurities of an analyte, i.e. related substances test, heavy metals,
residual solvents content, etc.
Assay (content or potency): to provide an exact result which allows an accurate statement on
the content or potency of the analyte in a sample.
1.2.3. Accuracy
The accuracy of an analytical procedure expresses the closeness of agreement between
the value which is accepted either as a conventional true value or an accepted reference value
and the value found. This is sometimes termed trueness.
1.2.4. Precision
The precision of an analytical procedure expresses the closeness of agreement (degree of
scatter) between a series of measurements obtained from multiple sampling of the same
homogeneous sample under the prescribed conditions. Precision may be considered at three
levels: repeatability, intermediate precision and reproducibility. Precision should be
INTRODUCTION
Department of Pharmaceutical Analysis Page 11
homogeneous sample it may be investigated using artificially prepared samples or a sample
solution.
The precision of an analytical procedure is usually expressed as the variance, standard
deviation or coefficient of variation of a series of measurements.
Repeatability: Repeatability expresses the precision under the same operating conditions over
a short interval of time. Repeatability is also termed intra-assay precision.
Intermediate precision: Intermediate precision expresses within-laboratories variations:
different days, different analysts, different equipment, etc.
Reproducibility: Reproducibility expresses the precision between laboratories (collaborative
studies, usually applied to standardization of methodology).
1.2.5. Detection limit
The detection limit of an individual analytical procedure is the lowest amount of analyte
in a sample which can be detected but not necessarily quantitated as an exact value.
1.2.6. Quantitation limit
The quantitation limit of an individual analytical procedure is the lowest amount of
analyte in a sample which can be quantitatively determined with suitable precision and
accuracy. The quantitation limit is a parameter of quantitative assays for low levels of
compounds in sample matrices, and is used particularly for the determination of impurities
and/or degradation products.
1.2.7. Linearity
The linearity of an analytical procedure is its ability (within a given range) to obtain test
INTRODUCTION
Department of Pharmaceutical Analysis Page 12
1.2.8. Range
The range of an analytical procedure is the interval between the upper and lower
concentration (amounts) of analyte in the sample (including these concentrations) for which
it has been demonstrated that the analytical procedure has a suitable level of precision,
accuracy and linearity.
1.2.9. Robustness
The robustness of an analytical procedure is a measure of its capacity to remain
unaffected by small, but deliberate variations in method parameters and provides an
REVIEW OF LITERATURE
Department of Pharmaceutical Analysis Page 13
2. REVIEW OF LITERATURE
2.1. Hassan Y.Aboul-Enein, et al5,(2011) validated enantioselective HPLC assay of dexibuprofen tablet formulations. Mobile phase was composed of 0.025 M potassium
phosphate dibasic (pH 4.5) – methanol- ethanol ( 85:10:5 v/v/v).The method was linear
over the range 15-35 µg/ml (r2= 0.9995) ; accuracy and precision were acceptable with %
RSD < 2.0%.
2.2. P.Balan, et al6,(2011) validated Rp-HPLC Method for estimation of dexibuprofen and paracetamol in combined tablet dosage form. The method was carried
out on a C-18 ,250× 4.5 mm consisting of acetonitrile: water in ratio of 50:50 (pH-7.8
adjusted with triethylamine ) as mobile phase at a flow rate of 1.0 ml/ min. Detection was
carried out at 230nm. The retention times of dexibuprofen and paracetamol were found
to be 1.7 and 2.4 .Linear in the range of 2-10 µg/ml for dexibuprofen and paracetamol.
2.3. SelvaduraiMuralidharan, et al7,(2011) developed the validation of HPLC and an UV Spectrophotometric Methods for determination of Dexibuprofen in pharmaceutical
Preparations. Mobile phase was composed of acetonitrile and 0.5% triethylamine (pH
adjusted with ortophosphoric acid (30:70,v/v)) with RP-18 column .UV was performed at
222 nm. No spectral or chromatographic interferences from the tablet excipients were
found in UV and HPLC.
2.4. Pritesh G. Dhartarkar, et al8,(2011) developed the validation of UV Spectrophotometric Methods for estimation of dexibuprofen in bulk and dosage form.
Measurement of absorption at maximum wavelength in phosphate buffer pH 6.8 was
found to be at 221 nm by using 5% methanol. Beers law was obeyed in concentration
range 0-60 µg/ml having line equation y = 0.046x +0.017 with r2 = 0.999.
2.5 XIE Bin,et al9,(2008) Determination of dexibuprofen and its related substances in Dispersible Tablets by HPLC. Methods ODS-C18 column was applied and mobile
phase was acetonitrile and potassium phosphate and detected at 263 nm. Results
calibration curve was linear over the range of 4×10⁻³ ~ 100×10-3g/lit (r = 1 ).The mean
recovery rate of contents was 99.69 % with RSD as 0.92% (n=9).
REVIEW OF LITERATURE
Department of Pharmaceutical Analysis Page 14
characterised by SEM,DSC and XRD studies.The liquid SEEDS was a system that
consisted of dexibuprofen , labrasol,capryol 90 and labrafil. The particle size analysis
revealed no difference in the z-average particle diameter of the reconstituted emulsion
between liquid and solid SEEDS.
2.7 S.Agatonovic –Kustrin, et al11,(2000) Determination of enantiomeric composition of ibuprofen in solid mixtures of the two by DRIFT Spectroscopy. Sample
mixtures were dispersed as a 5% (w/w) mix in KBr and spectra were measured. T he
original spectra were sampled between 650.16 & 3999 cm-1. A working range of 1-100 %
of the R(-) enantiomer present as an impurity in S(+) enantiomer was established with a
minimum quantifiable level of 1.67 % and a limit of detection of 0.5 %.The average
recovery values were 100.95 & 98.02 for R(-) & S(+) enantiomer.
2.8 Xie Bin, et al 12 ,(2008) Determination of dexibuprofen and its related substances in dexibuprofen sustained – release suppositories by HPLC. Hypersil ODS column with
mobile phase acetonitrile and potassium dihydrogen phosphate was used and detected at
264 nm. The linearity was 4~128 mg/lit. The average recovery was 99.9% with RSD 0.3
%.
2.9 WANG Wen-ging, et al 13 ,(2008) Content Determination of dexibuprofen in the gel Preparation by HPLC. Hypersil ODS2 column was used, Mobile phase was
acetonitrile and water and detected at 263 nm, flows at a rate of 1.0 ml/min. Linearity was
performed in the range of 25.1- 251.0 µg/ml(r = 0.999). The average recovery was
101.6% (n =9).
2.10 ByranGowramma, et al14, (2011) developed the validation of Direct chiral separation of Ibuprofen Enantiomers of sustained release dosage form.
Enantiomeric separation was achieved on Lux 5 cellulose 1 column as stationary phase
and Mobile phase consisting of perchloric acid and acetonitrile (50 :50) at a flow rate of
1.0 ml/min and detected at 254 nm. RT for (R) and (S) enantiomers were 6.3 and 10.4
min. Linearity was performed in the range of 0.5-3.0µg/ml.
2.11 Rao, et al15, (2011)developed the validation of an UPLC Method for rapid determination of Ibuprofen and Diphenhydramine citrate in the presence of impurities in
combined dosage form. The method was developed using C18 Column with mobile
REVIEW OF LITERATURE
Department of Pharmaceutical Analysis Page 15
in the range of 0.20-6.00 & 0.084-1.14 µg/ml for Ibuprofen and Diphenhydramine
citrate. LOD were ranged from 0.200-0.320 and 0.084-0.099 µg/ml for Ibuprofen and
Diphenhydramine citrate impurities. LOQ were ranged from 0.440-0.880 and 0.258-0.372
µg/ml for Ibuprofen and Diphenhydramine citrate impurities.
2.12 Sohan S. Chitlange, et al16,(2009) Reported stability indicating HPTLC method for analysis of dexibuprofen in bulk and dosage form. The separation was carried out
using n-Hexane : ethylacetate: glacial acetic acid (7.5:2.5:0.2v/v/v).254 plate was used as
stationary phase.
2.13 Tao, et al17, (2009) determined dexibuprofen-β- cyclodextrin inclusion complex by HPLC. The sample was dissolved with 75% methyl alcohol and prepared by
ultrasonication. The mobile phase was methyl alcohol – 0.2%, phosphoric acid solution
(75:25) and detected at 220nm. The linearity range of dexibuprofen was 10.01~50.05 g/lit
(r = 0.9999) . The average recovery was 98.91 % (RSD =1.38 %).
2.14. MandalUttam,et al18, (2008) developed Boiequivalence study of two formulations containing 400 mg Dexibuprofen in Healthy Indian Subjects. The
concentration of dexibuprofen in plasma was determined by a validated HPLC method
with UV detection using carbamazepine as internal standard. The formulations were
compared using the parameters AUC, Cmax, t max,. Both preparation were well tolerated
DRUG PROFILE
Department of Pharmaceutical Analysis Page 16
3.DRUGPROFILE
3.1. DEXIBUPROFEN:
(2S)-2-[4-(2-methylpropyl)phenyl]propanoic acid
Dexibuprofen is a non-steroidal anti-inflammatory drug. It is the dextrorotatory
enantiomer of ibuprofen.Most ibuprofen formulations contain a racemic mixture of
dexibuprofen [ (+)-ibuprofen] and (-) – ibuprofen.
Structure:
Molecular weight: 206.281 g/mol
Molecular formula:C13H18O2
Description: Dexibuprofen is a white, crystalline powder.
Dosage form: Tablets.
Dosage : 200 to 500 mg
Solubility: Soluble in isopropyl alcohol, ethanol absolute, ethyl acetate, n-hexane.
Indications :
Pain and inflammation associated with musculoskeletal, joint and soft tissue
disorders.
Primary dysmenorrhea.
Special Precautions:
History of bronchial asthma
DRUG PROFILE
Department of Pharmaceutical Analysis Page 17
bleeding disorders
CV disease
elderly
lactation
Adverse Effects :
GI bleeding
Heartburn
epigastric pain
dyspepsia
peptic ulcer
nausea
vomiting
diaorrhea
jaundice
hepatitis
visual disturbances
depression
Pharmacokinetics:
Dexibuprofen is absorbed from the gastrointestinal tract and peak plasma
concentrations occur about 1 to 2 hours after ingestion. Dexibuprofen is also absorbed
on rectal use. There is some absorption after topical application to the skin.
Dexibuprofen is 90 to 99% bound to plasma proteins and has a plasma half-life of
about 2 hours. It is rapidly excreted in the urine mainly as metabolites and their
conjugates. About 1% is excreted in urine as unchanged dexibuprofen and about 14%
as conjugated dexibuprofen. There appears to be little if any distribution into breast
milk.
Mechanism of Action: Dexibuprofen is a NSAID. It acts by inhibition of cyclo- oxygenase, which is involved in prostaglandin synthesis.
DRUG PROFILE
Department of Pharmaceutical Analysis Page 18
Plasma protein : 90-99 %
Half Life : 1.8 - 2 hours
3.2.IMPURITIES OF DEXIBUPROFEN:
2-(4-butylphenyl)propionic acid (Impurity -B)
2-(4-isobutyrylphenyl)propionic acid(Impurity-J)
DRUG PROFILE
Department of Pharmaceutical Analysis Page 19
AIM AND PLAN OF WORK
Department of Pharmaceutical Analysis Page 20
4.AIMANDPLANOFWORK
4.1. NEED FOR METHOD DEVELOPMENT
The exhaustive literature survey revealed that none of the most recognized
pharmacopoeias or any journals includes the determination of related substances of
Dexibuprofen. So it is felt essential to develop a liquid chromatographic procedure which
will serve a reliable, accurate, sensitive, and stability indicating method for the
simultaneous determination of related substances of Dexibuprofen from tablets.
4.2. AIM OF THE STUDY
To develop and validate stability indicating related substances analytical method for
the Dexibuprofen tablets using HPLC.
4.3. PLAN OF THE PRESENT STUDY
Development and optimization of the proposed chromatographic conditions
Selection of wavelength.
Selection of initial separation condition.
Nature of stationary phase (column).
Nature of mobile phase (peak modifier, solvent strength, ratio and flow rate).
Validation of the developed method using various parameters
Specificity.
Limit of detection and limit of quantitation.
Determination of relative retention factor.
Linearity and range.
Accuracy.
Precision.
Filter compatibility.
Solution stability
EXPERIMENTAL WORK
Department of Pharmaceutical Analysis Page 21
5. EXPERIMENTAL WORK
Instruments used :
HPLC with UV/PDA detector [waters]
Analytical balance [Sartorious]
PH meter [Lab India]
Sonicator [BandelinSonorex Super]
Chemicals used :
HPLC grade [Millpore] water
Orthophosphoric acid HPLC grade [Merck]
Methanol HPLC grade [Fisher Scientific]
Sodium Hydroxide [Merck]
Hydrogen peroxide [Fisher Scientific]
Hydrochloric acid [Merck]
Acetonitrile [Merck]
Drug Sample :
Dexibuprofen drug sample obtained from Shasun Chemicals, Puducherry.
Initialization of the instrument:
Initially, the column was placed on the instrument and switch on the instruments and
washed with methanol, isopropyl alcohol and then finally with water for 30 min. Then
EXPERIMENTAL WORK
Department of Pharmaceutical Analysis Page 22
5.1.TRAILS :
5.1.1.TRAIL- I
Preparation of mobile phase A
Prepared a mixture of 500 ml of acetonitrile ,500 ml of Milli Q Water and 0.5 ml of
ortho phosphoric acid . Mixed well and degassed.
Preparation of mobile phase B
Mixed 0.5 ml of ortho phosphoric acid in 1000 ml of acetonitrile and degassed.
5.1.2.TRAIL-II
Preparation of mobile phase A
Prepared a mixture of 400 ml of acetonitrile ,600 ml of Milli Q Water and 1.0 ml of
ortho phosphoric acid . Mixed well and degassed.
Preparation of mobile phase B
Mixed 1.0 ml of ortho phosphoric acid in 1000 ml of acetonitrile and degassed.
5.1.3.TRAIL-III
Preparation of mobile phase A
Prepared a mixture of 350 ml of acetonitrile ,650 ml of Milli Q Water and 0.5ml of
ortho phosphoric acid . Mixed well and degassed.
Preparation of mobile phase B
Mixed 0.5 ml of ortho phosphoric acid in 1000 ml of acetonitrile and degassed.
EXPERIMENTAL WORK
Department of Pharmaceutical Analysis Page 23
5.1.4. TRAIL-IV
Preparation of mobile phase A
Prepared a mixture of 350 ml of acetonitrile ,650 ml of Milli Q Water and 0.5ml of
ortho phosphoric acid . Mixed well and degassed.
Preparation of mobile phase B
Mixed 0.5 ml of ortho phosphoric acid in 1000 ml of acetonitrile and degassed. Flow
rate was 2.0 ml/min.
5.2. FINALISED CHROMATOGRAPHIC CONDITIONS
Column : Waters symmetry, C18( 150mm×4.6mm,
5µm)
Wavelength : 214 nm
Flow rate : 2.0 mL/minute
Column temperature : Ambient
Injection volume : 20 µl
Pump Mode : Gradient
EXPERIMENTAL WORK
Department of Pharmaceutical Analysis Page 24
Table 2: Gradient Program
Time (Minutes) Mobile phase A (%) Mobile phase B (%)
0 100 0
25 100 0
55 15 85
70 15 85
75 100 0
5.3. PREPARATION OF SOLUTION
Mobile phase preparation
Preparation of mobile phase A
Prepared a mixture of 350 ml of acetonitrile, 650ml of Milli Q Water and 0.5ml of
ortho phosphoric acid. Mixed well and degassed.
Preparation of mobile phase B
Mixed 0.5 ml of ortho phosphoric acid in 1000 ml of acetonitrile and degassed.
Preparation of diluent
“ Mobile phase A” as a diluent.
Standard stock solution
Weighed accurately and transferred about 25.0 mg of Dexibuprofen reference
standard/ working standard into a 100 ml volumetric flask. Added about 50 ml of
EXPERIMENTAL WORK
Department of Pharmaceutical Analysis Page 25
Standard solution
Transferred 2.0 ml of standard stock solution into 100.0 ml volumetric flask and made
up the volume with diluent and mixed well. (≈ 5.0 µg/ml of Dexibuprofen))
Note : Standard solution stable for 48 hours at ambient condition (25 ºC ).
Impurity –B Stock Solution [ 2-(4- butyl phenyl) propionic acid]
Weighed accurately and transferred about 2.5 mg of Impurity –B[2-(4- butyl phenyl)
propionic acid] standard and transferred into a 25.0 ml volumetric flask, added about
10 ml of methanol and sonicated for about 2 minutes and made up to volume with
methanol and mixed well. (≈ 100.0 µg/ml of Impurity –B).
Resolution solution
Weighed accurately and transferred about 50.0 mg of Dexibuprofen reference
standard/ working standard into a 25.0 ml volumetric flask. Added about 10 ml of
methanol and sonicated for about 10 minutes to dissolved the material. To this added 1.0
ml of the impurity stock solution and made up to volume with methanol and mixed. (≈ 2000.0 µg/ml of Dexibuprofen and ≈ 4.0 µg/ml of impurity-B ).
Sample solution
Determined the average weight of 20 tablets, Crushed the tablets to fine powder using
mortar and pestle. Accurately weighed and transferred the sample powder equivalent to
about 200 mg of Dexibuprofen into a 100 ml volumetric flask. Added about 10 ml of
methanol and sonicated for about 10 minutes and made up the volume with diluent.
Filtered the solution through 0.45µm nylon syringe filter and discarded first 5 ml of the filtrate. . (≈ 2000.0 µg/mL of Dexibuprofen )
Note: Filtered sample solution stable for 48 hours at ambient condition (25 ºC).
Procedure
Separately injected each 20 µL of blank (diluent), standard solution (6 replicates) and
sample solution into the chromatograph, recorded the chromatograms and measured the
EXPERIMENTAL WORK
Department of Pharmaceutical Analysis Page 26
Note: After every six sample injections, inject the blank, standard solution as
Bracketing standard.
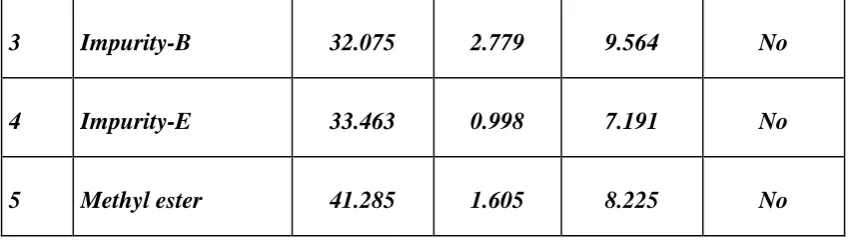
Table-3: The relative retention time and correction factor of known impurities
S.NO Name RRT RRF
1 2(4-isobutyryl phenyl) propionic acid
(Impurity : J) 0.20 0.92
2 2(4-butylphenyl) propionic acid
(Impurity :B) 1.04 0.91
3 4-Isobutylacetophenone
(4-IBAP) (Impurity-E)
1.09 1.37
4 Ibuprofen methyl ester 1.34 0.90
5 Dexibuprofen 1.00 -
5.4. EVALUATION OF SYSTEM SUITABILITY
Relative standard deviation for six replicate injections of standard area should be
not more than 10.0%.
Resolution between Dexibuprofen and Impurity –B[2-(4- butyl phenyl) propionic
acid ] peaks is not less than 1.5 in resolution solution .
EXPERIMENTAL WORK
Department of Pharmaceutical Analysis Page 27
5.5. CALCULATIONS
For Known Impurity
AT1 x SD x 2 X 100 X Avg.Wt x P
x 100 x
1
AD 100 100 TW LC 100 RRF
For Unknown Impurity
AT2
x SD x 2 x 100 X Avg.Wt x P x 100
AD 100 100 TW LC 100
Where,
AT1: Area of any known impurity peak in the chromatogram of sample solution
AT2: Area of unknown impurity peak in the chromatogram of sample solution.
AD: Average peak area of Dexibuprofen in the chromatogram of standard solution.
SD: Weight of Dexibuprofen reference standard/working standard in mg.
TW: Weight of Dexibuprofen tablets powder sample taken in mg.
Avg.Wt: Average weight per tablet in mg.
P: % Purity of Dexibuprofen reference standard/working standard (as is basis)
LC: Label claim of Dexibuprofen tablets in mg.
RRF: Relative Response factor
RESULTS AND DISCUSSION
Department of Pharmaceutical Analysis Page 28
6.1.ANALYTICALMETHODDEVELOPMENT
TRAIL-1
Dexibuprofen and impurities : System suitability results
1.) Theoretical plates obtained from trail-1 were 1872 and 2748.
2.) Resolution obtained from trail-1 was 0.7.
3.)% RSD obtained from trail -1 was 17.3 and 22.7.
TRAIL-2
Dexibuprofen and impurities: System suitability results
1.) Theoretical plates obtained from trail-2 were 3327 and 1482.
2.) Resolution obtained from trail-2 was 0.3.
3.)% RSD obtained from trail -2was 18.6 and 21.3.
TRAIL-3
Dexibuprofen and impurities: System suitability results
1.) Theoretical plates obtained from trail-3 were 3228 and 1985.
2.) Resolution obtained from trail-3 was 0.45.
3.) % RSD obtained from trail -3 was 14.9 and 21.2.
TRAIL-4
Dexibuprofen and impurities: System suitability results
1.) Theoretical plates obtained from trail-4 were 87652.
2.) Resolution obtained from trail-4 was 2.8.
3.) % RSD obtained from trail -4 was 0.5.
RESULTS AND DISCUSSION
Department of Pharmaceutical Analysis Page 29
On evaluation of the above results, it can be concluded that trail 1, 2, 3 shows poor resolution and affected the method significantly. Trail -4 shows good system suitability results and also
in the limit so the trail 4 were accepted and trail 1, 2, 3 were rejected.
6.2.ANALYTICALMETHODVALIDATION
Method validation is the process of demonstrating the analytical procedures are suitable
for their intended use and that they support the identity, strength, quality, purity and potency
of drug substances and drug products.
Purpose of Method Validation
Identification of sources and quantitation of potential errors.
Determination if method is acceptable for intended use
.
Establish proof that a method can be used for decision making.
Satisfy regulatory requirements.
RESULTS AND DISCUSSION
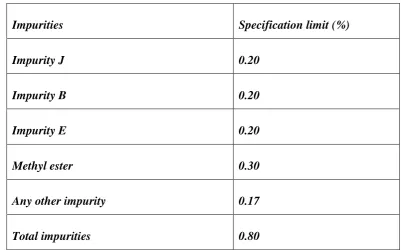
Department of Pharmaceutical Analysis Page 30
Impurities Specification limit (%)
Impurity J 0.20
Impurity B 0.20
Impurity E 0.20
Methyl ester 0.30
Any other impurity 0.17
Total impurities 0.80
Preparation of sample composite for validation
Weighed 20 tablets and calculated the average weight of a tablet. Transferred the tablets
into a mortar; crushed the tablets into fine powder. Use this powdered sample for validation.
6.1. SYSTEM SUITABILITY
The system suitability of the method has been demonstrated as indicated by the tailing
factor for Dexibuprofen, Resolution for Dexibuprofen and Impurity – B and the percentage
RSD that is not more than 10.0 from six replicate injections of standard solution. The
[image:45.595.94.496.122.372.2]obtained results were shown in Table-5.
Table-5: System suitabilityResults
RESULTS AND DISCUSSION
Department of Pharmaceutical Analysis Page 31
1 Dexibuprofen– 64460 The theoretical plate for peak due to Dexibuprofen should be not less than 5000.
2 Impurity – B - 2.7 Resolution between Dexibuprofen and
2(4-butylphenyl)propanoicacid peaks is not less than 1.5.
3
System precision
Dexibuprofen Peak area Injection
1 121407
2 120231
3 120096
4 120580
5 120293
6 119487
Average 120349
% RSD 0.5
6.2. PRECISION
RESULTS AND DISCUSSION
Department of Pharmaceutical Analysis Page 32
Procedure
Six replicate injections of standard solution were injected. The mean and percentage
relative standard deviation (%RSD) for peak areas of Dexibuprofen were calculated.
Acceptance criteria
Percentage relative standard deviation (%RSD) for peak areas of Dexibuprofen was not
more than 10.0.
Results and discussion
The method has been determined to be precise as demonstrated by % RSD that was not
more than 10.0 for the determinations of related substances of Dexibuprofen tablets. The
obtained results were shown in Table-6.
Table-6: System Precision data
Injection No. Peak area
RESULTS AND DISCUSSION
Department of Pharmaceutical Analysis Page 33
2 120231
3 120096
4 120580
5 120293
6 119487
Mean 120349
Percentage relative standard
deviation (%RSD)
0.5
6.2.2. Method precision
Prepare adequate quantity of mobile phase required for the continuation of mobile phase
stability, standard and sample solution stability along with method precision and filter
validation tests. These tests should be preferably continued in the same HPLC instrument. If
different HPLC instrument is used run the required system suitability as appropriate.
Impurities spiked sample solution
Weighed accurately and transferred about 420.0 mg of powdered sample (equivalent to
200 mg of Dexibuprofen) into a 100 ml volumetric flask. Added 50 ml of diluent, and
sonicated for 10 minutes, cooled to room temperature and added each 5.0 ml of impurity
RESULTS AND DISCUSSION
Department of Pharmaceutical Analysis Page 34
µm nylon filter. Discarded first 5 ml of the filtrate. (≈ 2000 µg/ml of Dexibuprofen, ≈ 4.0
µg/ml of impurity J,B&C ).
Note:(i)Prepared six replicate sample solutions using the same procedure.
(ii) Allocated spiked sample solution 1 for filter validation.
(iii) Allocated standard and spiked sample solution for solution stability study.
Procedure
Separately injected the blank (diluent), standard solution (6 replicates), each impurities
spiked sample solution, blank (diluent) and standard solution (bracketing) into the
chromatograph and recorded the peak response.
Calculation:
For known impurity :
AT1 x SD x 2 X 100 X Avg.Wt x P
x 100 x
1
AD 100 100 TW LC 100 RRF
For Unknown Impurity :
AT2
x SD x 2 x 100 X Avg.Wt x P x 100
AD 100 100 TW LC 100
RESULTS AND DISCUSSION
Department of Pharmaceutical Analysis Page 35
AT1: Area of any known impurity peak in the chromatogram of sample solution
AT2: Area of unknown impurity peak in the chromatogram of sample solution.
AD: Average peak area of Dexibuprofen in the chromatogram of standard
solution.
SD: Weight of Dexibuprofen reference standard/working standard in mg.
TW: Weight of Dexibuprofen tablets powder sample taken in mg.
Avg.Wt: Average weight per tablet in mg.
P: % Purity of Dexibuprofen reference standard/working standard (as is basis)
LC: Label claim of Dexibuprofen tablets in mg.
RRF: Relative Response factor
Total impurities: Sum of Known and Unknown impurities
Acceptance criteria
The percentage RSD of each individual known impurity and total impurities from six
impurities spiked samples should be not more than 10.0.
Results and Discussion
The method has been determined to be precise as demonstrated by % RSD that is not more
than 10.0 for individual known impurity and total impurities from six determinations of
impurities spiked samples at specification level. The obtained results were shown in Table-7.
Table-7: Method precision data
Sample
No.
Percentage (w/w)
Impurity-J Impurity-B Impurity -E Methyl ester Total
RESULTS AND DISCUSSION
Department of Pharmaceutical Analysis Page 36
6.2.3. Intermediate Precision (Ruggedness )
Demonstrate the intermediate precision by performing the impurities spiked sample
solution described under the method precision using different instrument, different column
and second analyst on different day.
Note: Prepared six replicate impurities spiked sample solutions as per method precision
parameter.
Procedure
Separately injected the blank (diluent), standard solution (6 replicates), each impurities
spiked sample solution, blank (diluent) and standard solution (bracketing) into the
chromatograph and recorded the peak response.
1 0.198 0.178 0.191 0.372 0.974
2 0.194 0.179 0.190 0.350 0.945
3 0.189 0.180 0.189 0.350 0.939
4 0.194 0.185 0.194 0.358 0.958
5 0.189 0.177 0.191 0.351 0.937
6 0.189 0.182 0.191 0.350 0.941
Avg. 0.192 0.180 0.191 0.355 0.949
RESULTS AND DISCUSSION
Department of Pharmaceutical Analysis Page 37
Calculation
For known, unknown and total impurities refer method precision parameter.
Acceptance criteria
The percentage RSD of each individual known impurity and total impurities from
six impurities spiked samples should be not more than 10.0.
The % RSD of both the analysts of impurities spiked samples for each individual
known impurity and total impurities should be not more than 10.0.
Results and Discussion
The method has been determined to be repeatable and precise as demonstrated by
an RSD that was not more than 10.0 of individual known impurity and total impurities
respectively from six impurities spiked samples at specification level of individual
and combined results of both the analysts. The obtained results were shown in
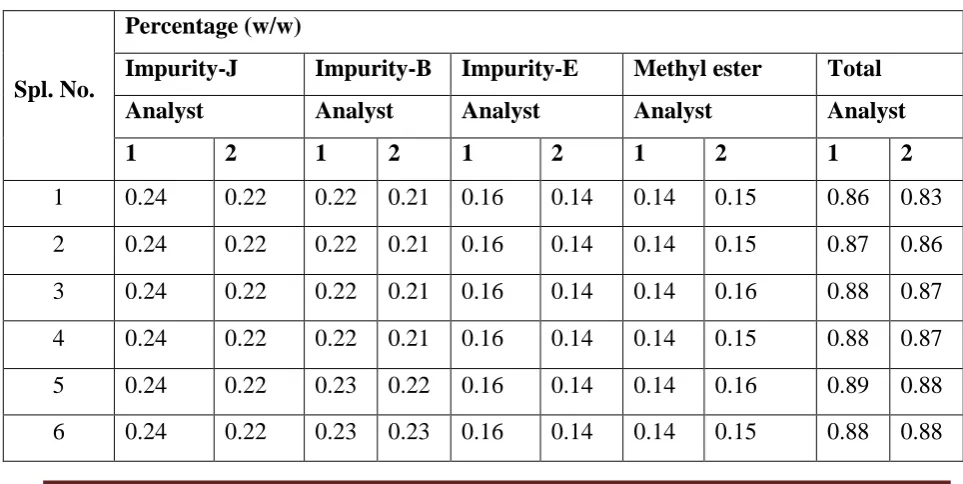
[image:52.595.49.531.534.776.2]Table-8.
Table-8:Intermediate precision data
Spl. No.
Percentage (w/w)
Impurity-J Impurity-B Impurity-E Methyl ester Total
Analyst Analyst Analyst Analyst Analyst
1 2 1 2 1 2 1 2 1 2
1 0.24 0.22 0.22 0.21 0.16 0.14 0.14 0.15 0.86 0.83
2 0.24 0.22 0.22 0.21 0.16 0.14 0.14 0.15 0.87 0.86
3 0.24 0.22 0.22 0.21 0.16 0.14 0.14 0.16 0.88 0.87
4 0.24 0.22 0.22 0.21 0.16 0.14 0.14 0.15 0.88 0.87
5 0.24 0.22 0.23 0.22 0.16 0.14 0.14 0.16 0.89 0.88
RESULTS AND DISCUSSION
Department of Pharmaceutical Analysis Page 38
Avg. 0.24 0.22 0.22 0.22 0.16 0.14 0.14 0.15 0.9 0.9
RSD 0.0 0.0 2.3 3.9 0.0 0.0 0.0 3.4 1.2 2.2
RSD (12
result) 4.5 3.6 7.0 5.3 1.7
*Analyst 1 data taken from method precision
6.3. SPECIFICITY
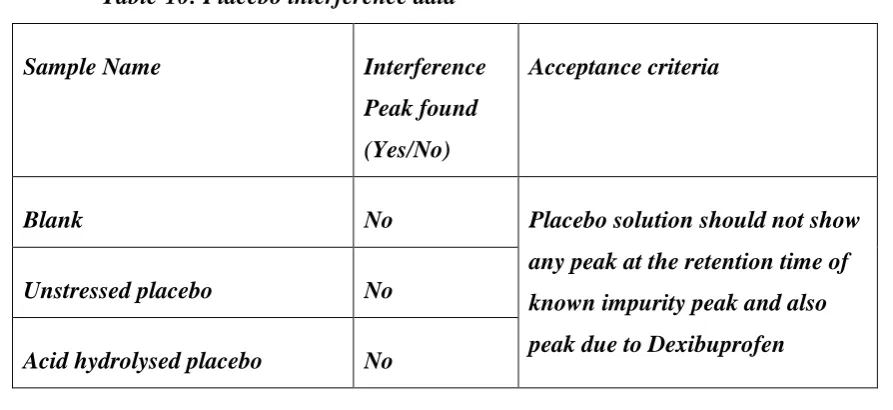
6.3.1. Interference from blank, placebo & impurities Placebo solution
Weighed accurately and transferred equivalent to 200 mg of Dexibuprofen (subtracted the
200 mg from the obtained equivalent weight) into a 100 ml volumetric flask. Added about 50
ml of diluent, sonicated for 10 minutes, cooled to room temperature and diluted to the volume
with diluent. Mixed well and filtered through 0.45 µm nylon membrane filter, discarded first
5 ml of the filtrate.
Resolution standard:
Weighed accurately and transferred about 50.0 mg of Dexibuprofen working reference
standard into 25 ml volumetric flask, added about 10ml of methanol and sonicated for 10
minutes, cooled to room temperature and added 1 ml of impurity B Stock solution and
diluted to the volume with diluent. Mixed well and filtered through 0.45 µm nylon membrane
filter, discarded first 5 ml of the filtrate.
Impurities spiked sample solution (at specification level)
Weighed accurately and transferred about 420.0 mg of powdered sample (equivalent to
200 mg of Dexibuprofen) into a 100 ml volumetric flask. Added 50 ml of diluent, and
solicited for 10 minutes, cooled to room temperature and added each 5.0 ml of impurity stock
solutions and diluted to the volume with diluent. Mixed well and filtered through 0.45 µm
nylon filter. Discarded first 5 mL of the filtrate. (≈ 2000 µg/ml of Dexibuprofen, ≈ 4.0 µg/ml
RESULTS AND DISCUSSION
Department of Pharmaceutical Analysis Page 39
6.3.2. Interference from forced degradation study
S.No. Forced degradation
study Volume and strength of reagent
1 Acid hydrolysis 10 mlof 5 N Hydrochloric acid
2 Alkali hydrolysis 10 ml of 5 N Sodium hydroxide
3 Peroxide oxidation 10 mlof 30 % Hydrogen peroxide
Placebo Procedure for acid, alkali, Peroxide oxidation
Weighed accurately and transferred about 220.0 mg of placebo into 3 separate 100 ml
volumetric flask, added 50 ml of diluent and sonicated to dissolve the content. To the first
100 ml flask, added 10 ml of 5N HCL. Added 10 ml of 5N NaOH into second and added 10
ml of 30% Hydrogen peroxide into third 100ml flask, kept on water bath / reflux for 12
hours. Cooled and diluted to the volume with diluent and mixed well. Filtered through 0.45
µm nylon filter, discarded first 5 ml of the filtrate and collected the filtrate.
Sample Procedure for acid, alkali, peroxide oxidation
Weighed accurately and transferred about 420.0 mg of Dexibuprofen into 3 separate 100
ml volumetric flask, added 50 ml of diluent and sonicated to dissolve the content. To the first
100 ml flask, added 10 ml of 5N HCL. Added 10 ml of 5N NaOH into second and added 10
ml of 30% Hydrogen peroxide into third 100ml flask, kept on water bath / refluxed for 12
hours. Cooled and diluted to the volume with diluent and mixed well. Filtered through 0.45
RESULTS AND DISCUSSION
Department of Pharmaceutical Analysis Page 40
Note: After heating/ refluxion, neutralized the solution with sodium hydroxide and
hydrochloric acid solution in acid and alkali hydrolysis respectively .(Check and adjust the
pH, if required, in the range of about 5 to 7).
Procedure for thermal and photo degradation
Spread evenly about 1 g of placebo, Dexibuprofen powdered sample in separate glass
petridish for each degradation condition and exposed as per the following condition.
Table: 9 Thermal and photo degradation
S.No. Sample degradation Stressing condition Hours to be exposed
1
Thermal
( oven)
105° C 24
2 Photo
Controlled (covered with
aluminum foil)
1.2 million lux Uncontrolled (direct
exposure)
RESULTS AND DISCUSSION
Department of Pharmaceutical Analysis Page 41
Sample was kept in an oven at 105° C for about 24 hours for thermal condition and
Sample was exposed to light of 1.2 million lux hours for photo light condition. Weighed
accurately and transferred about 420.0 mg of Dexibuprofen into a separate 100 ml volumetric
flask, added 50 ml of diluent and sonicated for 10 minutes to dissolve the content. Cool and
dilute to the volume with diluent and mix well. Filtered through 0.45 µm nylon filter,
discarded first 5 ml of the filtrate and collected the filtrate.
Placebo Preparation
Weighed accurately and transferred about 220.0 mg of Placebo into a separate 100 ml
volumetric flask and followed the same procedure as mention above for sample.
6.3.3. Evaluation of the sample chromatograms
The degradation of analyte peaks shall be in the range of 5 to 30 % by area normalization
method. If the degradation level is higher than 30 %, stress condition can be altered (less
concentration or less volume of stressing agent or reduced heating/refluxing period) in acid,
alkali, water hydrolysis and peroxide oxidation. For other degradation, report the obtained
degradation level as highest stress condition.
Ascertain the peak purity, with the help of software; for each individual peak(preferably
peak height of the analyte should be less than 1.0 AU at the highest absorbance) in the
chromatogram. If required, adjust the test solution concent