EPIDEMIOLOGICAL PROFILE OF MINERAL BONE
DISEASE IN CHRONIC KIDNEY DISEASE STAGE 4-5
A dissertation submitted to the Tamil Nadu Dr. M.G.R.
Medical University in partial fulfillment of the University regulations for the award of D . M . ( B r a n c h – I I I ) ( N e p h r o l o g y )
BONAFIDE CERTIFICATE
This is to certify that the work presented in this dissertation titled “EPIDEMIOLOGICAL
PROFILE OF MINERAL BONE DISEASE IN CHRONIC KIDNEY DISEASE STAGE
4-5” done towards fulfillment of the requirements of the Tamil Nadu Dr. M.G.R. Medical
University, Chennai for the D.M. (Branch–III) (Nephrology) exams to be conducted in
August 2011, is a bonafide work of the candidate Dr. Anna T. Valson., Senior Post graduate
student in the Department of Nephrology, Christian Medical College, Vellore under my guidance
and supervision. This dissertation has not been submitted, fully or in part to any other board or
University.
Guide & Head of Dept.:
Dr. V Tamilarasi, Professor and Head,
ACKNOWLEDGEMENT
Thanks to:
God - who gave me strength to see this through and the right people to see me through!
Prof. V Tamilarasi, HOD, Nephrology – for her guidance and encouragement throughout this
thesis.
Prof. CK Jacob and Prof. GT John – for guiding me through my initial years in Nephrology, and
being patient through my many failures.
Dr. Madhivanan Sundaram – who not only came up with the idea for this thesis, but provided
constant intellectual and moral support, which is the main reason it got done in the first place!
Dr. Santosh Varughese and Dr. Vinoi George David – for being problem solvers, door-openers
and friends.
Sr. Mercy Nahomi Deborah – who, apart from God, makes all things possible. Thank you, thank
you, thank you!!!
All my consultants and colleagues in the Department – who sent me patients when I couldn’t
come to them.
Dr. John Roshan – who painstakingly did all the (over 500) echos and through it all also found
time to enrich my world in ways both medical and spiritual.
My patients - who live with this disease and yet find a way not to be crushed by it.
My parents and sister – who have been waiting for this day a long, long, time. Thank you for
unconditional love and unshakeable faith.
CONTENTS
FRONT MATTER PAGE NO.
Abbreviations i
List of Tables ii
List of Figures iii
Abstract iv
PART I Introduction 1
Review of Literature 3
PART II Aim 49
Patients and Methods 50
Results 57
Discussion 70
Summary 74
Conclusions 75
BIBLIOGRAPHY
APPENDICES
Proforma a List of patients d
ABBREVIATIONS
CKD – Chronic kidney disease
CKD-MBD – Mineral bone disease associated with chronic kidney disease
PTH – Parathyroid hormone
FGF-23- Fibroblast growth factor 23
1,25(OH)2D – 1, 25 dihydroxyvitamin D
25(OH)D – 25 hydroxyvitamin D
KDOQI – Kidney Dialysis Outcome Quality Initiative
KDIGO – Kidney Disease Impacting Global Outcome
GFR – Glomerular Filtration Rate
VDR – Vitamin D receptor
CaSR – Calcium sensing receptor
ALP – Alkaline phosphatase
CaP – Calcium- phosphorus product
HD – Haemodialysis
PD – Peritoneal dialysis
BMD – Bone mineral density
DEXA – Dual Energy X – ray absorptiometry
EBCT – Electron Beam CT
LIST OF TABLES
Page 21 Table 1: KDIGO guidelines on frequency of measuring biochemical parameters
Page 50 Table 2: Demographic profile
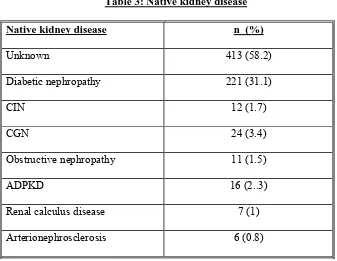
Page 51: Table 3: Native kidney disease
Page 52: Table 4: CKD MBD related symptoms
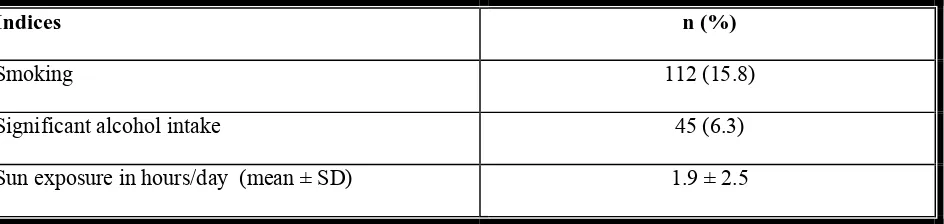
Page 52: Table 5: Lifestyle indices
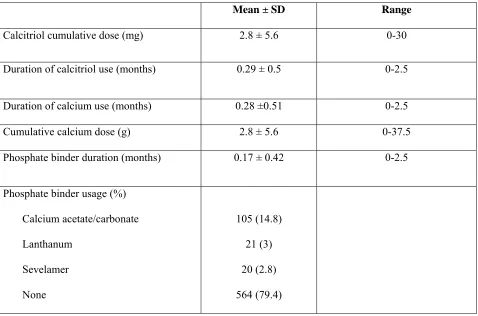
Page 54: Table 6: Calcium, phosphate binder and vitamin D usage
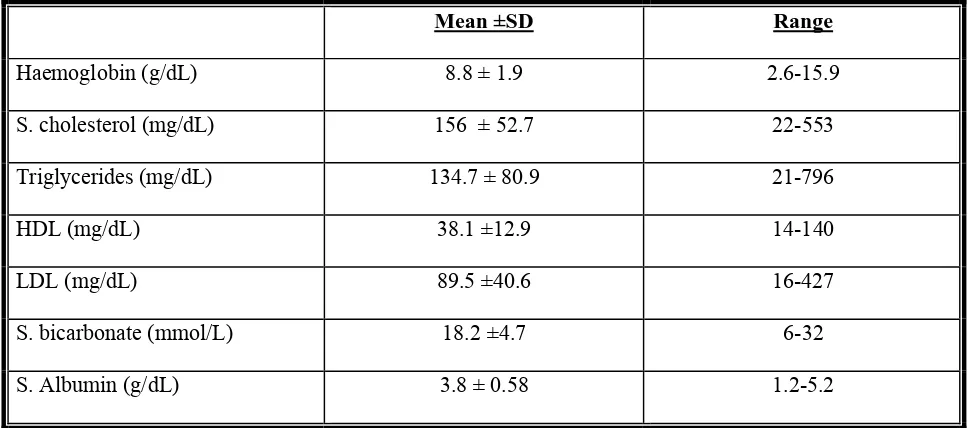
Page 55: Table 7: Biochemical parameters
Page 56: Table 8: Bone mineral metabolism parameters
Page 60: Table 9: Bone mineral density
Page 63: Table 10: Valvular calcification across CKD Stage 4 and 5 by two scoring systems
Page 66: Table 11: Vascular calcification score by CKD Stage
LIST OF FIGURES
Page 49: Figure 1: Case profile of the study
Page 55: Figure 2: BMI of the study population
Page 57: Figure 3: Calcium and phosphate levels (% of study population with abnormal values
Page 57: Figure 4: Ca x P and ALP levels (% of study population with high values)
Page 58: Figure 5: PTH (% of subjects with levels according to KDOQI recommendations)
Page 58: Figure 6: 25 (OH) Vitamin D (% of subjects with low and normal levels)
Page 61: Figure 7: T score trends by CKD Stage
Page 64: Figure 8: Prevalence of significant valvular calcification across CKD Stage 4 and 5
Page 64: Figure 9: Distribution of valvular calcification (Main Echocardiographic score)
Page 66: Figure 10: Prevalence of abdominal aortic calcification across CKD Stage 4 and 5
ABSTRACT
AIM: To study the epidemiological profile i.e the clinical, biochemical and radiological
parameters relating to bone mineral disease in CKD Stage 4-5
PATIENTS AND METHODS: A hospital based cross sectional survey was carried out in Stage 4-5
CKD patients, involving standard biochemical tests such as serum calcium, phosphate, PTH, 25
hydroxyvitamin D and alkaline phosphatase; imaging in the form of lateral abdominal X rays and
Echocardiography to look for vascular and valvular calcification and a DEXA scan to diagnose
co-existent osteoporosis.
RESULTS: Of the 710 patients enrolled, 45% had no CKD-MBD related symptom. 73.8% were
hypocalcemic (< 8.5 mg%), 58.4% had serum phosphate > 4.5 mg%, 76.5% had PTH > 150 pg/mL and
87.8% had Vitamin D deficiency (< 30 ng/ml). Risk factors for Vitamin D < 15 ng/mL were diabetes,
reduced sunlight exposure, BMI > 23, high socioeconomic status and female sex. Vitamin D deficiency
was significantly associated with dyslipidemia (elevated total cholesterol, LDL and triglycerides).
Vascular calcification was seen in 6.8% and associated with diabetes or hypertension for > 5 years, age >
50 yrs, postmenopausal status, smoking and low BMD. 78% had low BMD (T score < -1), the risk
factors for osteoporosis being age > 50 yrs, amenorrhea > 1 year, Vitamin D < 15 ng/ml, low sunlight
exposure and S. bicarbonate < 22 mmol/L. 51% had significant valvular calcification (Echocardiographic
calcification score ≥ 5), which was associated with PTH levels < 300 pg/mL and S. calcium > 9.5 mg%.
CONCLUSIONS: In predialysis Indian CKD patients, widespread hypocalcemia and vitamin D
deficiency aggravate hyperparathyroidism and are associated with low BMD and a high prevalence of
valvular calcification at a young age. CKD-MBD related complications therefore require a multi-pronged
INTRODUCTION
Chronic kidney disease has now become an international public health problem affecting 5-10%
of the world population. As renal function declines, there is a progressive impairment in the
kidney’s ability to regulate mineral homeostasis, leading to altered serum concentrations of
calcium, phosphate, parathyroid hormone (PTH), 25 hydroxy vitamin D and fibroblast growth
factor 23 (FGF-23), among others.
These changes are seen as early as CKD stage 3 (GFR< 60 ml/min/1.73m2), when the ability of
the kidney to appropriately excrete a phosphate load is diminished, leading to
hyperphosphatemia. The body compensates by raising levels of PTH and FGF-23 (both of which
are phosphaturic) and decreasing 1,25(OH)2D (which has a net phosphate retentive role). The
conversion of 25(OH) vitamin D to 1,25(OH) 2D which takes place in the kidney, is impaired,
reducing intestinal calcium absorption, and resulting in an increase in PTH (in a bid to raise
serum calcium levels). At the same time there is end organ resistance to the action of PTH and
FGF-23 and downregulation of vitamin D receptors, amplifying the above changes.
The end result of these biochemical abnormalities is disordered bone growth and remodeling as
well as extraskeletal calcification; these entitities now collectively known as chronic kidney
disease related mineral bone disorders (CKD-MBD)
According to the KDIGO guidelines(1), CKD-MBD is defined as:
“A systemic disorder of mineral and bone metabolism due to CKD manifested by either one or a
combination of the following:
2. Abnormalities in bone turnover, mineralization, volume, linear growth, or strength.
3. Vascular or other soft-tissue calcification.”
CKD-MBD is now receiving widespread attention due to the association between several aspects
of CKD-MBD, namely hyperphosphatemia, hypovitaminosis D, hyperparathyroidism and
vascular calcification, and the risk of cardiovascular mortality(2). The early detection and
treatment of CKD-MBD therefore plays an important role in the management of patients with
CKD. With the paucity of information regarding the characteristics of CKD-MBD in the Indian
population, the first step, and one that this study tries to address, is to determine the
characteristics of CKD-MBD in a subset of Indian predialysis patients. This information may
then serve as the basis for future studies that can look into appropriate intervention strategies and
REVIEW OF LITERATURE
Chronic kidney disease (CKD) is defined by KDOQI as the presence of kidney damage
(abnormalities in histopathology, urine, blood or imaging) or reduced GFR (< 60 ml/min/1.73m2)
for ≥ 3 months. The kidney plays an important role in calcium and phosphorus regulation and
hence renal dysfunction is necessarily associated with abnormalities in mineral homeostasis
which have wide ranging effects not only on the bone but also at extraskeletal sites, resulting in
vascular or soft tissue calcification.
Normal bone remodeling
Boneremodeling is an orderly process of bone resorption and its replacement by new bone. The
first step is the stimulation of osteoblastprecursors derivedfrom pluripotent mesenchymal stem
cells. Parathyroid hormone (PTH) or locally produced cytokines such as IL -1 and TNF-α
stimulate the release of soluble factors (macrophage colony stimulating factor, granulocyte
colony stimulating factor, IL-6, IL-11) from osteoblasts which in turn stimulate proliferation and
differentiationof osteoclast precursors(3)(4). Bone resorption is aided by PTH, IL-1, and TNF-α
which stimulate the secretion of collagenase(5) and tissue plasminogen activator (t-PA) and
inhibit collagen synthesis(6). Once extracellular matrix interactions are disrupted, chemotactic
factors (osteocalcin, osteopontin etc) are releasedlocally, and osteoclast integrins bind to specific
sequences on these molecules(7)(8)(9).The bound osteoclast then forms interactions with the
underlying matrix to form an ‘osteoclast clear zone’ whichis not permeable to ions. Insertion of
vacuolar ATPasesand cathepsins into the plasma membrane overlying the clear zone results in
Bone resorption increaseslocal concentrations of calciumor cytokinesin the bone matrix
(e.g., TGF-β, fibroblast growth factor)leading to feedback inhibition of osteoclast activity
and apoptosis(11). These same cytokines that inactivate osteoclasts, attract osteoblasts into
theresorption lacunae and activate them. Bone formation is initiated, leading to osteoblast
proliferation and differentiation, osteoid synthesis,mineralization of the osteoid, and gradual
replacement of the newly formed ‘woven’ bone by ‘lamellar’ bone.
1. Role of PTH and Calcitriol in bone remodeling
PTH stimulates bone formation by increasing the pool of osteoblast precursors, thus
increasing the laying down of bone matrix(12). Osteitis fibrosa, which is associated with
high PTH levels, is therefore characterized by an increase in osteoblast numbers and new
bone formation, which in turn stimulates increased bone resorption, which is why it is termed
high turnover bone disease.
Calcitriol is critical for the maturation and differentiation of both osteoblastsand osteoclasts.
It also upregulates the transcription of osteocalcin and osteopontin genes,which are secreted
by osteoblasts at thetime of mineralization(13). Impaired secretion of these matrix proteins
by osteoblasts then affects matrix organizationand mineralization. Calcitriol deficiency is
therefore characterized by abnormal and unmineralized osteoid and a reduced bone turnover.
2. The kidney and bone mineral homeostasis
The most common type of metabolic bone disease seen in patients with CKD is high turnover
bone disease which is associated with hyperparathyroidism. Hyperparathyroidism in turn is
parathyroid gland and end organ resistance to PTH, all of which are established early in the
course of CKD and increase with progressive renal dysfunction.
2.1 The role of phosphate retention
As the kidney fails, its ability to excrete a phosphate load diminishes, resulting in progressive
increase in ambient phosphate levels. The ‘trade off’ hypothesis(14) states that
hyperphosphatemia transiently reduces serum ionized calcium levels, which in turn triggers
PTH release, resulting in a normalization of calcium and phosphorus levels (by increasing
calcium reabsorption and phosphate excretion in the kidney) and a new higher set point for
PTH. In this model, therefore, hyperparathyroidism is a ‘trade off’ for maintaining normal
calcium and phosphate levels. While early studies which demonstrated an increase in PTH
levels with dietary phosphate loading(15) and a reduction in PTH levels with phosphate
restriction(16) seemed to support this theory, it was later noted that hypocalcemia was not
always demonstrable with phosphate loading, that hypocalcemia was fairly uncommon
except in advanced CKD and that calcium loading failed to suppress PTH(17). The
mechanism whereby hyperphosphatemia resulted in PTH elevation is therefore unlikely to be
entirely mediated through hypocalcemia.
Hyperphosphatemia inhibits calcitriol synthesis by a feedback mechanism and low calcitriol
levels stimulate PTH release(18). Calcitriol supplementation has been shown to reduce
hyperparathyroidism and may be one mechanism by which hyperphosphatemia and
hyperparathyroidism are linked(17).
This is not all, however, since phosphate has been shown to stimulate PTH release
PTH mRNA(19) and the second is by stimulating parathyroid gland hyperplasia through
TGF-α expression, which interacts with the epidermal growth factor (EGF) receptor to
activate the MAP kinase pathway, leading to cyclin-1 induction and cell
proliferation(20)(21).
2.2 Reduced calcitriol synthesis
The kidney is the site of calcitriol synthesis and calcitriol levels decline as renal function
worsens. The inability of PTH to upregulate 1-α hydroxylase in the kidney in response to low
circulating calcitriol levels, points to the presence of factors other than reduced nephron mass
acting to inhibit calcitriol synthesis. These include phosphate retention and FGF-23, a
putative phosphaturic hormone whose levels rise as GFR declines, both of which have been
shown to inhibit 1-α hydroxylase(22). Additionally, as GFR declines, less 25 (OH) vitamin D
is filtered by the glomerulus bound to vitamin D binding globulin, thus limiting its delivery
to the proximal tubule to be taken up by megalin and delivered to tubular 1-α
hydroxylase(23). This limitation in substrate delivery further reduces the kidney’s ability to
synthesize calcitriol. In renal failure associated with significant proteinuria, vitamin D
binding globulin along with bound 25 (OH) vitamin D are lost in the urine, and is another
mechanism for reduced substrate delivery(24). Apart from inhibition of 1-α hydroxylase
activity by phosphate and FGF-23 and reduced delivery of 25 (OH) vitamin D which limit
calcitriol synthesis, there is also end organ resistance to the action of calcitriol. Vitamin D
receptor (VDR) expression in target organs such as the parathyroid gland is reduced(25)(26)
and the ability of the VDR to interact with its response element on DNA is compromised by
2.3 Abnormalities within the parathyroid gland
Calcitriol inhibits PTH release by increasing intestinal absorption of calcium (thus
normalizing serum calcium), by increasing VDR expression in the parathyroid gland(28), by
inhibiting transcription of PTH mRNA(29) and by its effect on parathyroid cell growth(30).
This last effect is mediated via induction of the cyclin dependent kinase inhibitor p21. The
ability of hypocalcemia to cause PTH release from the parathyroid gland is mediated through
the calcium sensing receptor (CaSR), the expression of which is also increased by calcitriol
via the VDR(31). Hyperparathyroidism is characterized initially by parathyroid cell
hyperplasia, which if left untreated results in monoclonal expansion of groups of parathyroid
cells leading to the formation of autonomously functioning parathyroid nodules(32). Both
VDR and CaSR expression within the parathyroid gland have been found to be reduced in
renal failure(33)(34), which makes the gland resistant to regulation by calcitriol.
2.4 End organ resistance to PTH
The primary function of PTH is to maintain a normal serum calcium level. In renal failure,
however, the ability of PTH to generate a calcemic response is blunted. The factors
responsible for this resistance to PTH include hyperphosphatemia(35), low calcitriol
levels(36), reduced expression of PTH receptors(37) and non specific binding of inactive
PTH fragments to PTH receptors(38).
3. MINERAL BONE DISEASE IN CKD 3.1 Clinical signs and symptoms
CKD-MBD is generally asymptomatic or characterized by the presence of non-specific
eyes, pruritus, spontaneous tendon rupture and pathological fractures. Symptoms do not help
to distinguish between low and high turnover bone disease. Extraskeletal calcification
manifests as necrotizing calcific arteriolopathy and calcification of heart valves and major
arteries.
3.2 Classification of CKD-MBD
L – Presence of laboratory abnormalities alone
LB – Presence of laboratory abnormalities and bone disease
LC – Presence of laboratory abnormalities and calcification
LBC – Presence of aboratory abnormalities, bone disease and calcification
3.3 Biochemical abnormalities
Although examination of undecalcified bone biopsy specimens remains the gold standard for
assessing bone mineral disease in CKD, its invasive nature precludes its widespread use as a
diagnostic modality. Biochemical investigations therefore are the mainstay of diagnosis and
serve as markers to formulate and assess treatment strategies.
3.3.1 Prevalence
Data on the prevalence of biochemical abnormalities in predialysis CKD patients is sparse
because of the absence of national registries in most countries and the lack of large cohort
studies. There is also heterogeneity between referred and non-referred CKD patients, further
skewing data. The Study to Evaluate Early Kidney Disease(39), a large outpatient
cross-sectional study involving 1800 predialysis (Stage 3-5) patients spread across 153 centres in
GFR of < 40 ml/min while both 25 (OH) vitamin D and PTH levels showed progressive and
significant changes early in CKD. 12% of patients with GFR > 80 ml/min and 60% of those
with GFR < 60 ml/min, had a PTH > 65 pg/ml. Likewise, 13% of patients with GFR > 80
ml/min/1.73m2 and > 60% of those with GFR < 30 ml/min had low vitamin D levels (< 22
ng/ml). The Kidney Education and Evaluation Program(40) was a community based
screening programme sponsored by the NKF which targeted a population at high risk for
developing CKD, namely adults with GFR < 60ml/min/1.73m2, who were either diabetic or
hypertensive or had a family history of diabetes, hypertension or CKD. In the 2646
individuals screened over a 1 year period, as eGFR decreased from 60 ml/min to 30ml/min,
calcium level decreased (9.55 ± 0.47 to 9.34 ± 0.62 mg/dL), phosphorus increased (3.70 ±
0.59 to 4.15 ± 0.80 mg/dL) and PTH increased (66.3 ± 36.3 to 164 ± 109 pg/mL).
3.3.2 Assessment
Calcium: Only 1% of the total body calcium is present extracellularly and measurable in the
serum. Of this, 40-50% is ionized. Although monitoring ionized calcium is preferred to total
serum calcium as it is physiologically active, it is expensive, not readily available and
therefore not recommended for routine evaluation. Using a colorimetric assay, serum calcium
levels can be measured with a fair degree of precision, the normal range being between 8.5 –
10.5 mg/dL, though these values vary from laboratory to laboratory. Since the non-ionized
portion of serum calcium is bound to albumin and anions such as citrate, bicarbonate and
phosphate, hypoalbuminemia will tend to underestimate total calcium and a correction factor
of 0.8 mg% for every 1 g decrease in albumin below 4 g% needs to be used to arrive at the
Phosphorus: Unlike calcium which is extracellular, phosphate is an intracellular anion and
measured as the sum of dihydrogen phosphate and hydrogen phosphate in the serum. In this
regard, the terms phosphorus and phosphate are used interchangeably. The normal range on a
colorimetric assay is 2.5 – 4.5 mg%, but values are subject to diurnal and postprandial variation
and hence best measured as fasting morning samples.
PTH: PTH is synthesized in the parathyroid gland as a preprohormone which undergoes
progressive cleavage to form the 84 amino acid peptide which is called ‘intact PTH’ (iPTH).
PTH undergoes further cleavage into N-terminal, C- terminal and mid-region fragments both
within the parathyroid gland and in circulation, and these fragments are finally metabolized in
the liver and kidney. The first generation assays to measure PTH were inaccurate as they
measured both iPTH and inactive N and C terminal fragments, whose levels in the blood increase
due to reduced clearance by the failing kidney. The second generation ‘two-site
immunoradiometric’ assay (which uses two antibodies – one binding to the amino terminal and
the second binding to the carboxy terminal) was initially believed to measure only the 1-84
peptide, but was later shown to also bind the C terminal 7-84 fragment (which has antagonistic
effects on the bone(41)) to variable degrees depending on the assay used(42). The third
generation ‘biointact PTH’ assay is believed to measure only the 1-84 fragment, however its cost
and failure to demonstrate a convincingly better predictive value in the diagnosis of bone mineral
disease(43) or correlation with other markers of bone turnover(44), has precluded its widespread
use. Second generation assays are therefore most widely used, but care needs to be taken while
interpreting results, which can vary depending on the type of assay, antibody specificity, type of
ice)(45)(46). Each center must therefore standardize its procedure related to sample collection
and storage and base therapeutic decisions on PTH trends rather than isolated values.
25 (OH) vitamin D: This is the sum of 25 (OH) D2 (ercalcidiol) and 25 (OH) D3 (calcidiol), both
of which are synthesized in the liver by the action of 25-α hydroxylase on the parent compounds
Vitamin D2 (ergocalciferol) and Vitamin D3 (cholecalciferol). While the parent compounds are
lipophilic with short half lives of < 24 hours, making them difficult to measure, 25 (OH) vitamin
D has a half life of 3 weeks and is thus considered the best indicator of body stores of vitamin D
derived from dietary intake and skin synthesis. There are four main methods to measure 25 (OH)
vitamin D. The gold standard is high performance liquid chromatography (HPLC) but is used
only in research settings because it is not readily available, is costly, and requires special
expertise. The radioimmunoassay (RIA) and chemiluminescence assay measure total 25 (OH)
vitamin D, while the liquid chromatography – tandem mass spectrometry (LC-MS/MS) assay,
like HPLC, measures the calcidiol and ercalcidiol fractions separately. Again, cost is a limiting
factor. There is an 80% agreement between these assays for the measurement of vitamin D status
(47), and the systematic bias towards overestimation in the non-HPLC assays can be minimized
by using a single calibrator across all laboratories. At present there is no clear definition of
‘vitamin D deficiency’ (various studies have defined values < 10-15 ng/ml as deficiency and
those > 10-15 ng/ml but < 20-30 ng/ml as insufficiency(48)(49)) and it has not been conclusively
proven that supplementation of vitamin D in the CKD population offers any benefit over and
above that offered by calcitriol supplementation in terms of reducing mortality(50). It is therefore
important for clinicians to not only have an idea of the assay method used at their centre, but also
to balance the cost of such assessment with the likely benefits that may accrue to the patient,
Alkaline phosphatase: This enzyme, which catalyzes the removal of phosphate groups from
target proteins, has several tissue specific isoenzymes, which can be separately measured by
fractionation and heat inactivation. The liver and bone isoenzymes are most abundant and hence
any elevation in t-ALP requires liver disease to be ruled out before it can be ascribed to bone
disease. Both t-ALP and b-ALP are markers of bone turnover and are elevated in primary and
secondary hyperparathyroidism, osteomalacia, Paget’s disease and skeletal metastasis. While
total alkaline phosphatase (t-ALP) is measured colorimetrically, the bone isoenzyme (b-ALP) is
measured with an immunoradiometric assay. Total ALP is an acceptable adjunctive tool to
diagnose CKD-MBD and monitor response to treatment as it is inexpensive. B-ALP, although
more expensive and not readily available, can offer additional information in cases where PTH is
equivocal.
Calcium-phosphorus product (CaP): The product of serum calcium and phosphorus was
previously held to be an important determinant of the overall risk for extraskeletal calcification,
and KDOQI guidelines recommended maintaining this value below 55 mg2/dL2. KDIGO,
however, in its guidelines for CKD-MBD, have warned against an over-reliance on this value
due to the fact that fluctuations in serum phosphorus are the main determinant of the CaP and
both normal and high values of CaP have been linked to poor outcome(51)(52).
3.3.3 KDIGO Guidelines on assessment of biochemical abnormalities in CKD
1. Monitoring of calcium, phosphorus, PTH and alkaline phosphatase should begin at Stage
3 CKD in adults, and Stage 2 CKD in children.
2. 25 (OH) vitamin D measurement is optional, but if found to be deficient may be treated
3. The frequency of monitoring should be based on the stage of CKD, the extent of
abnormalities present and the rate of progression of CKD. (See table below)
4. Treatment strategies should be based on individual calcium and phosphorus values rather
than on the calcium-phosphorus product and should take into account the general trend
[image:21.612.108.546.239.358.2]rather than a single laboratory value.
Table 1: KDIGO guidelines on frequency of measuring biochemical parameters
Stage 3 Stage 4 Stage 5
Calcium, phosphorus, ALP 6-12 months 3-16 months 1-3 months
PTH Baseline 6-12 months 3-6 months
25 (OH) vitamin D Baseline Baseline Baseline
3.3.4 Indian data
Data on biochemical abnormalities in CKD patients in India is sparse and in the predialysis
population, virtually non-existent. A study in North India(53) comparing Vitamin D levels
among 100 CKD patients (34 Stage 4 and 66 stage 5) with 72 controls showed
hypovitaminosis D to be rampant in both the normal and CKD population (only 4% control
and 1% of CKD subjects had values >30 ng/mL). 68% of control and 77% of the CKD
population had vitamin D levels <15 ng/ml whereas the remaining had levels between 15-30
ng/mL. Vitamin D levels were inversely related to PTH levels. Vitamin D levels in CKD
patients were not only lower than in their family members, CKD patients were also more
3.4 Metabolic bone disease in CKD
The second component of CKD-MBD is the evaluation of bone disease, i.e abnormalities in
bone turnover, mineralization, volume, linear growth, and strength. Turnover, mineralization,
volume and growth are assessed by double tetracycline labeled bone histomorphometry.
Bone strength is a composite of bone quality and bone mineral density. Bone quality is also
evaluated by histomorphometry, while bone mineral density is evaluated by dual energy
X-ray absorptiometry (DEXA).
3.4.1 Classification
Based on differences in bone turnover and mineralization, renal osteodystrophy has been
traditionally classified as:
1. Osteitis fibrosa: High turnover with normal mineralization
2. Osteomalacia: Low turnover with abnormal (decreased) mineralization
3. Adynamic bone disease: Low turnover with normal mineralization and acellularity
4. Mixed osteodystrophy: Increased turnover with abnormal mineralization
3.4.2 Pathophysiology
Apart from the factors responsible for hyperparathyroidism mentioned previously, the
following factors also play a role in the pathogenesis of bone mineral disease in CKD.
• Reduced dietary intake of calcium(54)
• Acidosis, which inhibits 1 α hydroxylase (thus reducing calcitriol synthesis) and
• Dialysis modality: Use of heparin during dialysis which results in osteopenia, the greater
phosphate removal and dialysate calcium level, both of which predispose to adynamic
bone disease in CAPD, and accumulation of β2 microglobulin with decline in renal
function, which directly stimulates osteoclasts and promotes bone resorption(57)
• Vitamin D deficiency due to reduced dietary intake and reduced skin synthesis secondary
to infrequent sunlight exposure and melanosis of the skin(58)
• Premature hypogonadism which is associated with lower levels of growth factors such as
TGFβ and IGF-1 required for bone formation(59).
3.4.3 Assessment
Role of bone histomorphometry: Although a bone biopsy is invasive and difficult to
perform, it remains the gold standard for diagnosing and classifying bone mineral disease
because biochemical parameters cannot accurately predict the type of bone mineral disease
and because certain pathologies such as aluminium related bone disease cannot be diagnosed
without it.
Fluorochrome double tetracycline labeling:
Method: Tetracycline 250 mg thrice daily is given to the patient for 3 days (first label) and
the dose is repeated after 14 days (second label). The patient is biopsied 5 days after the
second label. Dairy products and aluminium containing antacids which can bind to
tetracycline should be avoided for 2 hours before and after the label.
Principle: Tetracycline binds to newly formed bone at the unmineralized bone/osteoid
the first dose allows the measurement of the amount of bone formed in the interval as the
distance between the two fluorescent labels
Specimen processing:
• Bone piece should be intact and unfractured, with an internal diameter of at least 7.5 mm
• Ethanol (70%) is suitable for fixation, shipping, and storage. The bone should not be
decalcified.
Interpretation: Parameters assessed on bone histomorphometry include:
z Static features of cortical bone
- Cortical width (Ct.Wi): The combined thickness of both cortices
- Cortical porosity (Ct.Po): The area occupied by intercortical holes expressed as a
percentage of the total cortical area
z Static features of cancellous bone
- Cancellous bone volume (BV/TV): The area occupied by cancellous bone
expressed as a percentage of total marrow area
- Trabecular features: thickness (Tb.Th), separation (Tb.Sp), number (Tb. N)
- Osteoid features: Osteoid surface (OS/BS) – the percentage of cancellous surface
with unmineralized osteoid; Osteoid thickness (Os.Th) – the mean thickness in
µm, of the osteoid
z Dynamic features of cancellous bone
- Activation frequency (Ac.f): This is a measure of overall remodeling activity
- Mineralization lag time (Mlt): The time interval between osteoid formation and
- Bone formation rate (BFR): A measure of the amount of cancellous bone volume
or surface which is being replaced annually
3.4.4 Prevalence data
A systematic review of bone biopsy findings in CKD Stage 3-5 patients, carried out by
KDIGO(1), revealed the following prevalence data: Osteitis fibrosa was the most common
form of renal osteodystrophy (32%), followed by mixed osteodystrophy (20%) and normal
histology (16%). Osteomalacia, adynamic bone disease and mild forms of osteodystrophy
accounted for 8%, 18% and 6% respectively. With the initiation of dialysis, the pattern of
osteodystrophy changed, with the majority (60%) of PD patients developing adynamic bone
disease, and HD patients having mixed and osteitis fibrosa histologies in roughly equal
amounts (32% and 34% respectively). Data on bone histomorphometry in predialysis patients
in India is not available.
3.4.5 Relation between bone biopsy findings and clinical outcome
Both adynamic bone disease(60)(61) and osteomalacia(62) have been shown to be associated
with an increased risk of fracture which in turn is linked to increased mortality. In addition,
low turnover bone disease and adynamic disease in particular, have been linked with an
increased risk of aortic(63)(64) and coronary artery calcification(65), which is exacerbated
by a high calcium load.
3.4.6 Guidelines regarding indications for bone histomorphometry (KDIGO)
2. Unexplained hypercalcemia or hypophosphatemia, severe bone pain, or unexplained
increase in bone alkaline phosphatase activity
3. Suspected aluminum bone disease
4. Prior to parathyroidectomy
5. Prior to initiation of bisphosphonate therapy in CKD Stage 3-5
3.5 Standard X rays
Standard X rays have only 60% sensitivity and 75% specificity for the diagnosis of osteitis
fibrosa(66). The recommended battery of X rays for the diagnosis of CKD-MBD include X
rays of the hand (AP), shoulder, skull, lumbar spine (lateral) and pelvis (AP).
Changes in Osteitis Fibrosa: Rugger jersey spine, loss of lamina dura of the jaw, terminal
acrolysis, subperiosteal resorption and periosteal new bone formation, ‘pepper pot’ skull.
Changes in osteomalacia: Looser’s zones (areas of translucency at areas of mechanical stress
where lamellar bone has been replaced by unmineralized woven bone)
3.6 Bone mineral density
A measure of bone strength is its mineral content per unit area, also known as the bone mineral
density (BMD). A low BMD can be the result of a decrease in mineral content (as seen in
osteomalacia) or a loss of bone volume (as seen in osteoporosis). BMD is measured by dual
X-ray absorptiometry (DEXA) and quantitative CT among other modalities. It is expressed in
terms of the T score, which is the BMD of the patient compared to a healthy 30 year old of the
3.6.1 Prevalence data: NHANES III found 28% of female patients with CKD stage 3-4 to
have osteoporosis(67). BMD declines as GFR declines and predialysis patients have a higher
prevalence of osteoporosis compared to age, sex and weight matched controls(68). Similar data
is not available for CKD patients in India.
3.6.2 Importance of BMD: A low BMD has been conclusively shown to be associated with
increased fracture risk and mortality in the normal population(69). DEXA scans have therefore
become an accepted modality for screening patients who are believed to be at a high risk for
developing osteoporosis, namely men and women > 65 years old, postmenopausal women,
patients on long term steroids/cyclosporine/anticonvulsant therapy, patients with prior history
of fragility fractures and hypogonadism.
3.6.3 DEXA scan: It uses two X-ray beams of differing energies that pass through the area of
interest. Bone attenuates each X-ray to a varying degree and a collimator placed beneath the
patient calculates the bone mineral content based on the degree of attenuation.
3.6.4 DEXA in CKD: Although bone mineral density has been shown to decrease with
progression of CKD, unlike the general population, a decreased BMD in CKD patients does
not have the same predictive value vis a vis fracture risk(70). The measurement of BMD in
CKD is complicated by the presence of aortic calcification, scoliosis and degenerative changes
such as vertebral osteophytes which can confound the interpretation of lumbar spine DEXA
scans. DEXA cannot distinguish between changes in cortical and cancellous bone which is an
important drawback in CKD, since hyperparathyroidism results primarily in cortical bone loss,
while trabecular bone volume increases. Different bones in the body have varying proportions
patient. For example, while the forearm bones are almost wholly cortical, the spine is 42%
trabecular and the femur 25% trabecular(71). As DEXA measures BMD in only two
dimensions, volumetric assessment is not possible and it systematically overestimates BMD in
tall people and underestimates BMD in short people. Finally, the most important cause for
increased fracture risk in CKD is abnormal underlying bone architecture, which again cannot
be assessed by BMD measurement(72).
3.6.5 Quantitative CT (QCT): QCT uses CT technology to measure bone mineral content.
Because of its superior resolution it is able to reliably distinguish between cortical and
trabecular bone. Volumetric assessment of trabecular and cortical bone BMD is possible and it
can be used at both central and peripheral sites(73). BMD measured by QCT has been found to
correlate well with trabecular bone volume measured by histomorphometry of iliac crest
biopsies, however it is costly and not universally available.
3.6.6 Ultra high resolution peripheral QCT: Separate three dimensional assessment of
trabecular and cancellous bone, endosteal and periosteal circumferences, cortical area and
thickness is possible(74). Its higher resolution allows visualization of ultrastructural
characteristics as fine as trabecular thickness, number and separation.
3.6.7 Micro MRI: Offers a three dimensional visualization of ultrastructural details which can
be analyzed like a bone biopsy(75).
3.6.8 KDIGO guidelines on BMD in CKD: The routine use of DEXA for evaluation of
CKD-MBD in CKD Stage 4-5 is not recommended, because it cannot predict fracture risk as it does
in the general population, and factors other than osteoporosis are responsible for poor bone
3.7 Bone markers
3.7.1 Classification
Collagen based markers associated with bone formation
• N and C terminal propeptides of procollagen type 1: Generated by posttranslational
cleavage of procollagen
Collagen based markers associated with bone resorption
• Carboxy and aminoterminal crosslinking telopeptide (generated by cleavage of
pyridinoline bonds linking adjacent collagen molecules)
• Pyridinoline and deoxypyridinoline
Non collagen based bone markers associated with bone formation
• Bone specific alkaline phosphatase (secreted by osteoblasts)
• Osteocalcin
• Osteoprotegerin
• Receptor Activator for nuclear factor κB ligand (RANK-L)
Non collagen based bone markers associated with bone resorption
1. Tartrate resistant phosphatase (secreted by osteoclasts)
3.7.2 Bone markers and histology: KDIGO conducted a metanalysis of studies that looked at
b-ALP, osteocalcin and collagen linking molecules). Osteocalcin and collagen
cross-linking peptides had correlation coefficients ranging from 0.2 – 0.7 and 0.7- 0.9 respectively(1).
However, bone markers have not been found to be good predictors of bone volume(76).
3.7.3 Bone markers and BMD: Bone markers are not useful in predicting BMD since, as
mentioned previously they have not been found to correlate well with changes in bone volume
and BMD itself is a poor guide to bone histology. In high turnover bone disease, which is often
characterized by increased formation of new bone which is radiologically less dense, bone
markers may be elevated though BMD may be reduced (new bone has a lower mineral content).
On the contrary, low turnover bone disease may have a higher BMD due to a higher mineral
content even though the overall bone volume has not increased.
3.7.4 Current role: In the normal population, bone markers have been used to assess response
to therapy and in some studies have been shown to predict subsequent fracture risk better than
serial BMD measurement(77). However, in the CKD population, their role is limited at best
since, being renal excreted, their levels are likely to be non-specifically elevated. There is also no
evidence that they predict fracture risk any better than b-ALP or PTH(78) and hence their routine
use in the assessment of CKD-MBD is not recommended.
4. EXTRASKELETAL CALCIFICATION
4.1 Pathophysiology
Vascular smooth muscle cells (VSMCs) in the setting of diabetes, aging, inflammation or
uraemic milieu, undergo phenotypic switch to osteoblast like cells due to upregulation of
transcription factors such as RUNX-2 and MSX2(79). These osteoblast like cells lay down
mineralization(80). Factors which accelerate this process include hyperphosphatemia,
hypercalcemia, adynamic bone disease(81) (which prevents calcium buffering by the bone),
osteitis fibrosa (which results in calcium resorption from the bone and higher ambient calcium
levels) and a deficiency of inhibitors of calcification, namely fetuin-A, matrix Gla protein,
pyrophosphate and osteopontin(82).
4.2 Prevalence
Valvular and vascular calcification have been shown to be strong predictors of cardiovascular
risk in the normal population(83). CKD patients have been shown to have both a higher
prevalence and faster progression of extraskeletal calcification. Pooled data from various studies
suggest that 47–83% of predialysis patients had cardiovascular calcification on EBCT, while
valvular (aortic or mitral) calcifications were present in 20–25% of 653 patients with CKD stages
3–5 in the Multi-Ethnic Study of Atherosclerosis(84).
4.3 Importance
Follow up studies in CKD patients have shown that once vascular calcification is established, it
follows a progressive course, while patients who do not have calcification at baseline are
unlikely to develop calcification in the future(1). In CKD patients, calcification or progression of
calcification are independent risk factors for cardiovascular and all cause mortality(85)(86).
4.4 Assessment
1. Electron beam CT (EBCT) and Multi-slice CT (MSCT): Current gold standard for the
detection and quantification of vascular calcification. Calcification is quantified in terms
rays are produced by electrons impacting a tungsten ring and 3 mm slices are obtained at
high speed from the top to the base of the heart. MSCT uses a paired X-ray source
detector revolving around the patient and 2–64 simultaneous sections are obtained. The
thickness of the slices varies from 1.5–0.6 mm and hence the MSCT has a higher spatial
resolution when compared to EBCT.
2. Lateral abdominal X ray: Allows a semiquantitative estimation of aortic calcification
using the aortic calcification index as described by Kaupilla et al(87), where the anterior
and posterior aortic walls opposite lumbar vertebrae 1-4 are observed on a lateral
abdominal X ray and scores assigned depending on the severity of calcification.
3. Echocardiography: Assesses aortic and mitral valvular calcification
4. Pulse pressure and Pulse wave velocity: As a bolus of blood is ejected through a vessel,
its wall undergoes distension followed by recoil, from which the velocity of the blood
flow can be calculated. As a result of vascular calcification the vessel wall becomes stiff
and traveling velocity increases. PWV is therefore an indirect marker for vascular
calcification.
4.5 Correlation between imaging modalities
As mentioned above, EBCT and MSCT are the gold standard. Lateral abdominal X ray (67,91%)
and echocardiography (53,70%) have a reasonable sensitivity and specificity compared to CT,
though pulse pressure correlated poorly(88).
4.6 Guidelines
KDIGO does not routinely recommend the screening of patients with CKD Stage 4-5 for
vascular calcification affords any mortality benefit. Patients with persistent hyperphosphatemia
or those on the transplant waiting list, may be considered for screening. While EBCT is the gold
standard for evaluation of vascular calcification, KDIGO, based on comparative studies, suggests
that lateral abdominal X ray for aortic calcification, and echocardiography for valvular
calcification, may be acceptable alternatives where CT is not available. KDIGO also suggests
that patients found to have vascular calcification should be deemed to be at high cardiovascular
risk.
5. MANAGEMENT OF CKD-MBD
5.1 Management of hyperphosphatemia
5.1.1 Evidence: Hyperphosphatemia has been associated with increased mortality and poor
outcome in both pre-dialysis and dialysis patients, the last association being consistent across
various countries and holding good for both haemodialysis and PD patients(89)(90). This is
probably because of its epidemiological association with cardiovascular disease(91).
Hyperphosphatemia has also been shown to promote and exacerbate other aspects of CKD-MBD
such as hyperparathyroidism(92), low calcitriol levels(93) and vascular calcification(94). There
is however, a lack of conclusive data from RCTs that lowering phosphorus levels improves
clinical outcomes. Calcium-based and non-calcium containing phosphate binders did not differ in
their ability to lower phosphate levels or impact patient outcomes(95), although there was a
lower prevalence of hypercalcemia and higher mean PTH levels with the use of non-calcium
containing binders. Sevelamer was found to retard the progression of vascular calcification in
5.1.2 Treatment options:
1. Dietary phosphate restriction: KDOQI recommends a dietary phosphate intake of <
800 mg/day as the first step in management of hyperphosphatemia, however phosphate
restriction alone is ineffective in retarding progression of extraskeletal calcification
unless combined with phosphate binders(97).
2. Phosphate binders
Aluminium hydroxide was the first phosphate binder used, and to date has the highest
phosphate binding capacity. However, long term use of aluminium hydroxide is
associated with neurological, haematological and bone related toxicities and hence its use
is generally avoided, except in patients with severe hyperphosphatemia in whom it can
be used for < 2 weeks to bring down the calcium-phosphate product and avoid soft tissue
calcification.
Calcium based phosphate binders such as calcium acetate, calcium citrate and calcium
carbonate have 25%, 22% and 40% elemental calcium respectively. While effective in
binding phosphate, they have the potential side effects of PTH suppression and
extraskeletal calcification due to calcium loading. They also cause GI side effects such as
bloating and nausea. Calcium citrate is not recommended in CKD due to its ability to
enhance dietary aluminium absorption.
Sevelamer hydrochloride/carbonate: Being non-calcium containing and non
absorbable, it has the potential to reduce extraskeletal calcification when compared to
calcium containing phosphate binders. Sevelamer has also been shown to reduce LDL
levels. The hydrochloride salt has been associated with a tendency to worsen acidosis,
Lanthanum carbonate: Non-calcium containing binder which has a higher phosphate
binding capacity than sevelamer. The long term clinical consequences of its use are not
known as there is a potential for its accumulation due to GI absorption and subsequent
deposition in the bone, although unlike aluminium, lanthanum induced bone toxicity has
not been demonstrated(98).
3. Dialysis: Alternative dialysis modalities that offer more frequent, long duration sessions
have been shown to result in significant reduction in serum phosphate level, with 50% of
such patients not requiring phosphate binders(99). This may be an option for patients who
are refractory to diet restrictions and phosphate binders or non-compliant.
5.1.3 Guidelines on management of hyperphosphatemia (KDIGO):
1. Serum phosphorus levels should be maintained within the normal range for the given
laboratory
2. Dietary phosphate intake should be restricted
3. While aluminium based phosphate binders should be avoided, the use of both calcium
and non calcium containing phosphate binders is appropriate and the choice of phosphate
binder should be individualized based on other aspects of CKD-MBD such as the
presence or absence of hypercalcemia, dyslipidemia etc.
4. For patients with persistent hyperphosphatemia despite the above, increasing the
frequency and/or duration of dialysis is an acceptable option to increase phosphate
5.2 Maintaining calcium homeostasis
5.2.1 Evidence: There is no data to support that hypercalcemia is associated with an increase in
mortality or fracture risk in CKD Stage 3-5. In dialysis patients, the upper limit of serum calcium
above which the relative risk of mortality increases has not been defined, with studies reporting
values anywhere between 9.5 – 11.4 mg%(89)(100). Serum calcium levels < 8.5 mg% have also
been linked to an increase in mortality(101).
5.2.2 Treatment options
1. Dietary intake: Calcium supplementation (upto 2g/day) has been shown to reduce PTH
levels, however this benefit must be weighed against the risk of extraskeletal
calcification.
2. Dialysate calcium concentration: Although the exchangeable calcium compartment is
very small, the net calcium flux during dialysis is an important determinant of calcium
load in the long term. Studies in HD patients have shown that a 2.5 meq/L dialysate
calcium concentration would result in a neutral calcium flux for the majority(102).
Calcium flux in turn is not uniform between patients and is determined by the individual
patient’s ionized calcium, the frequency and duration of dialysis and the rate of
ultrafiltration(103). The dialysate calcium concentration can therefore be modified based
on the individual patient’s needs, with a higher (3.5 meq/L) calcium bath for patients with
hypocalcemia, 2.5 – 3 meq/L bath for patients with normocalcemia and a 2 meq/L
calcium bath for patients with persistent hypercalcemia, adynamic bone disease or
extraskeletal calcification. The risk of intradialytic hypotension and arrhythmias with low
exposed to dialysate for a longer period of time, the risk of hypercalcemia and adynamic
bone disease is higher and it is recommended that dialysate calcium be maintained in the
2.5-3 meq/L range.
5.2.3 KDIGO Guidelines:
1. Serum calcium levels should be maintained within the normal range for the given
laboratory (and preferably in the 8.5-9.5 mg% range as per KDOQI)
2. Dialysate calcium concentration should be individualized based on the patient’s serum
calcium level, though in a majority a dialysate calcium concentration between 2.5 – 3
meq/L would be optimal.
3. In patients with persistent hypercalcemia, calcium based phosphate binders, calcitriol and
vitamin D supplements should be avoided
5.3 Management of hyperparathyroidism
5.3.1 Evidence: PTH values below 2 times normal and above 9 times normal have been linked
with increased mortality in predialysis and post dialysis patients(105)(101), however normalizing
PTH levels has not been shown to conclusively improve mortality. This paradox can be
explained in part by the heterogeneity in PTH assays, end organ resistance to PTH and the poor
predictive value of elevated PTH for underlying bone histology(106). The general consensus
however, is to treat hyperparathyroidism due to its deleterious effects on bone histology.
5.3.2 Treatment options:
1. Management of hyperphosphatemia and hypocalcemia, both of which can result in
analogues or calcium containing phosphate binders suppresses PTH through the CaSR,
while lowering phosphate levels reduces PTH by a posttranscriptional effect.
2. Vitamin D analogues: These include naturally occurring forms (ergocalciferol,
cholecalciferol and calcitriol), synthetic vitamin D2 analogues (paricalcitol,
doxercalciferol) and synthetic vitamin D3 analogues (alfacalcidol, falecalcitriol,
maxacalcitol). Of these doxercalciferol and alfacalcidol are 1-α derivatives that require
25 hydroxylation in the liver. Vitamin D analogues have been shown to reduce PTH and
other biochemical parameters of bone mineral disease with improvement in bone
histomorphometry parameters(107)(108) and form the first line therapy for the
management of hyperparathyroidism.
3. Calcimimetics: Calcimimetics like cinacalcet function as allosteric modulators of the
CaSR in the parathyroid gland, which augment intracellular signaling secondary to
binding of ionized calcium, resulting in an increase in intracellular calcium and inhibition
of PTH release. It has no effect on intestinal or renal handling of calcium. The ability of
cinacalcet to lower PTH levels without causing hypercalcemia or
hyperphosphatemia(109)(110) makes it a useful tool in the management of
hyperparathyroidism especially in patients who have failed a trial of vitamin D analogues
due to the above side effects. Cinacalcet related side effects include hypocalcemia,
nausea and vomiting.
4. Parathyroidectomy can be performed by ablation (local injection of alcohol or
calcitriol) or surgical removal (subtotal parathyroidectomy or total parathyroidectomy
with autologous reimplantation in the forearm). Ablation is usually carried out in small
patients who are not fit for major surgery. It is not useful for ectopic glands or large
nodular glands with markedly raised PTH levels, and requires expertise, as it may result
in recurrent laryngeal nerve palsy. Surgical parathyroidectomy generally results in a
sustained improvement in biochemical profile which is maintained for upto 5 years post
surgery(111), though there is also the risk of recurrence(112) or persistent
hypoparathyroidism. There are no RCTs comparing medical and surgical therapy and no
evidence to suggest total parathyroidectomy and subtotal parathyroidectomy differ in
their efficacy.
Indications for parathyroidectomy
1. Elevated PTH levels > 800 pg/ml associated with hypercalcemia and/or
hyperphosphatemia that are refractory to medical therapy
2. Clinical signs and symptoms associated with refractory hyperparathyroidism
(hypercalcemia, uncontrolled hyperphosphatemia, evidence of osteitis fibrosa cystica on
bone biopsy, radiology or bone metabolic markers, enlarged and/or nodular parathyroid
glands (> 500 mg), calciphylaxis, intractable pruritus, EPO resistant anaemia, severe
bone pain, severe skeletal deformity, progressive calcification of blood vessels)
5.3.3 Guidelines on management of hyperparathyroidism (KDIGO)
1. The optimal PTH level for CKD Stage 3-5 is not known, but levels above the upper limit
of normal should prompt evaluation for hyperphosphatemia, hypocalcemia and Vitamin
D deficiency. If PTH remains elevated despite correction of the above factors, treatment
2. In patients on dialysis, PTH levels should be maintained at 2-9 times the upper limit of
normal and levels above this range should be treated with vitamin D analogues or
calcimimetics or a combination. Vitamin D analogues and calcimimetics should be
stopped if PTH falls below 2 times the upper limit of normal.
3. Vitamin D analogues should be stopped if patient develops hypercalcemia or
hyperphosphatemia
4. Cinacalcet should be stopped if the patient develops hypocalcemia
5. In patients with hyperparathyroidism refractory to medical or pharmacological therapy,
parathyroidectomy may be considered
5.4 Management of extraskeletal calcification
1. Use of non-calcium containing phosphate binders such as sevelamer has been shown to
retard the progression of calcification when compared with calcium acetate(113)(109)(97).
This, has however, not been shown to translate into an improvement in patient
outcome(114)(115).
2. Synthetic vitamin D analogues in general, have been shown to be associated with a lower
risk for progressive calcification with equivalent PTH reduction compared to calcitriol(116).
3. As calcification is part of the natural history of atherosclerosis, despite there being no
evidence that statin therapy is associated with a reduction in cardiovascular events in CKD
patients(117)(118), statin therapy is probably acceptable in patients with established
AIMS AND OBJECTIVES
1. To study the clinical, biochemical and radiological (vascular calcification, valvular
calcification, bone mineral density) parameters relating to bone mineral disease in CKD
Stage 4 and 5 patients.
2. To determine risk factors for the development of vascular/ valvular calcification and bone
PATIENTS AND METHODS
DESIGN AND LOCATION: This hospital based cross sectional survey was conducted at the
Department of Nephrology, Christian Medical College, Vellore.
PATIENTS: Stage 4 and 5 CKD patients who satisfied the following inclusion and exclusion
criteria were included:
INCLUSION CRITERIA:
1. Patients with newly diagnosed Stage 4-5 CKD (based on history, eGFR of < 30
ml/min/1.73 m2 by the abbreviated Modification of Diet in Renal Disease formula, with
ultrasonographic and/or histological evidence of CKD) who:
• Were not yet on dialysis
or
• Were being initiated on haemodialysis for the first time at CMC or on
haemodialysis for < 1 month at the time of enrolment in the study
or
• Were being initiated on CAPD for the first time at CMC or on CAPD for < 1
month at the time of enrolment in the study
2. On calcium supplements/vitamin D supplements/phosphate binders for less than 3
months and with no prior history of calcimimetic use.
EXCLUSION CRITERIA:
2. Patients on calcium supplements, vitamin D supplements or phosphate binders for more
than 3 months or any prior history of calcimimetic use.
3. History of steroid/cyclosporine or anticonvulsant use for > 3 months
DURATION: Patients attending the Nephrology OPD between November 2009 and August
2010 were included in the study.
METHODOLOGY: Patients attending Nephrology OPD and fulfilling the inclusion criteria
detailed above, were selected for inclusion in the study. A detailed proforma was filled up for
each patient recording their demographic data, socioeconomic status, history of symptoms
suggestive of CKD-MBD, drug history with specific emphasis on phosphate binder, calcium
supplement, calcimimetic and vitamin D use, dietary history, daily sunlight exposure and history
and duration of dialysis. Informed consent was taken in the appropriate format. Biochemical
parameters such as fasting and postprandial blood sugar, lipid profile, haemoglobin, B. urea, S.
creatinine, S. bicarbonate, S. Calcium, serum albumin, phosphate, PTH, Alkaline phosphatase
and 25 hydroxy vitamin D were measured. Lateral abdominal X rays for aortic calcification,
echocardiography for valvular calcification, and DEXA scan of the femoral neck for bone
mineral density were taken.
MEASUREMENTS:
Height and Weight were measured using height and weighing scales, standardized according to
the specifications of the Department of Legal Metrology of the Government of India. BMI was
calculated by dividing weight (in kg) by height (in meters).
2. CLINICAL BIOCHEMISTRY
Serum calcium, phosphate, bicarbonate, alkaline phosphatase, haemoglobin , blood urea, S.
creatinine, Serum albumin, glucose fasting and post prandial and lipid profile were measured
using automated analyzers.
iPTH was measured using the Immulite™ Indirect Chemiluminometric assay (Diagnostics
Products Corporation, CA, USA). All samples were transported on ice to the laboratory and
processed immediately.
Principle: This two site sandwich immunoassay uses a monoclonal mouse anti-PTH (44-84)
antibody and a polyclonal goat anti-PTH (1-34) antibody conjugated to alkaline phosphatase.
The unbound conjugate is removed by centrifugal wash, and a chemiluminiscent substrate, which
is a phosphate ester of adamantly dioxetane is added and incubated. The substrate is hydrolyzed
to an unstable intermediate which produces a sustained emission of light. The photon output
measured by the luminometer is proportional to the concentration of PTH in the sample.
25 (OH) vitamin D was measured using the Elecsys Modular Analytics E170 Immunoassay
System (Roche Diagnostics, GmbH, Manheim, Germany)
Principle: This is an electrochemiluminescence immunoassay (ECLIA) in which 25 (OH)
biotin labeled 25(OH) vitamin D is added and occupies the free sites on the antibody. When
electrically stimulated, ruthenium produces reactive species which emit light. The counts per
second detected by the system is inversely proportional to the concentration of vitamin D in the
serum.
Estimated GFR (eGFR) calculation: Patients were classified as Stage 4 or 5 CKD based on
estimation of their GFR using the abbreviated MDRD (aMDRD) equation, given by:
aMDRD GFR = 186 X (S.Cr) -1.154 X (Age) -0.203 X (0.742 if female) X (1.210 if African
American)
3. RADIOLOGICAL INVESTIGATIONS
X ray abdomen (lateral view)
Lateral abdominal X-ray to detected abdominal aortic calcification was obtained with a voltage
of 70 kV according to standard protocol with the patient in standing position and the film at 100
cm distance.
Calcific lesions were looked for in the area parallel and anterior to the lumbar spine (L1- L4) and
assessed separately for the anterior and posterior walls of the aorta using the midpoint of the
intervertebral space above and below as the boundaries according to the method described by
Kaupilla et al.(87). The anterior and posterior walls of were graded separately for calcification as
follows:
1 – small, scattered calcific deposit filling less than 1/3rd of the longitudinal wall of the aorta
2 – calcific deposit filling more than 1/3rd but less than 2/3rd of the longitudinal wall of the aorta
3 – 2/3rd or more of the longitudinal wall of the aorta calcified
The following scores were then calculated:
Affected segments score: Number of individual segments of the aorta (either anterior or
posterior) showing calcification. Minimum score = 0, Maximum score = 4
Anterior and posterior affected score: The number of individual aortic segments, either anterior
or posterior,showing calcification. Minimum score = 0, Maximum score = 8.
Anteroposterior severity score: The scores of individual segments from the anterior and posterior
wall are added up. Minimum score = 0, Maximum score = 24.
DEXA scan (Femoral neck)
Procedure: Dual Emission X ray Absorptiometry (DEXA) scan of the left femoral neck was
obtained using the Hologic QDR 4500C system with the patient supine and the leg internally
rotated to correct femoral anteversion. The BMD, T score and Z score were recorded.
Principle: The DEXA scan uses two X-ray beams of differing energies focused on the area of
interest. Differential attenuation of each beam by the bone results in prolongation of transmission
of the beams through a filter onto a counter to a degree proportional to the bone mineral content.
Definitions:
T score is obtained by comparing the patient's BMD to that of a healthy 30 year old of the same
sex and ethnicity and is expressed as standard deviations above or below the accepted normal.
The WHO has defined the following criteria for interpreting T scores:
Normal: T score of -1 or above
Osteopenia: T score of -1.0 to -2.5
Osteoporosis: T score of less than -2.5
Z score: Comparison of the patient’s BMD with that of a normal subject of the same age, sex,
and ethnicity and expressed as standard deviations above or below the accepted normal.
Echocardiography for valvular calcification
Echocardiography was carried out using a 2.5 MHz transducer, with patient in left lateral
decubitus position, using the parasternal long and short axis views, by a single cardiologist who
was blinded to all clinical details. Calcification was defined as the presence of echo brightness
exceeding that of normal valve tissue. Semiquantitative assessment of valvular calcification was
carried out using 2 separate scoring systems as described by Pressman et al(119):
a. Simplified Echocardiographic score
1. Aortic valve calcification (0 = absent, 1 = present)
2. Mitral valve or annular calcification (0 = absent, 1 = present)
3. Subvalvular apparatus calcification (0 = absent, 1 = present)
4. Restriction of either valve (0 = absent, 1 = present)
b. Main Echocardiographic score
2. PML restriction (0 = absent, 1 = present)
3. Anterior annulus calcification (0 = absent, 1= present)
4. AML restriction (0 = absent, 1= present)
5. MV calcification (0 = absent, 1 = mild, 2 = > mild)
6. Subvalvular apparatus calcification (0 = absent,1 = present)
7. AV calcification (0 = absent, 1 = nodule in < 3 leaflets, 2 = nodules in 3 leaflets, non
restrictive; 3 = restrictive)
8. Aortic root calcification (0 = absent,1 = present)
The cumulative main echocardiographic and simplified echocardiographic scores were obtained
for each patient.
SAMPLE SIZE:
As there are no Indian studies on CKD-MBD in predialysis patients a sample size could not be
arrived at. It was decided to include a minimum of 500 patients in the study.
STATISTICAL ANALYSIS:
Statistical analysis was done using SPSS v.15 and the various analytical techniques used were as
follows:
Mean ± standard deviations were used for normally distributed data and median & range (min –
max) was used for skewed data to avoid the outlier effect.
Significance was determined by Chi square test for categorical data and ANOVA for continuous
data. Cohen’s Kappa test was used to assess concordance between the two echocardiographic