AW: Contribution of Floodplain Wetland Pools to the
Ecological Functioning of the Fitzroy River Estuary.
Marcus Sheaves (James Cook University)
John Collins (James Cook University)
Wayne Houston (Central Queensland University)
Pat Dale (Griffith University)
Andrew Revill (CSIRO)
Ross Johnston (James Cook University)
contributions. However, we would like to give special thanks to Bob Packet, Peter Verwey,
Ronald Baker, Janine Sheaves, Jon Knight, Jane Wilson, Robert Black, Rod Elder and Ann
Penny for help with field work; to Rod Connolly, Ian Halliday, Jonathan Staunton Smith, Julie
Robins, Peter Gehrke, Phillip Ford, Ian Webster, Richard Rowe, Scott Smithers, Jon Knight
and the staff from Rockhampton Zoo (Simon Walton, Jason Countryman, Chris Mehrton) for
advice, conceptual feed-back and technical assistance; to Bill Sawynok, Bob Packet and
Peter Long for the wealth of local knowledge and background information they supplied; to
Charlie and Marion Farrow, Nelson Howkins, Dave and Des Dingle, Robert And Michelle
Beak, Ian Christiansen, Alice Springs Pastoral Company (David Worroner, Frank Titmus) and
Integrated Tree Cropping Pty Ltd (Peter Larsen, Richard Lunney) who kindly allowed free
access through their properties and provided location-specific information; and to Bob Packet,
Peter Verwey, Bob Noble for on-the-ground facilitation of field work and assemblage of
complimentary data. We would also like to acknowledge the Bureau of Meterology, Cheetham
Salt (Mike Truscott), John Broadbent, EPA Technical Services and Maritime Safety
Queensland for access to tidal and climate data. Finally, we would like to acknowledge the
continued assistance of the CRC-CZ management team who helped solve the many and
5
Table of Contents
Non-technical summary...11
Methods...11
Results...12
Connectivity...12
Faunal Composition...14
Faunal Composition and Connectivity...14
Trophic Roles of Fish and Invertebrates...15
Food Web Structure...15
Within-Pool Distribution of Aquatic Vertebrates...15
Fish Condition...16
Conclusions & Implications...16
Chapter 1...18
Introduction...18
Nursery-Ground Function of Littoral wetlands...18
The Relationship between Water Bird Populations and Nursery-Ground Function of Littoral Wetlands...20
Littoral Wetlands and Nutrients and Pollutants...21
Fitzroy Estuarine Floodplain Wetland Pools...21
User Needs...22
Aims:...23
Chapter 2...24
Physical Nature of Fitzroy Floodplain Wetland Pools...24
Summary...24
Study Sites...24
Pool Definition...24
Selection Criteria...25
Site Selection...26
Study Sites...26
Pool Descriptions...28
Frogmore and Woolwash Lagoons...30
12 Mile Creek...32
Munduran Creek...33
Gonong Creek...33
Chapter 3...35
Dynamics of the Physical Environment of Fitzroy Wetland Pools...35
Summary...35
Introduction...35
Aim:...36
Methods...36
Measurements of Water Quality Parameters:...37
Measurements of Depth and Pool levels:...37
Connection depths:...38
Results and Discussion...39
The Physical Environment...39
Physical Connectivity...46
(1) Infrequently connected, isolated freshwater pools...46
(2) Highly connected, in-stream pools...47
(3) Pools with frequent marine and freshwater connections...48
(4) Pools with infrequent marine and freshwater connections...50
(5) Pool with infrequent marine but frequent freshwater connections...52
CONCLUSIONS...54
Chapter 4:...56
The Influence of Connectivity on Patterns of Composition and Density of Fish from Fitzroy Wetland Pools...56
Summary...56
Introduction...56
Methods...57
Sampling Gears...59
Cast net Sampling Methods and Protocols...62
Data and Statistical Analyses...63
Results...63
Species Richness...65
Patterns in Fish Composition and Density...66
Categorisation of Pools Based on Contributions of Marine and Freshwater Spawners...71
Influence of Pool Connectivity on Faunal Composition and Change...72
Discussion...76
Patterns of Diversity...76
7
Connectivity and Patterns of Faunal Change...77
Conclusion...80
Chapter 5:...82
Size Structures and Biomasses of Fish from Fitzroy Wetland Pools...82
Introduction...82 Methods...82 Size...83 Biomass...83 Results...85 Size...85 Biomass...90 Discussion...100
Trophic Dominance...100
Beyond Overall Dominance...101
Connectivity...102
Chapter 6:...104
Densities and Trophic Roles of Invetebrate Fauna of Fitzroy Wetland Pools...104
Introduction...104
Methods...104
Results...107
Taxonomic Composition...107
Trophic Composition...111
Discussion...112
Taxonomic Composition...112
Trophic Roles...115
Chapter 7:...117
Diets of Fish from Fitzroy Wetland Pools...117
Introduction...117
Methods...117
Statistical analysis...119
Results...120
General Diet...120
Dietary Details from Stomach Content Analysis...121
Details of the Diets on Phyto-detritivores from Centrifuge Separation...124
Chapter 8:...127
Trophic Support of Fitzroy Wetland Pool Ecosystems...127
Introduction...127
Methods...127
Stable isotope signatures:...127
Statistical analysis:...129
Assumptions...130
Results...131
Producer stable isotope profiles:...131
Isotope signatures of decomposed plant material:...131
Temporal variation in isotope signatures:...133
General patterns in isotope signatures:...134
IsoSource Models...138
IsoSource models of producer importance to primary consumers...142
Summary of producer importance to primary consumers...160
Discussion...163
The bases of pool food webs: isotope signatures of primary consumers...163
Implications...167
Chapter 9:...168
Food Webs of Fitzroy Estuarine Floodplain Wetland Pools...168
Introduction...168
Results and Discussion...168
The Basic Food Web...168
Scenario 1: Saline pools with regular connections to the Fitzroy estuary...170
Scenario 2: Brackish pools with irregular connections to the Fitzroy estuary...171
Scenario 3: Isolated freshwater pools with high water levels...172
Scenario 4: Isolated freshwater pools with low water levels...173
Implications and Uncertainties...174
Chapter 10...175
Spatio-Temporal Patterns of Fish Condition...175
Summary...175
Introduction...175
Aims...177
Methods...177
9
Sampling...177
Statistical analysis...180
Results...180
Spatial and Temporal variation in Mean Liver Lipid Vacuole Area per section...180
Sample Sizes needed to detect changes in Lipid Vacuole Area per section...184
Discussion...185
Variation in Biochemical Condition of Fish in Fitzroy Wetland Pools...185
Usefulness of Biochemical Condition as a Tool for Detecting Adverse Faunal Change...186
Conclusion...187
Chapter 11:...189
Within-Pool Distribution of Aquatic Vertebrates...189
Introduction...189
Methods...190
Sampling gear...190
Sampling design...191
Statistical analysis...192
Results...193
Frogmore Lagoon...193
Woolwash Lagoon...197
12 Mile Brackish pool...198
Munduran Saline pool...198
Gonong Saline pool...199
Summary of spatial factors influencing distribution and revised distribution models...200
Discussion...202
Conceptual models of fish distribution in floodplain pools:...204
Species other than Nematolosa erebi (Fig. 11.17):...205
Nematolosa erebi (Fig. 11.18):...205
Pools with a species mix that includes N. erebi (Fig. 11.19):...206
Chapter 12:...208
Assessment of the role of bird predation on fish assemblages within floodplain wetlands of the lower Fitzroy River...208
Introduction...208
Literature Review...210
Methods...215
Pellet Collection...220
Analysis...220
Results...221
General...221
Population Ecology...224
Community Ecology...236
Fish Consumption Estimates...241
Discussion...247
General...247
Conceptual Model...250
Appendix 1: Pellet Collection...251
Chapter 13:...252
General Discussion...252
Important Features of the Fitzroy Wetland Pools...252
Connectivity...252
Trophic Functions...254
Conclusions & Implications...255
11
Non-technical summary
Coastal wetlands function as links between terrestrial and marine ecosystems throughout
the world. They have vibrant and diverse flora and fauna, and are crucial habitats for fish
and invertebrates, often providing critical nursery grounds and are major contributors of
nutrients to coastal systems. However, our present understanding of tropical and
sub-tropical estuarine floodplain wetlands is limited, particularly in sub-tropical and subsub-tropical
areas. This lack of understanding, together with their extensive ecological importance
and their value to so many user groups, makes detailed understanding of estuarine
floodplain wetlands an important research priority.
The delta of the Fitzroy River, in Central Queensland, has extensive wetlands clustered
around its large estuary system. Except during flooding, the aquatic environment of the
wetlands is restricted to a number of semi-permanent pools of varying types and sizes,
which are recognised as important nursery habitats for marine fish, such as barramundi.
Unfortunately, the way these habitats provide for juvenile fish, and how juvenile fish
interact with other animals and plants associated with the pools (as prey or predators) is
unknown. Similarly, there is no knowledge of how aquatic animals are influenced by the
type of pool environment (eg. marine or freshwater influenced), or how the compositions
and fates of pool inhabitants are influenced by the degree and regularity of connection to
other habitats.
Thus the current project aims to extend, broaden and refine our understanding by
investigating the influence of connectivity on faunal dynamics and food webs of Fitzroy
Estuarine Floodplain Wetland Pools.
The current study was conducted during a drought period, with no substantial wet season
flows during the project. This has two consequences: (1) the study is limited to wetland
pools, with little ability to generalise the results to the whole wetland, and (2) the results of
the study are not necessarily representative of the situation during wet years.
Methods
The project studied a variety of wetland pools, ranging from completely fresh pools to
hypersaline pools, from pools regularly connected to other habitats to those isolated
throughout the study, of sizes ranging from a few hundred metres long to pools a number
variety of sampling techniques were employed to gain a detailed understanding of the
organisms inhabiting the pools, and the patterns of biological connectivity among the
pools. Data were collected on abundances, biomasses and stable isotope compositions
(measures of position in the food chain) of fish and invertebrates; on fish sizes,
biochemical condition (as a measure of health), diets and spatial distributions; on
patterns of abundance of water birds; and on the physical environments of the pools and
their patterns of connectivities.
Results
Connectivity
The physical environment of the Fitzroy Estuarine Floodplain Wetland Pools and the
extent of their physical connectivities are governed by rainfall and flooding regimes, the
length and nature of the connecting channels, whether the pools have direct connections
to the marine environment, and tidal anomalies that modify potential tidal connections.
Some pools are only connected to each other and to the main estuary system during
major floods, at intervals of years to tens of years. These isolated freshwater pools can
only provide productive habitats for aquatic fauna (including a nursery ground function for
marine species) if they are large enough to retain adequate water to support the aquatic
assemblage until the next physical connection event occurs. If connections don’t occur
frequently enough the pools dry out, with the last stages of drying out characterised by
fish kills as the shallow water becomes hot, muddy and inhospitable.
A second group of pools are connected a number of times a year by local rainfall. These
pools occur as components of defined creek systems, and their regular connection
allows passage to both upstream and downstream movements of fauna. This is
important in allowing recolonisation of pools that have dried out, in providing access to
marine spawning species moving upstream into nursery or feeding habitats, and in
allowing freshwater species to recolonise brackish pools where conditions may be
unsuitable for reproduction. These species (such as the freshwater bony bream) can be
dominant components of the community of brackish pools.
A third group of pools is never threatened with drying out because they are reasonably
deep and have regular connections to the marine environment on high spring tides.
These pools have a fauna dominated by marine species. Although there are many spring
13
many cases expected connections do not result or connections occur when predicted
tides are below “normal” connection levels. This is due to tidal anomalies; the
modification of tidal heights caused by factors like increases in air pressure depressing
water levels or strong winds blowing down long river reaches slowing the progress of
tidal currents.
A final group of pools is shallow and only connected during a few of the largest tides
each year. These pools are not part of stream systems, and like the isolated freshwater
pools saw very little freshwater input during the study. As a result these pools dried out
quickly, but because they contained salt water, evaporation quickly produced very
hypersaline conditions, making them inhospitable to most species long before they dried
out.
The timing of connections is crucial for the successful use of the pools as nurseries for
marine fish. Marine fish generally spawn at particular times of the year. Their larvae live
and grow in the upper levels of estuarine and coastal waters for only a few weeks before
they need to move into appropriate juvenile habitats (termed recruitment). Consequently,
they are available to enter pools for only part of the year, so if physical connections do
not occur at these times no biological connection can result.
While fish rely on aquatic connections to facilitate their movements between pools, and
to and from the estuary, fish-eating water birds to not suffer this restriction. Water birds
are able to fly between pools, producing biological connections independent of physical
connections. This action of birds connecting pools across the whole floodplain has far
reaching consequences for both the birds and the fish they feed on. Predatory birds are
particularly effective at feeding on fish when water depths become very shallow (around
1m or less). Being able to fly between pools that reach these shallow depths at different
times, means the birds are regularly able to find abundant supplies of fish that are easy
to catch. In this way, as a connected unit, the wetland pools support large populations of
water birds. At the same time, the movement of birds to feed in pools at times when the
fish become vulnerable has a considerable impact on patterns of mortality of fish in the
pools. Small, open water fish (like bony bream), that are the dominant species when
pools are full, are more susceptible to attack by birds than larger bottom feeding fish
(such as catfish). So when pools become shallow, preferential feeding on the smaller
species can lead to profound changes in the fish community (ie. change in dominance by
detritus feeders [bony bream] to dominance by omnivores [catfish]). This results a major
changes in function can not be redressed until the pools are reconnected to another pool
from which the detritivore population can be replenished.
Faunal Composition
The animals of the Fitzroy Estuarine Floodplain Wetland Pools are similar to those
occurring in nearby freshwater and marine habitats. Fifty-eight species of birds use the
pools, including species that are strictly water birds (56) and birds such as kites that feed
on fish in the pools. Other species of birds are closely associated with bank-side
vegetation, most notably the Yellow Chat (Epthianura crocea macgregori), a critically
endangered species only recently re-recorded from the Fitzroy floodplain. Forty-six
species of fish were recorded from the pools. Pools that are regularly connected to the
estuary (saline pools) had the greatest diversity of fish with a maximum of 25 species,
while freshwater pools had less species with a maximum of 16 species. The fish fauna of
saline pools is similar to that found in estuaries in the regions, with numbers and biomass
both dominated by detritus feeders, principally mullet. Freshwater pools also had fish
species mixes similar to those in other coastal freshwater systems, with numbers again
dominated by detritus feeders but in this case freshwater bony bream. The one truly
brackish pool, in the lower reaches of 12 Mile Creek, had a mixed fauna of fresh and
marine derived species. Here the fauna was again dominated by detritivors, with both
mullet and bony bream common. Invertebrate faunas again reflected pool type, with
freshwater faunas composed of freshwater insects, crustaceans and molluscs, and
marine faunas comprising mainly marine polychaete worms, crustaceans and molluscs.
Faunal Composition and Connectivity
The Fitzroy Estuarine Floodplain Wetland Pools provide a diverse range of
environments, harbouring a variety of plant and animal communities. Patterns of
connectivity determine the natures of the pools and the natures of their faunas. Highly
connected pools have extensive marine derived fauna and exchange those faunal
components during connection events.
Saline pools with regular connections to the main estuary have salinities close to
seawater and have communities dominated by marine fish and invertebrates, while pools
with little or no direct connection to the estuary contain predominantly freshwater
species. Between these, brackish pools, with regular connections to both fresh and
15
The size structures of fish in the pools reflect time since connection. Only large marine
spawned fish are found in large, isolated freshwater pools without recent marine
connections, while young individuals of marine spawned species occur in saline,
brackish and freshwater pools whenever recent connections coincided with the
availability of young juveniles in the Fitzroy estuary. Similarly, although bony bream were
abundant in the brackish 12 Mile Creek pool, they apparently did not breed there, with
small individuals only present after connection to upstream freshwater pools.
Trophic Roles of Fish and Invertebrates
Detritus feeding fish dominated communities in all pools. These were predominantly
mullet and bony bream. One marine spawning species, the spot-banded scat, fed
principally on plant material. A number of predators such as barramundi and giant
herring, which fed extensively on fish, were collected but these only occurred in
abundance in the 12 Mile Creek brackish pool. Omnivores, mainly forktail catfish, were
the only other common group in freshwater pools, contributing a substantial biomass in
large isolated pools like Frogmore Lagoon. Feeders on sediment dwelling invertebrates,
like the silverbiddy were only common in the saline pools. Unlike fish assemblages that
were consistently dominated by detritus feeders, the trophic composition of invertebrate
assemblages was different for freshwater and saline pools. The invertebrates of saline
pools were mainly omnivores while freshwater pools were dominated by plant and
detritus feeders.
Food Web Structure
This section is incomplete at present because of technical difficulties with stable isotope
analysis equipment.
Within-Pool Distribution of Aquatic Vertebrates
In pools with water depths exceeding 1.5m tortoises (Emydura krefftii) and most fish
were more abundant in shallow water along the edges of the pools, following the
distribution pattern expected from previous studies of tropical systems. In contrast to
other species bony bream, the dominant freshwater fish, showed a clear preference for
deeper parts of the pools. Marked changes in abundance of bony bream when water
depths became shallow enough to advantage feeding by predatory birds, such as
pelicans, suggests that bony bream preferentially use of deep water to reduce bird
abundance, and therefore importance, may have been greatly underestimated in
previous studies that have restricted sampling to pool edges. Fish tended to be
distributed more haphazardly in pools with maximum depths less than about 1.5m.
Fish Condition
Stores of fat in the livers of fish were monitored as indicators of sub-lethal changes in the
health of fish in the pools. Even though the Fitzroy Pools represent an eclectic group of
environments, differing in salinity regime, physical connectivity, location and
environmental setting, there was no indication of systematic variation in levels of fat
stores between sites but a consistent pattern of season-related temporal changes.
Evaluation of lipid vacuole area suggests it has the potential to be a sensitive indicator of
fish nutritional status, with the potential for development into a useful index of sub-lethal
impacts on fish health.
Conclusions & Implications
Fitzroy Estuarine Floodplain Wetland Pools provide a diversity of special and often
unique habitats, with each class of pool harbouring a particular fauna reflecting its salinity
and connectivity regimes. Pools vary in the duration that they provide hospitable habitats
for fauna, and when isolated for too long develop adverse conditions and eventually dry
out. Different classes of wetland pools are functionally different and each provides
different outcomes for its fauna. Together these factors mean that different pool types
are not ecologically interchangeable: the loss of any one pool is likely to be much more
important than suggested by the fraction of the total number of pools or the total pool
area it represents.
Wetland Pool habitats are fragile; their unique characters are determined by small
difference in height relative to tidal levels and by specific climatic patterns. But small
changes in tidal levels or climate are likely to significantly change the nature of the pools
and their quality as habitats. More extreme weather patterns will lead to more infrequent
and unpredictable connectivites, resulting in a greater number and variety of pools
moving to the point of ecosystem collapse. Consequently, global warming-induced
climate change and sea-level rise are likely to profoundly influence the total area of pools
available, the natures of individual pools and their quality as habitats. These changes will
not just compromise species directly utilising the pools but will flow on to effect coastal
and offshore ecosystems that are linked to the wetlands by the movement of organisms,
17
The complexities of biological connectivity need to be factored in to our understanding if
we are to successfully manage the effects of future climate and sea level changes.
Careful management of habitat loss and rehabilitation of degraded pools is crucial to
prevent further loss of ecological function in the face of climate change and adverse
Chapter 1
Introduction
Marcus SheavesLittoral wetlands occur adjacent to marine coasts and estuaries throughout the world,
and function as links between terrestrial and marine ecosystems (Levin et al. 2001).
These wetlands comprise temporarily flooded lowlands, “swampy” palustrine habitats
(Kingsford & Norman 2002), and permanent and semi-permanent pools, lakes and
lagoons (Allanson & Whitfield 1983). Littoral wetlands have vibrant and diverse flora and
fauna, and are crucial habitats for fish (Brown et al. 2005, Noble et al. 2004), birds
(Kingsford & Norman 2002, Noble et al. 2004) and invertebrates (Castellanos & Rozas
2001). In particular, they are often critical nursery grounds for fish and invertebrates
(Secor & Rooker 2005), and major contributors of nutrients and pollutants to coastal
systems (Caddy 2000).
Littoral wetlands are of substantial value to commercial, traditional and recreational
fishers, both in terms of exploitable fish stocks they contain (Barbier & Strand 1998,
Paterson & Whitfield 2000, Ley et al. 2002) and their nursery ground value (Secor &
Rooker 2005). Above and beyond their fisheries values, littoral wetlands are highly
valued by many elements of the community. They often have considerable traditional
value (Anon 2004), are used substantially by a diversity of groups including birdwatchers
and eco-tour operators, and are highly valued by a diversity of members of the
community (eg. artists, photographers) for their aesthetic beauty (Anon 2005).
Additionally, the dwindling area of littoral wetlands confers considerable conservation
value on them (Barbier et al. 2002).
Nursery-Ground Function of Littoral wetlands
Littoral wetlands are widely recognised as nursery grounds for a variety of fish
(Russell & Garrett 1988, Laffaille et al. 2000) and crustaceans (Achuthankutty 1988,
Sheridan & Hays 2003), but nursery ground value is incompletely understood (Sheaves
2001, 2005). While relatively few fish that use wetlands are obligatory users (Secor &
19
Advantages flowing from abundant food supplies (Javonillo et al. 1997) and/or reduced
predation (Paterson & Whitfiled 2000) lead to enhanced storage pools of energy and
genetic material. These ultimately lead to more productive and less variable adult stocks
than would otherwise be the case (Kraux & Secor 2005). The importance of the
utilisation of nursery habitats to marine fish populations is underlined by the fact that,
across a broad range of ecosystems, patterns of abundance of juveniles in nursery
habitats is a reliable predictor of abundance of adults in adult habitats in subsequent
years (Kraux & Secor 2005). Conversely, adult abundance is generally a poor predictor
of juvenile abundance, emphasising that factors influencing the entry to and successful
use of juvenile habitats are more important to future spawning stocks than are previous
patterns of spawning.
Species that utilise temporary littoral wetlands are themselves special. They can be
seen in one sense as generalists, able to thrive in and utilise a diversity of conditions
(Gelwick et al. 2001), and in another as specialists, that require great phenotypic
plasticity (Ray 2005) to prosper under a diversity of environmental regimes.
A crucial factor in nursery ground value is the availability of suitable habitat. Although
some organisms are habitat specialists (Davis et al. 1995, Nagelkerken & Velde 2002),
many can utilise a variety of habitats (Ray 2005). However, even these species require
habitat type and condition to be within acceptable ranges (Halpern 2004). Even in open
systems, the condition and extent of necessary habitats vary greatly between years, and
may become critically restricted (Niklitschek & Secor 2005). The situation is even more
variable for closed systems, where the inability to move to a new area means that the
loss of a particular habitat from the system can have far reaching effects for a variety of
species (Bloomfield & Gillanders 2005).
As well as nursery ground value varying in space and time (Kraux & Secor 2005),
utilisation of habitats by juveniles is also variable (Able 2005). This reflects the interaction
of larval supply and habitat availability in determining location-specific juvenile
abundance (Brown et al. 2005). Consequently, the degree of connectivity and integrity of
connections among habitats, and between wetland units and sources of larval supply, is
of overriding importance to nursery ground value because both habitat availability and
larval supply are determined by connectivity (Chabrerie et al. 2001, McCormick-Ray
2005). Larval and juvenile aquatic and marine animals can not occupy a habitat that is
In fact, larvae and/or juveniles cannot be supplied to a habitat without connection at the
specific time when the larvae and/or juveniles are available (Brown et al. 2005).
The importance of habitat availability and the needs for appropriate connectivity to
enable habitat occupancy are obvious. Just as obvious is that the widespread
occurrence of habitat modification (Ferrer Montano 1994, Vose & Bell 1994, Blaber
1999) and restriction and removal of connectivity (Hyland 2002, Kraux & Secor 2005)
has the potential for substantial impacts on the distribution and dynamics of fish and
other fauna (Noble et al.2004). Conversely, land management plans that restore
connectivity and rehabilitate habitats are important in protecting biodiversity and restoring
whole-of-ecosystem function (De Freese 1995). Additionally, restoring connectivity can
advantage endangered species (Tanner et al. 2002) and lead to expanded diversity of
life-history variation (Bottom 2005) leading ultimately to more resilient ecosystems
(D’Eon et al. 2002). Ensuring that ecosystem resilience is maximised is a pressing issue,
given speed of habitat and connectivity loss and modification is accelerating in response
to human-induced climate change and sea level increase (Kingsford & Norman 2002).
The Relationship between Water Bird Populations and Nursery-Ground
Function of Littoral Wetlands
Piscivorous birds benefit from foraging over large areas (Alexander 2002) and
depend on access to wetlands that are healthy fish habitats (Noble et al. 2004). In fact,
many waterbirds respond to newly generated wetland habitats to feed and/or breed
(Kingsford & Norman 2002), then disperse or die as wetlands dry up. In fact, predatory
birds are advantaged by cycles of filling and drying of wetland pools, with birds moving to
take advantage of pools (Timms 2001)as they become shallow enough for effective
feeding (Roshier et al. 2002). This advantage to piscivorous birds feeds-back to influence
nursery ground value, with predatory birds visiting substantial mortality on small and
juvenile fish in wetlands (Whitfied & Blaber 1978, Miranda & Collazo 1997). Because of
the importance of wetlands to water birds their loss is a major threat to bird populations
(Kingsford & Norman 2002), and their numbers and diversity are closely linked to
21
Littoral Wetlands and Nutrients and Pollutants
Because most pathways of transport of nutrients and pollutants pass through them,
littoral wetlands play a crucial role in the movement of nutrients between catchments and
the sea. Understanding this role is particularly important in the current climate of
increasing loads of suspended sediments, nutrients and pollutants (Brodie & Mitchell
2005). Depending largely on the strength of flow (Brodie & Mitchell 2005) (eg. wet
season versus dry season), a variable proportion of the nutrients and pollutants
generated in the catchment are trapped in wetlands (Thimdee et al. 2003). There they
may be stored for long periods (Boto et al. 1989, Alongi et al. 2000a, Thimdee et al.
2003), modified (Davis et al. 2001a), controlled (Davis et al. 2001b) or passed rapidly
onwards (Brodie & Mitchell 2005). For instance, large quantities of nutrients may be
converted to mangrove biomass and trapped in mangrove forests (Cebrian 2002) or
pollutants removed water and stored in wetland plants such as reeds (Hosoi et al. 1998).
At the same time, wetlands themselves generate large amounts of organic carbon
(Jennerjahn & Ittekkot 2002, Alongi et al. 2004), and can be substantial contributors of
nutrients and pollutants to coastal systems (Machiwa & Hallberg 2002, Caddy 2000).
Depending on the type of wetland (Clarke 1985, Mohammed et al. 2001) and its
geographical setting (Alongi et al. 2000a, Dittmar & Lara 2001) this carbon may be
retained in the wetland by recycling (Cebrian 2002) or passed onwards (Alongi et al.
1998). Thus littoral wetlands can trap nutrients and pollutants, and/or slow, modify or
promote their flows between ecosystems.
The movement of nutrients and pollutants through wetlands is generally thought of in
terms of physical transport as dissolved or particulate material (Thimdee et al. 2003,
Brodie & Mitchell 2005). However, wetland organisms play crucial roles in nutrient
recycling (Alongi et al. 2000b), nutrient accumulation (Alongi et al. 2000a, Cebrian 2002),
nutrient regeneration (Dham et al. 2002), and nutrient transport (Javonillo et al. 1997,
Deegan 1993), which may be as great as that of physical processes (Deegan 1993). Our
incomplete understanding of these biologically mediated flows is a reflection of our
general lack of recognition of the importance of biological connectivities (Sheaves 2005).
Fitzroy Estuarine Floodplain Wetland Pools
The Fitzroy River is the largest coastal river system in central and southern
Queensland, draining a catchment of more than 140,000 square kilometres. It has an
in 1970 to prevent ingress of saltwater to areas further upstream (Kowarsky & Ross
1981). The barrage is located at the city of Rockhampton, the major centre in the region.
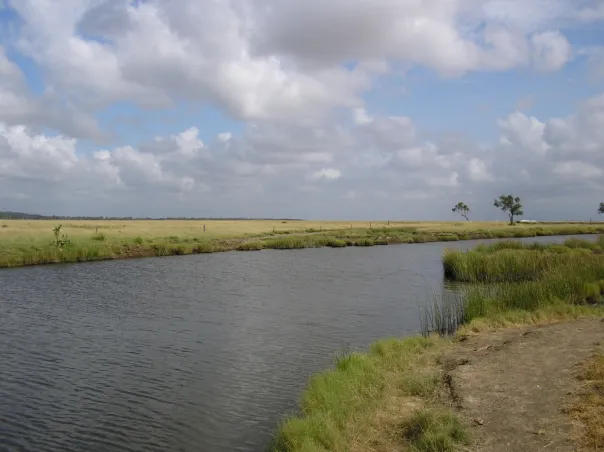
At the mouth of the estuary is an extensive delta system surrounded by a broad
floodplain (Fig. 2.1). Interspersed across the floodplain are a variety of wetland pools that
are the focus for this study. For the purposes of this study this particular subset of littoral
wetlands is termed “Fitzroy Estuarine Floodplain Wetland Pools” (see Chapter 2 for
definitions). These pools present a range of degrees of connectivity to each other and to
the Fitzroy estuary proper (see Chapters 2 & 3). During major floods the floodplain may
become covered with water, producing an extensive area of nursery habitat for fish and
crustaceans. Once the floodwaters receed the floodplain wetlands contract, with the
pools representing persistent remnants of this wetland.
Littoral wetlands are recognised as important nursery habitats for juveniles of the
commercially and recreationally important fish, the barramundi, Lates calcarifer, (Russell
& Garratt 1983, 1985, 1988), prompting a series of studies into importance of Fitzroy
Estuarine Floodplain Wetland Pools to this species (Sawynok 1998, Infofish 2005,
Sawynok & Platten 2005).
User Needs
In the last five years there has been a shift from centralised management of natural
resources and environments of river catchments in Queensland, to management at a
local level. In 2000 the Fitzroy Basin Association (FBA), the community organisation
charged with coordinating this management, produced a strategy for sustainability (FBA
2000). The strategy identified river health and water quality as key regional issues, with
key strategy of developing planning and management measures to protect fisheries
habitats and ensure the maintenance of fish passage through the Fitzroy River system.
In response to the strategy, a number of studies were implemented to understand the
use of habitats in the system by recreationally and commercially important species,
principally barramundi. These studies include habitat utilisation by barramundi and
evaluation of relative habitat quality (Infofish 2005), barramundi spawning and
recruitment (Sawynok & Platten 2005), and establishing the relationship between
freshwater flows and barramundi production (Robins et al. in progress). These first two
projects, supported by the Coastal CRC, identified Fitzroy Estuarine Floodplain Wetland
sup-23
project, has linked barramundi recruitment pulses with freshwater flow events, implicating
wetlands as important in underpinning fisheries production. These studies also build on
the studies of the use of ponded pastures in the region by barramundi (Hyland 2002).
While these studies represent a broad range of necessary work relating to the
barramundi themselves, there is very little understanding of the functioning of the Fitzroy
Estuarine Floodplain Wetland Pools in particular, or indeed littoral wetlands in general. In
particular, there is essentially no understanding of the faunal dynamics of littoral wetland
pools or of the trophic webs supporting nursery ground function and productivity.
Aims:
At present our understanding estuarine floodplain wetlands is limited, particularly in
tropical and subtropical areas. Most previous research in coastal northern Australia has
focussed on purely estuarine (eg. Blaber et al. 1989, Sheaves 2001) or freshwater (eg.
Pusey et al 2000) systems and then mainly on moving waters. This lack of
understanding, their extensive ecological importance and their value to so many user
groups, makes detailed understanding of estuarine floodplain wetland pools an important
research priority. Thus the current project aims to extend and broaden our understanding
by investigating the faunal dynamics and food webs of Fitzroy Estuarine Floodplain
Wetland Pools, and the influence of connectivity on faunal dynamics and foodwebs.
In particular, the project investigates the natures and connectivities of Fitzroy Wetland
Pools (Chapter 3), the influence of connectivity on densities (Chapter 4) and biomasses
(Chapter 5) of fish, the densities of invertebrates (Chapter 6), the diets of fish (Chapter
7), stable isotope profiles of fauna and flora (Chapter 8), the structure of food webs
(Chapter 9), the health and condition of fish (Chapter 10), the spatial distribution of fish
within pools (Chapter 11), the spatial and temporal abundance of waterbirds (Chapter
12).
The current study was conducted during a drought period, with no substantial wet
season flows during the project. This has two consequences: (1) the study is limited to
wetland pools, with little ability to generalise the results to the whole wetland, and (2) the
Chapter 2
Physical Nature of Fitzroy Floodplain Wetland Pools
Marcus Sheaves and Ross JohnstonSummary
Floodplain Wetland Pools were defined as water bodies on the floodplain of the
Fitzroy River, adjacent to, and intermittently connected with, the Fitzroy River
estuary or other major estuarine channels forming the Fitzroy River delta.
Study pools were selected to cover the Fitzroy floodplain as representatively as
possible.
Pool environments ranged from entirely freshwater, through low salinity brackish and
fully marine to hypersaline.
Pools varied in the periodicity of connection to the marine environment and to
upstream freshwaters.
Pools varied in the duration they retained water.
Some pools were isolated while others comprised upstream series within stream
systems.
Study Sites
Pool Definition
For the purposes of these studies Estuarine Floodplain Wetland Poolsare defined
as: Water bodies on a coastal floodplain, adjacent to, and intermittently connected with
an estuary or estuarine system.
Fitzroy Estuarine Floodplain Wetland Pools are specifically defined as: Water bodies on the floodplain of the Fitzroy River, adjacent to, and intermittently connected to,
the Fitzroy River estuary or other major estuarine channels forming the Fitzroy River
delta. For brevity this will usually be shortened to Floodplain Wetland Pools or simply
25
To comply with the definition of the pools’ locations as “adjacent to the estuary”, the
investigation was limited to pools downstream of the Fitzroy River Barrage, which marks
the upper limit of the estuary. Defining pools as “intermittently connected” led to the
inclusion of pools from those only cut off from the estuary at low tide to freshwater pools
with no tidal connection.
Because only one highly connected marine pool could be found directly adjacent to
the Fitzroy River delta, the study was extended to include Munduran Creek. Although not
part of the Fitzroy River delta, Munduran Creek enters the mid section of Narrows, which
connects the Fitzroy River delta with Port Curtis. Munduran Creek also includes a
number of freshwater pools, so, as well as providing spatial replication of a highly
connected marine pool, including Munduran Creek provided the opportunity to study a
connected series of pools ranging from marine to fully fresh in the one system.
Selection Criteria
The primary aim was to select sites comprising a broad representation of pool types
and levels of physical connectivity. Ideally, the pools selected would include:
Multiple pools in individual streams forming upstream series
Pools with a broad range of salinity profiles
Pools with different levels of physical connectivity
Pools that retain water for different durations
Multiple pools of each type to provide spatial replication of pool type
A spread of pools that covers the floodplain representatively
Pools that could be accessed reliably, considering physical impediments to access
(road conditions, stream depth etc.) and willingness of owners
Pools without major human-constructed impediments (dams, bund walls etc.) likely to
Site Selection
Potential study sites were identified from aerial imagery and topographic maps. Sites
were inspected and evaluated during a two week field trip in November 2003. Local
knowledge and site advice were provided by Bob Packet from DNR & M, and Bill
Sawynok from InfoFish.
Study Sites
Although aerial imagery (Fig. 2.1) and topographic maps suggested many potential
sites, on-ground surveys showed that most sites were unsuitable under criterion 8
(above). Unreliable accessibility (criterion 7) eliminated many other potential sites, while
others, such as Big German Jack’s Lagoon, held no water or were unhospitable to life
(extreme salinity and/or temperature) at the beginning of the study. Initially, 5 primary
sites were selected: Frogmore Lagoon (Figs. 2.1, 2.2), 12 Mile Creek Brackish pool
(Figs. 2.1, 2.3), 12 Mile Creek Upstream Fresh pool (Figs. 2.1, 2.3), Munduran Creek
Brackish pool (sampled from February 2004 to May 2005) (Figs. 2.1, 2.4), and Munduran
Creek Downstream freshwater pool (Figs. 2.1, 2.4). Subsequent to the initial sampling
trip in February 2004, during which sampling protocols were tested and refined, 6
additional sites were added. These were; Munduran Upstream freshwater pool (Figs. 2.1,
Freshwater pool (Figs. 2.1, 2.3) (sampled from May 2004 onwards), Big German Jack’s
Lagoon (Figs. 2.1, 2.6), Little German Jack’s Lagoon (Figs. 2.1, 2.6) (sampled from
November 2004 onwards), and Woolwash Lagoon (Figs. 2.1, 2.2) (sampled during
August 04, February 2005 and May 2005).
To extend the range of stable isotope data, samples were collected from two
additional sites during December 2004, Blacks Lagoon, a large freshwater pool on
Raglan Creek in the southeast of the Fitzroy floodplain (Fig. 2.1) and Munduran Snake
Pool, upstream of Munduaran Creek Upstream pool (Figs. 2.1, 2.4).
Pool Descriptions
Descriptions of the pools’ settings and habitat types were developed from in-field
observations. Records of patterns of stream flow, kept by Government agencies, did not
wetland pools. As a consequence, information from local landholders and other key
stakeholders, was married with observations from the research team and the local
knowledge of Bob Packet (DNR & M) and Bill Sawynok (InfoFish), to develop an
approximate classification of regularity of connection for each study site (Table 2.1). No
definitive detail on regularity of tidal connection to the Fitzroy River estuary is provided
here because empirical studies showed a low level of concordance between actual
connections and predicted tidal heights. This issue is covered in detail in chapter 3.
Frogmore and Woolwash Lagoons
Frogmore and Woolwash Lagoons are freshwater pools situated some 3km from the
upper Fitzroy estuary (Fig. 2.2). At their maximum non-flood levels both pools are
approximately 2km in length and, for most of their lengths, approximately 80 m wide.
During the study period the maximum depths of Frogmore and Woolwash Lagoons were
4.7m and 2.8m respectively (Table 2.1). Both pools have moderately sloping
cross-sectional profiles (Fig. 2.7). The pools are usually separate entities but are connected via
a narrow channel during major flooding (Fig. 2.2). Both pools form upstream connections
to Yeppen Yeppen swamp during major floods, but more often receive water from the
31
Creek system, a side-branch of the Fitzroy River. Even this connection is intermittent,
with no connection to Gavial Creek during the study period. Information from local land
holders suggests the pools only connect to Gavial Creek with a periodicity of around 5-10
years (Table 2.1).
Both Frogmore and Woolwash Lagoons are situated in extensively cleared pastoral
land, with cattle grazing to the pool edges. However, while Frogmore is completely
surrounded by grazing land, Woolwash is bordered by a sealed road on its eastern side.
interspersed with large Eucalyptus and Melaluca trees. Neither pool contains any
macroscopic aquatic vegetation.
12 Mile Creek
Twelve Mile Creek is situated to the south of Casuarina Creek, a major estuarine
component of the Fitzroy River delta (Fig. 2.1), and connects to the upper reaches of
Inkerman Creek, another estuarine component of the Fitzroy delta. During the study
period, Twelve Mile Creek flowed two to four times a year as a result of local rainfall in its
catchment. Substantial flow from these events persisted for no more than a week on any
occasion. Between these times 12 Mile Creek contracted to a series of separate pools,
the lower 3 of which were used as study sites (Fig. 2.3).
The most downstream pool (12 Mile Brackish) is bordered on its northern side by
pasture and on its southern side by a habitat reclamation area, of previously grazed land
now, from which cattle are now excluded. There are few mature trees adjacent to the
pool, although a number of saplings are established in the reclamation area. Salt couch,
Sporobolis virginicus, and sedges line the bank but there is no macroscopic aquatic
vegetation. Twelve Mile Brackish is situated on the landward edge of a saltpan adjacent
to Inkerman Creek and, during the highest spring tides, is connected to Inkeraman Creek
across some 2½km of saltpan. When full, the pool is some 800m in length 10-15m wide
for most of its length, with a maximum depth of 4.3m (Table 2.1). The occasional
connections to Inkerman Creek maintained hyposaline conditions in the pool throughout
the study.
The pool immediately upstream of 12 Mile Brackish (12 Mile Downstream) is
separated from the brackish pool by a low concrete weir (30cm above the normal “full”
level of the brackish pool) that prevents egress of salt water, but which is quickly
overtopped during freshwater stream flow. The Twelve Mile Downstream pool is some 1
km long and 5-7m wide for most of its length, and had a maximum depth of 3m during
the study. The pool is bordered by pasture on its northern bank, and Euclayptus forest on
its southern bank (Table 2.1), and contained extensive areas of water lilies, Nymphaea
spp. and the invasive aquatic plant, Cabomba caroliniana.
Immediately upstream of 12 Mile Downstream, and separated by a causeway, is the
second 12 Mile Creek freshwater study site (12 Mile Upstream). Twelve Mile Upstream is
some 330m in length, 2-5m wide and had a maximum depth of 4m during the study
33
scattered Euclayptus trees on its northern bank, and contained extensive areas of water
lilies, Nymphaea spp. and the invasive aquatic plant, Cabomba caroliniana.
Munduran Creek
Munduran Creek is situated to the south of the Fitzroy River delta (Fig. 2.1) and flows
into the Narrows, the body of water connecting the Fitzroy River estuary with Port Curtis.
The upstream section of the Munduarn Creek estuary contains a series of lateral rock
bars forming natural impoundments, the most upstream of which is only overtopped by
the highest spring tides (Fig. 2.4). The pool formed by this natural barrier (Munduran
saline) is approximately 350m long, about 18m in width at its widest point, and has a
maximum depth of 1.8m. Munduran saline is surrounded by state forest (lightly grazed)
and has a narrow mangrove border (primarily Aegiceris corniculatum, Rhizophora
stylosa, and Avicennia marina) interspersed with grasses and Eucalyptus woodland
(Table 2.1). Except during stream flow events (2-5 times per year), the upper end of the
pool is separated from freshwater sections of Munduran Creek by a further rock bar and
a lightly forested dry stream channel. Munduran saline has an erosional/depositional
cross-sectional profile (Fig. 2.7).
Except during stream flow events, the freshwater section of Munduran comprises a
series of pools surrounded by Eucalyptus woodland. When full of water, the most
downstream of these (Munduran Downstream) fills the stream channel, and is some 60m
in length and 20m in width. It has gently sloping sides and a maximum depth of 2.1m.
Munduran Fresh has extensive areas of aquatic vegetation, principally water lilies,
Nymphaea spp.. Munduran Downstream has a shallowly sloping cross-sectional profile
(Fig. 2.7). Munduran Upstream is similar but of greater length (120m) with an
erosional/depositional cross-sectional profile (Fig. 2.7).
A further 0.5km upstream is the “Snake Pool”. The Snake Pool is a steep-sided,
freshwater pool, about 300m in length and 10m in width and surrounded by native
woodland designated as State Forest. Snake Pool has a steep sided basin
cross-sectional profile (Fig. 2.7).
Gonong Creek
Gonong Creek is at the upstream extremity of Connor Creek, the most southern
major estuarine branch of the Fitzroy delta (Fig. 2.1). At the upstream end of the Gonong
and gravel bar some 50m long. As with Munduran saline, Gonong saline is only
connected with the estuary by the highest spring tides (Fig. 2.5). The pool is
approximately 450m long, about 20m in width at its widest point, and has a maximum
depth of 2.1m. It is bordered on its eastern side by National Park and on its western side
by a forestry plantation (Table 2.1). Gonong saline has an intermittent mangrove border
(primarily Aegiceris corniculatum, Rhizophora stylosa, and Avicennia marina),
interspersed with native grasses. Except during stream flow events (2-5 times per year),
the upper end of the pool is separated from freshwater sections of Gonong Creek by
further gravel and rubble bars. There are no substantial permanent freshwater pools in
Gonong Creek. Gonong saline has an erosional/depositional cross-sectional profile (Fig.
2.7).
German Jack’s Lagoons
The German Jack’s wetland comprises 2 lagoons adjacent to the northern bank of the
middle Fitzroy estuary (Fig. 2.1). Neither lagoon has a connection to a defined freshwater
stream. The lagoons only receive substantial inputs of freshwater during major flooding
of the Fitzroy River. Both lagoons are connected with the Fitzroy River estuary only on
the few largest tides of the year. Neither pool contains permanent aquatic macrophytes.
The larger lagoon (Big German Jack’s) is bordered on its eastern side by Eucalyptus
woodland that is used as pasture for cattle and on its western side by saltmarsh,
dominated by the salt couch, Sporobilis virginicus. When full it is some 2km in length,
150m wide and about 0.7m maximum depth. The major connection with the Fitzroy River
estuary is through a shallow channel, approximately 500m in length, leading to an
unnamed side branch of the Fitzroy River (Fig. 2.6). Big German Jack’s has a shallowly
sloping cross-sectional profile (Fig. 2.7).
The smaller lagoon (Little German Jack’s) is surrounded by Sporobilis virginicus salt
marsh. It contains scattered mangroves (mainly Avicennia marina with a few Rhizophora
stylosa), particularly around its southern end. When full, Little German Jack’s is some
400m in length, 20m in width and 0.5m in depth. On the highest spring tides water flows
from a small channel adjacent to the southern end of Little German Jack’s, through about
15m of salt marsh and then into the pool (Fig. 2.6.). Under particularly high tidal
conditions water sheet flow enters the southeastern side of Little German Jack’s directly
from the Fitzroy River which is only some 30m from the pool at this point. Although very
shallow in depth, in the main Little German Jack’s has a steep-sided basin
35
Chapter 3
Dynamics of the Physical Environment of Fitzroy Wetland Pools
Marcus Sheaves and Ross JohnstonSummary
The study was conducted to gain an understanding of the physical environment of the
Fitzroy Wetland Pools and the physical connectivities between them.
This provides a basis for developing a understanding of biological connectivity.
Measurements of water quality parameters, pool and connection depths, and
analyses of aerial photography were used to investigate the pool environments
and connectivities.
The pools represent a spectrum of pool types from completely fresh to hypersaline.
They also range widely in their extent and periodicity of connectivity, from pools
connected a number of times a year to pools isolated for many years. The
physical environment of the pools and the extent of connectivity is governed by
rainfall and flooding regimes, the length and nature of the connecting channels,
whether the pools have direct connections to the marine environment, and tidal
anomalies that modify potential tidal connections.
The complexity of physical connectivity needs to be factored in to our understanding if
we are to successfully manage the effects of future climate and sea level
changes.
Introduction
The nature of the Fitzroy Wetland Pools investigated during the study was outlined in
from February 2004 until May 2005 to examine the nature and extent of physical
connectivity between the pools and between the pools and the Fitzroy River estuary.
At the beginning of the study the physical environments of the pools, and the nature
and extent of connectivity between them, was completely unknown. As a consequence, it
was necessary to undertake a descriptive study as a basis for understanding physical
and biological connectivity between the pools and for understanding the pools’ roles in
supporting their biota. The empirical understanding gained is used to generate specific
questions for more detailed investigations (Chapter 13).
Aim:
No consistent information was available on the physical nature of the study pools or
the connectivities between them. Consequently, physical data were collected to develop
a broad understanding of the physical nature of the pools, and the extent and periodicity
of connectivity between pools, and between the pools and the Fitzroy River estuary. This
broad understanding provides the context for understanding biological connectivity
(Chapter 4) and for developing the specific conceptual models tested in Chapter 13.
Methods
Nine pools, 12 Mile Brackish, Downstream and Upstream; Munduran Saline and
Downstream; Gonong Saline; Little German Jack’s; Frogmore; Woolwash, were selected
for detailed physical sampling.
The salinity, temperature, pH, turbidity and depth of each pool were measured on
each sampling occasion (February 2004, May 2004, July 2004, November 2004,
February 2005, May 2005), except when equipment failure prevented measurements. An
additional trip, to collect physical data, was conducted in December 2004 to match with
predicted extreme high tides (5.5m at Port Alma, 12-14 December (Seafarer Tides
2004)). Because pools could only be visited every 4 months, the regular cleaning
required to ensure continuous data loggers work effectively was not feasible.
Consequently, point sampling was used rather than continuous data logging. This
approach was considered adequate for the purposes of gaining a broad, initial
understanding of the physical natures of the pools and of connections between them. As
37
of conditions between those times relies on interpolation. Other variables such as DO2
were not measured because their high levels of temporal variability at multiple scales
would render point measurements uninformative.
Measurements of Water Quality Parameters:
Salinity and temperature were measured using a TPS WP-84
conductivity/salinity/temperature meter, and pH using a TPS WP-80 pH meter. Turbidity
was measured in NTU using an Analite 152 Nephelometer. This meter produced
unreliable data on a number of occasions, so only reliable turbidity data are included.
Measurements of Depth and Pool levels:
Depth profiles of each pool were recorded using a Lowrance LCX-18C Sonar and
Mapping GPS. This information was cross referenced to depth measurements made
manually at each cast netting location, on each sampling occasion. At the beginning of
the study a permanent survey peg, with a height datum mark, was placed on the edge of
each pool. The level of each pool relative to datum level was measured on each
sampling trip, using a laser level.
For each pool (except the 2 German Jack’s pools which could not be accessed until
November 2004 due to unfavourable conditions on the access road), the water level in
February 2004 was defined as the “full” level. This was an accurate description for pools
in 12 Mile Creek, Munduran Creek and Gonong Creek because heavy local storm rainfall
in the southern catchments of the Fitzroy floodplain during January and February 2004
produced flow in each system, filling all the pools. Frogmore and Woolwash lagoons
were disconnected from each other and from other systems throughout the study, so
levels fell throughout the study period. Consequently, for these pools the “full” level at the
beginning of the study provides a relative bench mark only. The situation in the two
German Jack’s pools is more complex. The only substantial inputs of water into these
pools during the study period came from connections to the Fitzroy estuary. However,
while the duration of these connections was sufficient to fill Little German Jack’s, they
were not of sufficient duration to fill Big German Jack’s. Consequently, while a “full” level
could be defined for Little German Jack’s, no similar definition could be made for Big
Connection depths:
To allow investigation of connection depths and timing between the estuary and each
of the marine and brackish pool, the end of each 7 day sampling trip was set to coincide
with the largest tides of the month. Simple depth recorders (Figs. 3.1, 3.2) were placed at
the connection point of each pool at the beginning of each sampling trip (ie. prior to the
largest tides) and the maximum depth the tide reached, relative to the pool depth datum,
measured each day. The depth recorders consisted of 30mm long vials attached
sequentially, along the length of a 2m long stake set vertically into the edge of the pool,
with the lowest vial at the pool surface. Each vial had two holes drilled into it, one hole at
the mid-point of the vial to allow water to enter and one just below the lip of the lid to let
air escape, so forestalling pressure build-up that might prevent water entering the lower
hole. Because the vials were attached sequentially every 30mm, connection depths were
automatically recorded to the nearest 30mm. Experiments prior to using the depth
recorders in the field showed they recorded depth accurately and were not influenced by
39
Results and Discussion
The Physical Environment
Salinity
Salinities at Frogmore, Woolwash, 12 Mile Downstream, 12 Mile Upstream and
Small inputs of estuarine water from Inkerman Creek balanced freshwater input from
local rainfall to maintain low salinities in 12 Mile Brackish (mainly 5-10l, except for
December 2004 when salinity fell to 0.7 l) until the final sampling trip in May 2005 when
substantial inflow from Inkerman Creek during extremely high tides caused salinities to
increase to 35l (Fig. 3.3).
Salinities in Munduran and Gonong saline pools tracked together throughout the
study (Fig. 3.3). Salinities in Munduran saline were close to zero in February 2004,
following extensive local flooding. Salinities in the two pools increased continually until
November 2004, due to repeated tidal connections. Local rainfall at the end of 2004 and
early 2005 reduced salinities to a measured minima of 6l in Gonong saline and 2l in
Munduran saline in February 2005. The extreme high tides in February 2005 led to
salinities increasing rapidly to around 40l. The high salinity levels reached in the 3
“brackish” pools in May 2005 seem anomalous, in that they are higher than normal
seawater salinities. However, these levels simply reflect the fact that the 3 systems
source their tidal waters from the upstream parts of dry sub-tropical estuaries that
typically maintain elevated salinities throughout most of the year (Ian Webster pers
41
When first measured in November 2004 the salinity was extremely high in Little
German Jack’s (130 l) (Fig. 3.3). Very low water levels indicated the high salinity was
due to evaporation during an extended period of disconnection from both fresh and
marine water. Local rainfall in November and December 2004 filled Little German Jack’s,
reducing salinity to 9l in February 2005. The extreme high tides in February 2005 led to
salinities increasing rapidly to around 55l, mirroring the changes in Munduran and
Gonong saline pools.
Overall there were 4 distinct patterns of salinity (Fig. 3.4): (1) constant freshwater
salinities in the Frogmore, Woolwash, 12 Mile Downstream, 12 Mile Upstream and
Munduran Fresh, the pools without direct connections to the estuary, (2) salinities
fluctuating between fresh and hypersaline levels in Gonong and Munduran saline, the
pools with regular connection to the estuary and regular inputs of fresh water from local
flooding, (3) low salinites for the majority of the time in 12 Mile Brackish, reflecting
regular inputs of fresh water from local flooding and restricted marine input from most
potential marine connections due to the large distance tides have to bridge to create
marine connectivity, (4) salinities fluctuating widely and reaching extreme levels in Little
from local rainfall) and marine water (short connection but at a high topographic level that
is only overtopped infrequently), and a very shallow depth allowing evaporation to rapidly
reduce water levels and increase salinity.
Temperature
Despite a strong pattern of seasonal change, water temperatures varied little among
sites at any time (Fig. 3.5). On aspect of the seasonal pattern is noteworthy;
temperatures in February and May 2005 were consistently 1-40C higher than those in
February and May 2004. Early in the study water (February & May 2005) temperatures in
the brackish sites tended to be slightly higher than in the fully fresh sites, however
difference became less distinct through the latter parts of 2004, and early 2005. Very
high temperatures in Little German Jack’s in November 2004 relate to a lack of inputs of
fresh or marine water, leading to extremely shallow water levels (29.5cm maximum
depth) and no input of cool water to moderate temperatures.
pH
pH showed a range of patterns through time. The low salinity 12 Mile brackish pool
43
of temporal change; levels becoming more alkaline through time but with a dip in
February 2005 (Fig. 3.6a). The 12 Mile Downstream pools initially had similar pH to 12
Mile Brackish but changed to be similar to 12 Mile Upsteam in November 2004 and
February 2005, before again converging with 12 Mile Brackish in 2005. pH levels at
Gonong saline and Munduran saline (Fig. 3.6b) were similar to those in 12 Mile Brackish
in February 2005 and, although they increased in May 2004, the increase was less
marked and not continued in July and November. While pH levels at Gonong saline
remained similar through May, July and November 2004, they became increasingly acid
at Munduran saline over the period. In a similar way to 12 Mile Creek, the pH at both
Munduran saline and Gonong saline fell in February 2005 before increasing to similar to
12 Mile Brackish in May 2005. pH at the highly saline German Jack’s Lagoon was only
measured in the last 3 months of the study but followed a similar pattern to that at
Gonong and Munduran, but at a more alkaline level (Fig. 3.6b). The pattern at Frogmore
Lagoon (Fig. 3.6c) was quite different to that at the other sites; starting at a more alkaline
level in February 2004 and continuing to increase until February 2005 before falling in
May 2005. Woolwash Lagoon showed even more alkaline pH levels, but these continued
to rise through to May 2005.
Turbidity
Turbidities (Fig. 3.7) were low to moderate at all sites throughout the study, with
highest turbidities in 12 Mile Brackish in February 2004. In field observations suggested
that turbidities were a simple reflection of the wind conditions over the days prior to
sampling. The levels of turbidity were much lower than those usually found in the Fitzroy
estuary (Phillip Ford pers com.).
Depth
The two saline pools, Gonong Saline and Munduran Saline were connected to their
estuaries regularly so maintained levels when disconnected that varied by only a few
centimetres. Gonong Saline had a maximum depth when disconnected of 2.1m and a
maximum depth when connected of 2.7m, while Munduran Saline had a maximum depth
Frogmore (maximum depth 4.7m, February 2004) and Woolwash (maximum
depth 2.8m, July 2004) lagoons had no connections to other systems during the study
and suffered continual declines in depth throughout the study until, by September 2005
the maximum depth of Frogmore Lagoon was 1.1m while the maximum depth of
Woolwash Lagoon was 0.3m (Fig. 3.8). The 12 Mile system had substantial freshwater
flow in January and February 2004 and 2005, and in December 2004. As a result,
although the two 12 Mile freshwater pools showed similar patterns of decline in depth to
45
December 2004. 12 Mile Brackish followed a similar pattern, but with a slower reduction
in depth and an earlier increase in level to be close to full in November 2004 (Fig. 3.8). It
is unclear whether this increase was due to freshwater flow or a marine conn