1
A DISSERTATION
ON
"STUDY OF FASTING AND POST-PRANDIAL LIPID
ABNORMALITIES IN TYPE-2 DIABETES MELLITUS IN
CORRELATION WITH INCREASED
CARDIOVASCULAR MORBIDITY AND MORTALITY’’
Submitted to
THE TAMILNADU DR. M. G. R UNIVERSITY
CHENNAI
In partial fulfilment of the regulations
for the award of
M.D DEGREE IN GENERAL MEDICINE
BRANCH I
GOVERNMENT MOHAN KUMARAMANGALAM
MEDICAL COLLEGE, SALEM
7
ACKNOWLEDGEMENT
I am extremely thankful to Prof. Dr. R.RAVICHANDRAN,MS,Mch, Dean, Government Mohan Kumaramangalam Medical College Salem, for allowing me to utilize the hospital facilities for doing this work.
I would like to express my heartfelt gratitude to my postgraduate mentor and teacher,
Prof. Dr. V.SUNDARAVEL M.D., Associate Professor, Department of General Medicine, Government Mohan Kumaramangalam Medical College Hospital for his relentless encouragement and expert guidance throughout the period of the study and postgraduate course. His enthusiasm and immense encouragement have been responsible for easing out many shortcomings during this work.
I am deeply indebted to Prof. Dr. S R SUBRAMANIAM M.D. D.Ch, Professor and Head, Department of General Medicine, Government Mohan Kumaramangalam Medical College Hospital, for his fathomless enthusiasm and motivation throughout the study.
Warmest and sincere thanks to Professors – Dr. S RAMASAMY M.D, Dr. R.MANOHARI M.D, Dr. S.RAVIKUMAR M.D, and Dr. S.SURESH KANNA M.D,for
all the help, encouragement and guidance during my post graduation study period.
My warmest gratitude to Dr.SIVAKUMAR.M.D., Registrar, Department of medicine for his guidance in completing the study.
I would like to express my gratitude to Dr. PALANIVELRAJAN M.D, and Dr. ANANDI M.D and whose relentless encouragement inculcated in me a sense of confidence.
I am deeply grateful to all Assistant professors in the department of General Medicine for their immense help and guidance during my post graduation course.
8
I extend my heartfelt thanks to all my colleagues and friends for their help rendered during my study.
I specially thank all my patients without whose cooperation; this dissertation would never have seen the light of the day.
9
Ref no 4531/ME I/P.G/2014 Office of the dean
Government Mohan Kumaramangalam
Medical college, Salem 30
Ethical committee Meeting held on 30.07.2014 at 12 noon in the Dean’s Chamber, Government Mohan kumaramangalam Medical College Hospital, Salem 01, The following members attended the meeting.
MEMBERS.
1. Dr.N. MOHAN MS., FICS., FAIS., FMMC.,Dean, Member secretary ECIRB 2. Dr. A.P.RAMASAMY, MD., Chairman, ECIRB.External Clinician
3. Dr. V.DHANDAPANI, M.D., Deputy Chairman,External Social Scientist, Salem 4. Dr. S.MOHAMED MUSTHAFA, M.D, Professor Pharmacology,GMKMC, Salem
5. Dr. S.R.SUBRAMANIAM, M.D, Professor & HOD of Medicine GMKMCH,Salem, Internal Clinician.
6. Dr. SINDHUJA, M.D., Professor of OG, GMKMCH,Salem, Internal Clinician. 7. Mr.S.SHANMUGAM, B.Sc.,B.L., Advocate, External Legal Expert.
8. Mr.S.SUBRAMANIAM, B.Sc.,C.A., Chartered accountant, External Lay person.
S.NO NAME OF THE PRESENTOR
WITH ADDRESS TOPIC
NAME OF THE GUIDE WITH ADDRESS
WHETHER IT IS APPROVED
OR NOT
7. Dr. Chethan Bharadwaj. A Final year MD (GM) Post graduate student, GMKMCH.salem-30
STUDY OF FASTING AND POST-PRANDIAL LIPID ABNORMALITIES IN TYPE-2 DIABETES MELLITUS IN CORRELATION WITH INCREASED CARDIOVASCULAR MORBIDITY AND MORTALITY
Dr V. Sundaravel MD., Professor of General Medicine
Approved
The Ethical Committee examined the studies in detail and is pleased to accord Ethical Committee approval for the above Post Graduate of this college to carry out the studies with the following conditions.
1. he should carry out the work without detrimental to regular activities as well as without extra expenditure to the institution or government.
2. he should inform the institutional Ethical committee in case of any change of study or procedure site.
12
LIST OF ABBREVATIONS
ADA American Diabetes Association
Apo-E Apolipoprotein E
CAD Coronary Artery Disease
CE Cholesteryl ester
CETP Cholesteryl ester transfer protein
DM Diabetes mellitus
FFA Free fatty acid
HDL High density lipoprotein
HL Hepatic lipase
IDL Intermediate density lipoprotein
IHD Ischemic heart disease
LCAT Lecithin cholesterol aceyl transferase
LDL Low density lipoprotein
LDLR Low density lipoprotein receptor
Lp(a) Lipoprotein(a)
LPL Lipoprotein lipase
PL Phospholipid
SR-BI Class B, type I scavenger receptor
TC Total cholesterol
INR International normalised ratio
13
TABLE OF CONTENTS
Sl. No. Title Page Number
1
INTRODUCTION
1
2
AIMS AND OBJECTIVES
4
3
REVIEW OF LITERATURE
5
4
MATERIALS AND METHODS
32
5
RESULTS
35
6
DISCUSSION
67
7
CONCLUSION
77
8
SUMMARY
78
ANNEXURES:
BIBLIOGRAPHY
STUDY PROFORMA
14
LIST OF TABLES
S.NO Title Page
no.
1 Major classes of plasma lipoproteins 12
2 Lipoprotein alterations in type 2 diabetes 23
3 Results of controlled clinical trials of lipid lowering in
individuals with diabetes 31
4 Age distribution of the cases and controls 35
5 Sex wise distribution of the cases and controls 37
6 Duration of diabetes among the study group 38
7 Duration of hypertension among the study group 40
8
a) Fasting Total Cholesterol levels among the cases and controls
b) Post prandial Total Cholesterol levels among the cases and controls
42
43
9 Comparison of the mean fasting and post prandial Total
Cholesterol levels among the cases and controls 45
10 a) Fasting LDL-C levels among the cases and controls b) Post prandial LDL-C levels among the cases and controls
47 48 11 Comparison of the mean fasting and post prandial LDL-C
levels among the cases and controls 50
12 a) Fasting VLDL-C levels among the cases and controls b) Post prandial VLDL-C levels among the cases and controls
52 53 13 Comparison of the mean fasting and post prandial VLDL-C
levels among the cases and controls 55
14
a) Fasting Triglyceride levels among the cases and controls b) Post prandial Triglyceride levels among the cases and controls
57 58
15 Comparison of the mean fasting and post prandial
Triglyceride levels among the cases and controls 60
16 a) Fasting HDL-C levels among the cases and controls
b) Post prandial HDL-C levels among the cases and controls:
62 63
17 Comparison of the mean fasting and post prandial HDL-C
15
LIST OF GRAPHS
GraphNo. TITLE Page no
1. Age distribution of cases and controls 36
2. Sex wise distribution of the cases and controls 37
3. Duration of diabetes among the study group 39
4. Duration of hypertension among the study group 41
5. Fasting and post prandial Total Cholesterol levels among
the cases and controls 44
6. Comparison of mean fasting and post prandial Total
Cholesterol levels among the cases and controls 46
7. Fasting and post prandial LDL-C levels among the cases
and controls 49
8. Comparison of the mean fasting and post prandial
LDL-C levels among the cases and controls 51
9. Fasting and post prandial VLDL-C levels among the
cases and controls 54
10. Comparison of the mean fasting and post prandial
VLDL-C levels among the cases and controls 56
11. Fasting and post prandial Triglyceride levels among the
cases and controls 59
12. Comparison of the mean fasting and post prandial
Triglyceride levels among the cases and controls 61
13. Fasting and post prandial HDL-C levels among the cases
and controls 64
14. Comparison of the mean fasting and post prandial
16
[image:16.595.68.528.157.320.2]LIST OF FIGURES
Figure
No. TITLE Page no
1. Worldwide Prevalence of diabetes in 2013 6
2. Structure of a plasma lipoprotein 10
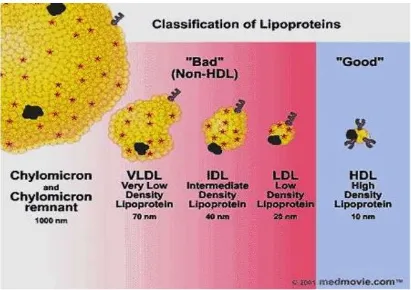
3. Classification of plasma lipoproteins 11
4. Major pathways involved in the metabolism of chylomicrons & VLDL.
14
5. Metabolic pathways involving HDLs 20
17
ABSTRACT
BACKGROUND AND OBJECTIVES
Type 2 diabetes mellitus is associated with the development of premature
atherosclerosis and a higher cardiovascular morbidity and mortality. Diabetic
dyslipidaemia is believed to play an important role in the pathogenesis of
accelerated atherosclerosis in this condition. It is being increasingly believed
that atherosclerosis is a postprandial phenomenon as at least with respect to
lipids, we are in the postprandial phase for most of the day. High postprandial
triglycerides have shown a strong and independent association with CAD.
Hence this study is being carried out to assess the characteristics of post
prandial dyslipidaemia in types 2 diabetes mellitus in comparison with the
fasting lipid levels in diabetics and controls.
METHODOLOGY
This was an observational study which included the patients admitted in
The Government Mohan kumaramangalam Medical college Hospital, Tamil
Nadu. The study included 50 patients with type 2 diabetes mellitus meeting the
inclusion criteria and were compared with 50 age and sex matched healthy
18
METHOD OF COLLECTION OF DATA
Data for the proposed study was collected in a pretested proforma .
Detailed history and physical examination of all the cases and controls was
done. Fasting and Post prandial lipid levels were estimated in all the cases and
controls. Blood was collected from patients after an overnight (12-hour) fast and
six hour postprandial (after a standard meal) for lipid profile measurements.
RESULTS
The majority of cases and controls were in the age group of 61-70 years.
All the cases in the fasting state had a raised triglyceride (mean
172.92±75.51mg/dL) level, raised VLDL-C (mean 37.76±20.01mg/dL) level,
decreased HDL-C (mean 33.44±11.99mg/dL) level, normal total cholesterol
(mean 176.36±52.43mg/dL) level and normal LDL-C (mean
101.16±38.17mg/dL) levels compared to the control group.
In the post prandial state the diabetics had a significant increase in the
post prandial triglyceride level (mean 232.52±105.08mg/dL), decrease in the
HDL-C level (mean 30.96±11.15mg/dL) compared to the fasting state whereas
in the control group there was no significant increase in the post prandial lipid
19
CONCLUSION
The dyslipidemia of Type 2 DM is characterised mainly of raised
triglyceride levels, raised VLDL-C Levels and decreased HDL-C levels. In the
post prandial state there was significant hyper-triglyceridaemia and decreased
HDL-C level in diabetics when compared to that of the controls.
20
INTRODUCTION
Diabetes mellitus (DM) refers to a group of common metabolic disorders
characterised by the distinct phenotype of hyperglycemia. Various distinct
types of DM are due to the complex interaction of the environmental and the
genetic factors.
Based on the etiology of the DM, factors responsible for hyperglycemia
are reduced insulin secretion, decreased glucose utilization, and increased
glucose production. The metabolic dysregulation seen in DM is responsible for
secondary pathophysiologic changes in multiple organ systems which results in
tremendous burden on the individual suffering from diabetes as well as on the
health care system.
DM is classified based on the the pathogenic process responsible for
hyperglycemia, as opposed to earlier criteria based on age of onset or type of
therapy.
The two broad categories of DM are designated as type 1diabetes and
type 2 diabetes. Both types of diabetes are preceded by the period of abnormal
glucose homeostasis . Type 1 DM occurs because of complete or near-total
21
factors responsible for hyperglycemia include variable degrees of insulin
resistance, impaired insulin secretion, and increased glucose production.
Distinct genetic and metabolic defects in insulin action and/or secretion is
responsible for the common phenotype of hyperglycemia in type 2 DM and
have important potential therapeutic implications based on which the
pharmacologic agents are available to target specific metabolic derangements.
Type 2 DM is preceded by a phase of abnormal glucose homeostasis defined as
impaired fasting glucose (IFG) or impaired glucose tolerance (IGT).
Dyslipidemia that is associated with type 2 diabetes plays a vital role in
the pathogenesis of accelerated atherosclerosis in that population. The most
important features of this dyslipidemia include an elevated very low density
lipoproteins (VLDL) and total triglycerides (TGs) and a decreased high density
lipoproteins (HDL) concentration in the serum. While fasting
hypertriglyceridemia plays an important role in atherosclerosis, particularly in
people with diabetes mellitus, this association has been less consistent and
fasting HDL-C appears to be a far more significant determinant of
atherosclerosis. However, when TGs are analysed in the postprandial state,
22
Postprandial hypertriglyceridemia is shown to be associated with asymptomatic
and symptomatic macro vascular disease in both normo- and
hypertriglyceridemic groups and such abnormalities have been reported in
people with type 2 diabetes and hence the increased risk of atherosclerosis
among them, might therefore be correlated to the higher degree of
postprandial triglyceridemia.
Earlier studies clearly demonstrate the presence of hypertriglyceridemia in the
postprandial state among the diabetic subjects, irrespective of whether fasting
triglyceride levels were high or low.
It is not clearly known whether the patients with type 2 diabetes with macro
vascular disease have greater abnormalities of the triglyceride metabolism in
23
AIMS AND OBJECTIVES
1. To study the post-prandial lipid abnormalities in patients with type 2
Diabetes Mellitus.
2. To compare the relationship between fasting and post-prandial lipids in
24
REVIEW OF LITERATURE
The worldwide prevalence of DM has risen dramatically over the past two
decades, from an estimated 30 million cases in 1985 to 382 million in 2013.
Based on the current trends, the International Diabetes Federation projects that
592 million will have diabetes by 2035. Although the prevalence of both type 1
and type 2 DM is increasing worldwide, the prevalence of type 2 DM is rising
much more rapidly, presumably because of increasing obesity, reduced activity
levels as countries become more industrialized, and the ageing of the
population.(1)
In 2013, the prevalence of diabetes in individuals from age 20-79 ranged
from 23 to 37% in the 10 countries with highest prevalence. The countries with
the greatest number of individuals with diabetes in 2013 are China ( 98.4
million), India (65.1 million), United States (24.4 million), Brazil (11.9 million)
and the Russian federation (10.9 Million). DM increases with aging. In 2012,
the prevalence of DM in the United States was estimated to be 0.2% in
individuals aged <20 years and 12% in individuals aged >20 years. In
individuals aged >65 years, the prevalence of DM was 26.9%. The prevalence is
25
Fig. 1 Worldwide Prevalence of diabetes in 2013
26
LIPIDS AND LIPOPROTEINS
The lipids are a heterogeneous group of compounds that are important dietary
constituents not only because of their high energy value, but also because of the
fat-soluble vitamins and the essential fatty acids contained in the fat of natural
foods. 1
They are found in cell membranes, which maintain cellular integrity and allow
the cytoplasm to be compartmentalized into specific organelles. Lipids function
as a major form of stored nutrients (triglycerides), as precursors of adrenal and
gonadal steroids and bile acids (cholesterol), and as extracellular and
intracellular messengers (e.g., prostaglandins, phosphatidylinositol). 2
Combinations of lipid and protein (lipoproteins) are important cellular
constituents, occurring both in the cell membrane and in the mitochondria, and
27
Classification of lipids
11. Simple lipids: Esters of fatty acids with various alcohols.
a. Fats: fatty acids + glycerol
b. Waxes: fatty acids + higher molecular weight monohydric alcohols
2. Complex lipids: Esters of fatty acids containing groups in addition to an
alcohol and a fatty acid.
a. Phospholipids: fatty acids + alcohol + a phosphoric acid residue.
Eg. glycerophospholipids , sphingophospholipids
b. Glycolipids (glycosphingolipids): Lipids containing a fatty acid,
sphingosine, and carbohydrate.
c. Other complex lipids: eg. Sulfolipids, aminolipids, Lipoproteins.
3 . Precursor and derived lipids: These include fatty acids, glycerol, steroids,
other alcohols, fatty aldehydes, and ketone bodies , hydrocarbons, lipid-
28
LIPOPROTEINS
Lipoproteins are microemulsions composed of lipids (cholesterol, cholesteryl
ester, triglyceride, and phospholipid) and proteins (apoproteins). Their function
is to transport non-water-soluble cholesterol and triglycerides in plasma. 3,4,5
Structure of a plasma lipoprotein.
1Lipoproteins consist of a nonpolar lipid core made up of mainly triacylglycerol
and cholesteryl ester and is surrounded by a single surface layer of amphipathic
phospholipid and cholesterol molecules. The protein moiety of a lipoprotein is
known as an apolipoprotein or apoprotein.
Apolipoproteins carry out several roles:
(1) They can form part of the structure of the lipoprotein,
(2) They are enzyme cofactors, and
29
[image:29.595.49.525.75.538.2]30
Classification
3Lipoproteins have been classified on the basis of their densities during
[image:30.595.100.511.224.514.2]ultracentrifugation.
31
Table 1 : Major classes of plasma lipoproteins2
Type Density Electrophoretic Site of Major Lipids Major
(g/mL) Mobility Origin Apolipoproteins
Chylomicrons < 0.95 Origin Intestine 85% B48, AI, AIV (E, Triglyceride CI, CII, CIII—by
transfer from HDL) Chylomicron <1.006 Origin Intestine 60% B48, E
Remnants Triglyceride,
20% cholesterol 55%
Triglyceride, B100, E, CI, CII, VLDL <1.006 Pre-β Liver 20% cholesterol CIII
Derived IDL
1.006-
Β
from 35% Cholesterol,
B100, E
1.019 VLDL 25% triglyceride
LDL 1.019- Β Derived 60% Cholesterol, B100 1.063 from IDL 5% triglyceride
HDL 1.063- Α Liver, 25% AI, AII, CI, CII,
1.21 intestine, Phospholipid, CIII, E plasma 20% cholesterol,
5% triglyceride (50% protein)
Lp(a) 1.05- Α Liver 60% Cholesterol, B100, apo(a)
32
LIPOPROTEIN METABOLISM
Chylomicrons :
Chylomicrons are the largest of the plasma lipoproteins and
are composed of 98% to 99% lipid (85%-90% triglyceride) and 1% to 2%
protein. They contain several apolipoproteins, including apo-B48, apo-AI,
apo-AIV, apo-E, and the C apolipoproteins . 6, 7, 8
Origin :
Chylomicrons are produced by the epithelial cells of the small intestine
(duodenum and proximal jejunum) when dietary fat and cholesterol are
presented to the brush border of the epithelial cell membranes as bile acid
micelles. Triglycerides, phospholipids, and cholesterol (absorbed or synthesized
by the intestinal cells) are used for chylomicron formation in the Golgi
apparatus, where some of the apolipoproteins undergo final carbohydrate
processing, and the chylomicrons are secreted into the space along the lateral
borders of the intestinal cells. From there, they enter the mesenteric lymph and
proceed through the thoracic duct lymph to the general circulation. Newly
synthesized chylomicrons possess apo-B48, apo-AI, and
apo-AIV (intestinally synthesized apolipoproteins); they acquire apo-E and
33
Metabolic Fate :
In the circulation, LPL catalyzes the release of FFAs from
chylomicron triglycerides and converts them into triglyceride-poor, cholesterol
enriched chylomicron remnants. Chylomicron remnants are cleared rapidly
from the plasma by the liver. 9, 10, 11
34
Figure 4 : General scheme summarizing the major pathways involved in the metabolism of chylomicrons synthesized by the intestine and VLDL
[image:34.595.72.520.116.539.2]35
Very-Low-Density Lipoproteins
Characteristics : VLDLs are made up of 85% to 90% lipid (about 55% triglyceride, 20% cholesterol, and 15% phospholipid) and 10% to 15% protein.
The distinctive apolipoprotein is apo-B100, the hepatic form of apo-B. VLDLs
also contain apo-E and C apolipoproteins. 6, 13
Origin : VLDLs are synthesized by the liver, and their production is stimulated
by increased delivery of FFAs to the hepatocytes, either from a high intake of
dietary fat or from the mobilization of fatty acids from adipose tissue with
fasting or uncontrolled diabetes mellitus. Triglycerides and phospholipids to be
used in the formation of VLDL are synthesized in the liver, whereas VLDL
cholesterol can be synthesized de novo or reused from LDL cholesterol. 14
Metabolic Fate : VLDL triglycerides are hydrolyzed by the actions of LPL and
hepatic lipase. They are converted to smaller and smaller particles that become
increasingly rich in cholesterol. The products of VLDL catabolism are IDLs.
IDLs are processed to LDLs.2
Approximately half of VLDLs are converted to LDLs, and the remainder are
cleared directly by the liver as VLDL remnants (small VLDL) and IDLs. 15, 16, 17
36
Intermediate-Density Lipoproteins
Characteristics : IDLs are normally present in low
concentrations in the plasma and are intermediate in size and composition
between VLDL and LDL. Their primary proteins are apo-B100 and apo-E. 13, 15
Metabolic fate : They are precursors of LDLs and represent metabolic products
of VLDL catabolism in the plasma by the action of lipases. IDLs may be further
processed by hepatic lipase or removed from the plasma by the LDL receptor.2
Function : IDLs are often considered to be VLDL remnants and to be
atherogenic. 2
Low-Density Lipoproteins
Characteristics : LDLs are the major cholesterol-carrying lipoproteins in the
plasma; about 70% of total plasma cholesterol is in LDL. LDLs are composed
of approximately 75% lipid (about 35% cholesteryl ester, 10% free cholesterol,
10% triglyceride, and 20% phospholipid) and 25% protein. Apo-B100 is the
37
Origin : LDLs are the end products of lipase-mediated hydrolysis of VLDLs. 2
Metabolic Fate : About 75% of LDL is taken up by hepatocytes. Other tissues
take up smaller amounts of LDL. Approximately two thirds of the uptake is
mediated by the LDL receptor, and the remainder is mediated by a poorly
defined process that does not involve receptors. LDLs are considered to be
atherogenic. 2
Function : Transports cholesterol from liver to peripheral tissues. 2
High-Density Lipoproteins
Characteristics : HDLs are small particles (70-120 Å in diameter) which
contain about 50% lipid (25% phospholipid, 15% cholesteryl ester, 5%
free cholesterol, and 5% triglyceride) and 50% protein. Their major
apolipoproteins are apo-AI (65%), apo-AII (25%), and smaller amounts of the C
apolipoproteins and apo-E . Apo-E is a minor component of a subclass of HDL
referred to as HDL1. HDLs serve as a reservoir for apo-E and the C
apolipoproteins to be distributed to other lipoproteins when they enter the
38
They are divided into two major subclasses :
1. HDL2 (d = 1.063-1.125 g/mL)
2. HDL3 (d = 1.125-1.21 g/mL).
Origin : HDLs originate from three major sources.
1. The liver secretes an apo-AI-phospholipid disc called nascent or precursor
HDL (pre-β HDL).
2. The intestine directly synthesizes a small apo-AI–containing HDL particle.
3. HDLs are derived from surface material (primarily apo-AI and phospholipid)
that comes from chylomicrons and VLDLs during lipolysis.
Maturation of High-Density Lipoproteins. 19, 20
The nascent or precursor HDL particles exist as apo-AI-phospholipid discs.
Designated pre-β1, pre-β2, and pre-β3, these discs are excellent acceptors of
free cholesterol from cells with excess cholesterol or from other lipoproteins
forming small, spherical, mature HDL particles (HDL3) . (HDL3) accepts more
39
HDL1 can also arise from a precursor particle that displays γ-electrophoretic
mobility and is called γLp-E. This particle is approximately 80% protein and
20% lipid (primarily sphingomyelin and phosphatidylcholine, with some free
cholesterol). The γLp-E is a good acceptor of free cholesterol from cells and
appears to be converted to the larger HDL1.
Function : Is a main transporter of cholesterol from peripheral tissue to liver.
Acquisition of Cholesterol by High-Density Lipoproteins
HDL, especially HDL3, precursors of mature HDL, and lipid-poor apo-AI, can
acquire cholesterol from cells by two mechanisms. aqueous transfer from cells
and transport facilitated by a cell-surface binding protein. 21, 22
Metabolic Pathways Involving High-Density Lipoproteins
HDLs function in the redistribution of lipids among lipoproteins and cells by a
process called reverse cholesterol transport. 19, 20, 22
HDLs acquire cholesterol from cells and transport it to the liver for excretion or
40
Figure 5 : 2 Role of high-density lipoprotein (HDL) in the redistribution of Lipids from cells with excess cholesterol to cells requiring cholesterol or to
the liver for excretion.
41
A second pathway of cholesterol redistribution involves CETP ( Fig. 4) CETP
transfers cholesteryl ester from HDL2 to VLDL, IDL, LDL, and remnants. The
cholesterol is thus delivered indirectly to the liver through VLDL and
chylomicron remnant pathways. In exchange for transfer of the cholesteryl
ester, CETP transfers triglyceride from VLDL, IDL, LDL, and remnants to
HDL2, which becomes enriched with triglycerides. The CETP pathway is the
major route for the transport and delivery of cholesteryl esters from HDL to the
liver in humans. 23, 24
A third pathway involves SR-BI ( Fig. 4). Cholesteryl esters are removed from
the particle by selective uptake and preferentially delivered to the liver, adrenal
glands, and gonads. The SR-BI can facilitate the transfer of cholesteryl esters
from HDL to cells without the lipoprotein particle's entering the cell or being
degraded. The SR-BI appears to function by transferring cholesteryl ester
through a hydrophilic channel formed in the cell membrane. 25
HDL2 Is Reconverted to HDL3 to Regenerate These Cholesterol Acceptors. 26
HDL2 particles are partially depleted of cholesteryl esters and enriched in
triglycerides by the action of CETP. Hepatic lipase can then act on the large,
triglyceride-enriched HDL2 to hydrolyze the triglycerides (and possibly excess
phospholipids), converting HDL2 to HDL3. HDL3 serves as an acceptor of free
42
High-Density Lipoproteins as Anti-atherogenic Lipoproteins
Numerous studies have demonstrated that high levels of HDL-C are associated
with a lower incidence of CHD. Conversely, low levels of HDL-C are
associated with a higher incidence of CHD.27 The protective mechanism involving HDL may be related to its role in reverse cholesterol transport, which
results in redistribution of cholesterol away from the artery wall. Other
potentially protective roles for HDL include inhibition of monocyte adhesion
43
[image:43.595.73.501.153.726.2]LIPOPROTEIN ALTERATIONS IN TYPE2 DIABETES
Table 2 : Lipoprotein alterations in type 2 diabetes. 3
Lipoprotein Alterations
Increased production of triglyceride and apoB,
Decreased clearance of triglyceride and apoB, VLDL ↑
Abnormal composition
Increased production of LDL apoB, Decreased receptor-mediated clearance, Triglyceride enrichment,
LDL ↑→ Smaller (more dense) particle distribution, Glycation,
Oxidation
Increased clearance of apoA, Decreased proportion of large HDL, Triglyceride enrichment,
HDL ↓ Glycation,
44
Alterations in Triglycerides and VLDL
The most common alteration of lipoproteins in type 2 diabetes is
hypertriglyceridemia caused by an elevation in VLDL concentrations. It is clear,
however, from population-based studies28, 29 that type 2 diabetes generally is associated with only a 50% to 100% elevation in the plasma levels of total and
VLDL triglycerides. Thus, it is likely that subjects with type 2 diabetes who
have concentrations of total triglycerides greater than 350 to 400 mg/dL also
have genetic defects in lipoprotein metabolism, the expression of which may be
exacerbated by hyperglycemia. 30
Metabolic Determinant
One of the determinants of diabetic hypertriglyceridemia is the overproduction
of VLDL triglyceride, which is most likely due to the increased flow of
substrates, particularly glucose and free fatty acids, to the liver. In addition,
individuals with type2 diabetes appear to have a defect in clearance of VLDL
triglyceride that parallels the degree of hyperglycemia. Overproduction of
VLDL apoB and decreased fractional catabolic rate for VLDL apoB also occurs
45
The alterations in VLDL metabolism in type 2 diabetes are related in part to
insulin resistance. Hyperinsulinemia and the central obesity that typically
accompanies insulin resistance also are thought to lead to overproduction and
impaired catabolism of VLDL.
In addition to increases in the amount of VLDL, individuals with diabetes,
especially those with severe hyperglycemia, may have larger triglyceride-rich
VLDL. Subfractions of VLDL have been found to be enriched in the proportion
of cholesterol-rich particles. These compositional changes may have
implications for the increased propensity for atherosclerosis among people with
type 2 diabetes, because cholesterol-enriched VLDL may be atherogenic.35, 36
Triglyceride elevations in type 2 diabetes may also be due to delayed clearance
of postprandial particles. 34
Alterations in Low- Density Lipoprotein Cholesterol
Studies examining plasma concentrations of total and LDL cholesterol in type
2 diabetes vary by population, with some showing higher and some showing
46
Metabolic Determinant 3, 37
The composition of LDL in type 2 diabetes is altered, with an increase in the
proportion of small, dense, triglyceride-enriched LDL and these changes also
contribute significantly to abnormal metabolism and atherosclerosis. The small,
dense LDL have increased oxidative susceptibility and are more rapidly
oxidized. Oxidized LDL particles are believed to play a major role in
stimulating the atherosclerotic process because of their recognition by
macrophage receptors.
Increased plasma triglyceride levels, low HDL levels, and small, dense LDLs
usually occur together in a lipoprotein pattern often referred to as atherogenic
dyslipidemia.
The transfer of LCAT-synthesized cholesteryl esters to VLDL and LDL is
inhibited, with a concomitant increase in their transfer to HDL; this abnormal
metabolic pattern is reversed by insulin therapy. The block in cholesteryl ester
transfer activity in patients with type 2 diabetes is correlated with an increase in
free cholesterol content of both LDL and VLDL. Therefore, in type 2 diabetes,
this abnormal cholesteryl ester transfer may be related to an increased risk for
47
Alterations in High-Density Lipoprotein Cholesterol
In individuals with type 2 diabetes decreased concentrations of HDL
cholesterol has been observed. 3
Metabolic Determinant
Individuals with type 2 diabetes have an increased rate of HDL clearance.
Elevated hepatic lipase activity also contribute to the decrease in HDL
concentrations in type 2 diabetes. 38
In type 2 diabetes an increased proportion of triglyceride in HDL has been
observed. These compositional changes appear to be related to the activity of
adipose tissue LPL, because LPL deficiency may be a factor responsible for the
altered distribution of HDL particles in untreated type 2 diabetes. Nonenzymatic
glycation of HDL appears to interfere with HDL receptor binding.39 Thus, glycation of HDL may also play a role in the lower levels of HDL observed in
diabetes. Finally, abnormalities in HDL composition have been noted even in
individuals with optimal glycemic control. 40
All of these alterations in HDL composition may impair the role of HDL in
48
DIABETIC DYSLIPIDEMIA
The dyslipidemia associated with type 2 diabetes and insulin resistance typically
consists of elevated triglycerides and decreased HDL cholesterol level. The
frequently mild abnormality in LDL cholesterol concentration associated with
diabetes belies a qualitative abnormality in the LDL structure, i.e., decreased
size and increased density of the LDL particle. 41 LDL appears to be a very potent contributor to the development of CHD
Unlike LDL-C, which is well-established as a major predictor for CVD in
global populations, the independent relationship of TG on predicting CVD
has long been controversial. 42
Although some previous studies like UKPDS did not favour
hypertriglyceridemia as an independent risk factor for CVD, two recent
metaanalysis studies have suggested that TG is independently associated with
myocardial infarction, CHD, CVD and CVD death. 43, 44, 45, 46
Asian studies have shown that increased serum TG levels have been an
independent risk factor for CHD and TG appeared to play an important role in
49
The Copenhagen city heart study has shown significant increase in the hazard
[image:49.595.60.553.164.527.2]ratio with increasing non fasting triglycerides level
Fig. 6 : Copenhagen heart study result
1 2 3 4 5 6 7
Non fasting TG in mmol/L
Non fasting TG mmol/L
1 2 3 4 5 6 7
50
RATIONALE FOR THERAPY FOR LIPID ABNORMALITIES IN
DIABETES
Atherosclerotic macrovascular disease is the leading cause of morbidity and
mortality in patients with diabetes mellitus. Both men and women with diabetes
have a significantly increased risk of myocardial infarction (MI), stroke, and
peripheral gangrene.49, 50 The risk for developing coronary heart disease (CHD) begins prior to the development of type 2 diabetes. By the time the diagnosis of
type 2 diabetes is made, more than half of all diabetic individuals already have
clinical CHD.51 In addition, patients with diabetes have an increased rate of MI-associated pre hospital mortality, as well as increased morbidity and mortality
during and after hospitalization. 52
These data provide a strong rationale for treating cardiovascular risk factors in
diabetic patients as aggressively as in nondiabetic patients with clinical CHD.
Thus, diabetes confers a risk that is equivalent to that of known CHD. The ADA
and the American Heart Association consider type 2 diabetes a CHD
equivalent.53
Various Randomized controlled clinical trials demonstrate that people with
diabetes benefit from cholesterol-lowering therapy, with improvements in
51
Table 3 : Results of Controlled Clinical Trials of Lipid Lowering in
Individuals with Diabetes
Study
LDL HDL
Triglycerides Clinical outcomes cholesterol cholesterol
CARE 33 Decreased Increased Decreased 25% risk reduction (P = 0.05)
27% 5% 14%
4S34,35
Decreased Increased Decreased 55% risk reduction
36% 8% 10% (P = 0.002)
42% on later analysis (P = 0.001)
VA-HIT36 No change Increased Decreased 24% decrease in CVD death
6% 31% or nonfatal myocardial infarction (P = 0.05)
DAIS37 Decreased Increased Decreased 40% reduction in progression
10% 6% 29% of localized atherosclerotic lesions (P = 0.02)
AFCAPS/ Decreased Increased Decreased 33% reduction in CVD events
TexCAPS38 25% 6% 15% (NS)
HPS39 Decreased Increased Decreased 26% reduction in first CVD
29% 3% 14% event (data incomplete)
[image:51.595.71.502.171.747.2]52
MATERIALS AND METHODS
This was an observational study which included the patients admitted in The
Government Mohan kumaramangalam Medical college Hospital, Tamil Nadu.
The study included 50 patients with type 2 diabetes mellitus meeting the
inclusion criteria and were compared with 50 age and sex matched healthy
controls, fulfilling the inclusion and exclusion criteria.
The study period :
From August 2014 to July 2015
INCLUSION CRITERIA
Patients diagnosed with type 2 diabetes mellitus on the basis of revised
53
EXCLUSION CRITERIA
• Type 1 diabetes mellitus
• Inherited disorder of lipid metabolism
• Liver disease
• Endocrine diseases affecting lipids (hypothyroidism, cushing's
syndrome)
• Renal disease
• Smoking and
• Patients on medication affecting lipid metabolism
Method of collection of data
A detailed proforma was filled up for each patient, which included age, sex, IP
number, detailed history, past and personal history, medication history. A
detailed clinical examination was done. Laboratory parameters including fasting
and postprandial blood glucose, renal function tests, liver function tests, ECG
and routine urine examination
Fasting and Post prandial lipid profile which included serum total cholesterol,
serum triglycerides, LDL cholesterol, HDL cholesterol and VLDL were
estimated in all the cases and controls. Blood was collected from patients after
an overnight (12-hour) fast and six-hour postprandial (after a standard meal) for
54
Statistical Analysis
The following statistical methods were employed
1. Descriptive statistics
2. T test – Independent samples
3. T test pair samples
4. Repeated measure ANOVA
5. Product-moment correlation
Using SPSS for windows
55
RESULTS
In this study, fasting and post prandial lipid profile was done in 50 patients
with type 2 diabetes mellitus and was compared with the fasting and post
[image:55.595.117.544.270.544.2]prandial lipid profile in 50 healthy controls, age and sex matched.
Table 4: Age distribution of the cases and controls
Age
Control Diabetic
Total
N % N %
31 - 40 3 6 3 6 6
41 - 50 11 22 11 22 22
51 - 60 16 32 16 32 32
61 - 70 20 40 20 40 40
Total 50 100 50 100 100
56
Graph 1 : Showing the age distribution of the cases and controls
In this study, the study group constituted cases between the age 31 to 70 years.
The majority of cases and controls were in the age group of 61-70 years which
constituted 40% of the total; followed by persons in the age group 51-60 years
who constituted 32% of the total study.
6 22 32 40 6 22 32 40 0 5 10 15 20 25 30 35 40 45
31 - 40 41 - 50 51 - 60 61 - 70
57
Table 5 : Sex wise distribution of the cases and controls
Graph 2 : Showing the sex wise distribution of the cases and controls
In this study, 60 percent were males and 40 percent were females, in both the
groups.
60 60
40 40
0 10 20 30 40 50 60 70 Control Diabetic Per ce n tage Male Female Sex
Control Diabetic
Total
N % N %
Male 30 60 30
60 60
Female 20 40 20
40 40
[image:57.595.117.495.434.680.2]58
Table 6 : Duration of diabetes among the study group
4, 8%
14, 28%
26, 52% 6, 12%
DM
Newly detected
1 - 5
6 - 10
Above 10
DM
Control Diabetic
Total
N % N %
No Diabetes 50 100
Newly detected 4 8 54
1 - 5 14 28 14
6 - 10 26 52 26
Above 10 6 12 6
59
Graph 3 : Graph showing the duration of diabetes among the studygroup
In this study 8% of the cases were newly detected type 2 diabetics, whereas
28% of the cases had diabetes for 1 - 5 years, 52% had diabetes for 6 – 10 years
and 12 % had diabetes for more than 10 years. In the control group none of the
patients had type 2 diabetes mellitus.
100
8 28
52
12
0 20 40 60 80 100 120
Control Diabetic
Per
ce
n
tage
60
Table 7 : Duration of hypertension among the study group
30, 60% 7, 14%
13, 26%
HTN
No HTN
1 - 5
Above 5
HTN
Control Diabetic
Total
N % N %
No HTN 50 100 30 60 80
1 - 5 7 14 7
Above 5 13 26 13
61
Graph 4 : Graph showing the duration of hypertension among
the study group
In this study, 40 % of diabetics had hypertension whereas 60 % of diabetics
were normotensive. None of the controls, were found to have hypertension.
100
60
14
26
0 20 40 60 80 100 120
Control Diabetic
Per
ce
n
tage
HTN
62
Table 8a : Fasting Total Cholesterol levels among the cases and controls
TC _ Fasting
Control Diabetic
Total Chi
square p
N % N %
Up to 200 42 84 38 76 80
3.85 0.146 201 - 240 7 14 6 12 13
Above 240 1 2 6 12 7
Total 50 100 50 100 100
63
Table 8b: Post prandial Total Cholesterol levels among the cases and controls
TC_ Post
Control Diabetic
Total Chi
square p
N % N %
Up to 200 43 86 37 74 80
2.85 0.241 201 - 240 6 12 9 18 15
Above 240 1 2 4 8 5
[image:63.595.114.485.137.483.2]64
Graph 5 : Fasting and post prandial Total Cholesterol levels among
the cases and controls
In this study, in the fasting state, 24% of cases had total cholesterol levels of
>200 mg/dl as compared with the control group wherein 16% of them had total
cholesterol of >200 mg/dl.
In the post prandial state, 26% of cases had total cholesterol levels of >200
mg/dl, but when compared with that of controls only 14% of them had total
cholesterol levels of >200 mg/dl.
84
76
86
74
14 12 12 18
2 12 2 8 0 10 20 30 40 50 60 70 80 90 100
Control Diabetic Control Diabetic
TC_Fasting TC_Post
Per
ce
n
tage
65
Table 9 : Comparison of the mean fasting and post prandial Total
Cholesterol levels among the cases and controls
TC
Group N Fasting Post
Mean SD t p Mean SD t p
Control 50 163.78 36.29
1.4 0.166
165.42 35.36
0.99 0.323
[image:65.595.52.556.182.513.2]66
Graph 6 : Comparison of the mean fasting and post prandial Total
Cholesterol levels among the cases and controls
In this study, the mean TC level in the cases was 176.36 ± 52.43 mg/dl in the
fasting state and 173.3 ± 43.56 mg/dl in the post prandial state. The controls had
a mean TC level of 163.78 ± 36.29 mg/dl in the fasting state and 165.42 ± 35.36
mg/dl in the post prandial state.
67
Table 10a: Fasting LDL-C levels among the cases and controls
LDL-C Fasting
Control Diabetic
Total Chi
square p
N % N %
Up to 100 23 46 29 58 52
3.96 0.266 101 - 130 17 34 11 22 28
131 - 160 8 16 5 10 13
161 - 190 2 4 5 10 7
[image:67.595.100.498.154.556.2]68
Table 10 b: Post prandial LDL-C levels among the cases and controls
LDL-C Post
Control Diabetic
Total Chi
square p
N % N %
Up to 100 23 46 26 52 49
3.25 0.518 101 - 130 17 34 12 24 29
131 - 160 6 12 10 20 16
161 - 190 3 6 2 4 5
69
Graph 7 : Fasting and post prandial LDL-C levels among the cases and controls
In this study, in the fasting state, 58% of cases had LDL-C levels of <100
mg/dl as compared with that of the control group where 46% of controls had
LDL-C of <100 mg/dl.
In the post prandial state, 52% of cases had LDL-C levels of <100 mg/dl as
compared with that of control group where 46% of them had LDL-C of <100
mg/dl. 46 58 46 52 34 22 34 24 16
10 12
20
4
10
6 4
0 10 20 30 40 50 60 70
Control Diabetic Control Diabetic
LDL-C _Fasting LDL-C _Post
P er ce n tag e
70
Table 11: Comparison of the mean fasting and post prandial LDL-C levels
among the cases and controls
LDL-C Group N
Fasting Post
Mean SD t p Mean SD t p
Control 50 99.82 36.21
0.18 0.857
103.74 35.6
0.88 0.383
Diabetic 50 101.16 38.17 97.38 36.93
71
Graph 8 : Comparison of the mean fasting and post prandial LDL-C
levels among the cases and controls
In this study, the cases had a mean LDL-C level of 101.16 ± 38.17 mg/dl in
the fasting state and 97.38 ± 36.93 mg/dl in the post prandial state. The controls
had a mean LDL-C level of 99.82 ± 36.21 mg/dl in the fasting state and 103.74
± 35.6 in the post prandial state
99.82
101.16 103.74
97.38
94 96 98 100 102 104 106
Control Diabetic
M
e
an
LDL-C
72
Table 12 a: Fasting VLDL-C levels among the cases and controls
VLDL-C Fasting
Control Diabetic
Total Chi
square p
N % N %
Up to 20 21 42 9 18 30
10.76 0.029* 21 - 40 25 50 27 54 52
41 - 60 2 4 8 16 10
61 - 80 2 4 5 10 7
Above 100 1 2 1
73
Table 12 b: Post prandial VLDL-C levels among the cases and controls
VLDL-C Post
Control Diabetic
Total Chi
square p
N % N %
Up to 20 17 34 4 8 21
18.42 0.001** 21 - 40 26 52 23 46 49
41 - 60 6 12 15 30 21
61 - 80 6 12 6
81 - 100 1 2 2 4 3
74
Graph 9 : Fasting and post prandial VLDL-C levels among the cases and controls
In this study, in the fasting state 28% of cases had total VLDL-C levels of
>40 mg/dl as compared with that of the control group where only 8% of them
had VLDL-C levels of >40mg/dl.
Similarly, in the post prandial state, 46% of cases had VLDL-C levels of >40
mg/dl as compared with that of control group, where 14% of them had VLDL-C
levels of >40 mg/dl.
42 18 34 8 50 54 52 46 4 16 12 30 4
10 12
2 2 4
0 10 20 30 40 50 60
Control Diabetic Control Diabetic
VLDL-C _Fasting VLDL-C _Post
P er ce n tag e
75
Table 13 : Comparison of the mean fasting and post prandial VLDL-C
levels among the cases and controls
VLDL-C Group N
Fasting Post
Mean SD t p Mean SD t p
Control 50 26.2 13.41
3.1 0.003
28.12 14
3.92 0.000
76
Graph 10 : Comparison of the mean fasting and post prandial VLDL-C
among the cases and controls
In this study, the cases had a mean VLDL-C level of 36.76 ± 20.01 mg/dl in
the fasting state and 41.58 ± 19.82 mg/dl in the post prandial state. The controls
had a mean VLDL-C level of 26.2 ± 13.41 mg/dl in the fasting state and 28.12 ±
14 mg/dl in the post prandial state.
77
Table 14a: Fasting Triglyceride levels among the cases and controls
TG Fasting
Control Diabetic
Total Chi
square p
N % N %
Up to 150 35 70 22 44 57
9.70 0.021* 151 - 200 12 24 15 30 27
201 - 400 3 6 12 24 15
Above 400 1 2 1
78
Table 14b: Post prandial Triglyceride levels among cases and controls
TG Post
Control Diabetic
Total Chi
square p
N % N %
Up to 150 34 68 9 18 43
28.02 < 0.001** 151 - 200 11 22 19 38 30
201 - 400 5 10 18 36 23
Above 400 4 8 4
79
Graph 11 : Fasting and post prandial Triglyceride levels among the cases and controls
In this study, in the fasting state 56% of the cases had total TG levels of >150
mg/dl as compared with that of control group wherein only 30% of them had
TG levels of >150 mg/dl.
Similarly in the post prandial state, 82% of the cases had TG levels of >150
mg/dl as compared with that of control group wherein only 32% of them had
TG levels of >150 mg/dl.
70 44 68 18 24 30 22 38 6 24 10 36 2 8 0 10 20 30 40 50 60 70 80
Control Diabetic Control Diabetic
TG _Fasting TG _Post
P er ce n tag e
80
Table 15 : Comparison of the mean fasting and post prandial triglyceride
levels among the cases and controls
TG Group N
Fasting Post
Mean SD t p Mean SD t p
Control 50 125.66 49.55
3.7 0.000
133.66 48.79
6.03 0.000
81
Graph 12 : Comparison of the mean fasting and post prandial Triglyceride
levels among the cases and controls
In this study, the cases had a mean TG level of 172.92.48 ± 75.51 mg/dl in the
fasting state and 232.52 ± 105.08 mg/dl in the post prandial state. The controls
had a mean TG level of 125.66 ± 49.55 mg/dl in the fasting state and 133.66 ±
48.79 mg/dl in the post prandial state
125.66
172.92
133.66
232.52
0 50 100 150 200 250
Control Diabetic
M
e
an
TG
82
Table 16a: Fasting HDL-C levels among the cases and controls
HDL-C Fasting
Diabetic Control
Total Chi
square p
N % N %
Up to 35 35 70 30 60 65
3.00 0.223 36 - 45 11 22 10 20 21
Above 45 4 8 10 20 14
Total 50 100 50 100 100
83
Table 16b: Post prandial HDL-C levels among the cases and controls
HDL-C Post
Diabetic Control
Total Chi
square p
N % N %
Up to 35 40 80 29 58 64
9.6 0.04 36 - 45 9 18 15 30 26
Above 45 1 2 6 12 10
84
Graph 13 : Fasting and post prandial HDL-C levels among the cases and
controls
In this study, in the fasting state 70% of the cases had HDL-C levels of
< 35 mg/dl as compared with that of control group wherein 60% of them had
HDL-C levels of <35 mg/dl.
Similarly in the post prandial state, 80% of the cases had HDL-C levels of
<35 mg/dl. as compared with that of control group wherein 58% of them had
HDL-C levels of <35 mg/dl.
70
60
80
58
22 20
18 30 8 20 2 12 0 10 20 30 40 50 60 70 80 90
Diabetic Control Diabetic Control
HDL-C _Fasting HDL-C _Post
P er ce n tag e
85
Table 17: Comparison of the mean fasting and post prandial HDL-C levels
among the cases and controls
HDL-C
Group N
Fasting Post
Mean SD p Mean SD p
Diabetic 50 33.44 11.42
0.316
30.96 11.04
0.04
86
Graph 14 : Comparison of the mean fasting and post prandial HDL-C
levels among the cases and controls
In this study, the cases had a mean HDL-C level of 33.44 ± 11.42 mg/dl in the
fasting state and 30.96 ± 11.04 mg/dl in the post prandial state. The controls had
a mean HDL-C level of 35.8 ± 11.99 mg/dl in the fasting state and 33.14 ±
11.15 mg/dl in the post prandial state
87
DISCUSSION
In the present study, fasting and post prandial lipid profile was done in 50
patients with type 2 diabetes mellitus and was compared with the fasting and
post prandial lipid profile in 50 healthy controls, age and sex matched, fulfilling
the inclusion and exclusion criteria.
Age distribution of cases and controls
In the present study, the study group constituted cases from age 31 to 70 years.
The majority of cases and controls were in the age group of 61-70 years which
constituted 40% of the total; followed by persons in the age group 51-60 years
who constituted 32% of the total study. The mean age was 57.32 ± 9.13 years
Sex wise distribution of the cases and controls
In this study, 60% of the study group were males and 40% of the study group
were females. Similarly the control group consisted of 60% males and 40%
88
Duration of diabetes among the study group
In this study 8% of the cases were newly detected with type 2 diabetes mellitus.
The duration of diabetes in 28% of cases was between 1 - 5 years, 52% between
6- 10 years and 12% of cases had diabetes for more than 10 years. In the control
group none of the patients had diabetes.
Prevalence of hypertension among the study group
In the present study, the prevalence of hypertension among the cases was 40%
and among the controls none of them had hypertension.
In the study done by Sumesh raj et al 54 the prevalence of hypertension was seen to be significantly higher in the cases (28%), which is consistent with our
89
Comparison of the mean fasting and post prandial lipid levels among the
cases and controls
Group N Mean SD p
F
ASTIN
G
TC Control 50 163.78 36.29
0.166 Diabetic 50 176.36 52.43
HDL-C Control 50 35.80 11.42
0.316 Diabetic 50 33.44 11.99
LDL-C Control 50 99.82 36.21
0.857 Diabetic 50 101.16 38.17
VLDL-C Control 50 26.20 13.41
0.003 Diabetic 50 36.76 20.01
TG Control 50 125.66 49.55
0.000 Diabetic 50 172.92 75.51
P OST P R AN DI AL
TC Control 50 165.42 35.36
0.323 Diabetic 50 173.30 43.56
HDL-C Control 50 33.14 11.04
0.04 Diabetic 50 30.96 11.15
LDL-C Control 50 103.74 35.60
0.383 Diabetic 50 97.38 36.93
VLDL-C Control 50 28.12 14.00
0.000 Diabetic 50 41.58 19.82
TG Control 50 133.66 48.79
90
Total Cholesterol levels among the cases and controls
In this study, in the fasting state, 24% of cases had total cholesterol levels of
>200 mg/dl as compared with the controls where 16% of them had total
cholesterol of >200 mg/dl. This association has a p value of 0.146, which is
statistically not significant. Hence, the pattern of distribution of patients in
different cholesterol levels was found to be similar in both cases and controls.
Similar observations were made in the studies done by SV Madhu et al.55 However, in the study done by Sumesh Raj et al 54 it was found that diabetics had significantly higher levels of TC compared to the controls (p <0.05)
In this study, the cases had a mean TC level of 176.36 ± 52.43mg/dl in the
fasting state and 176.72 ± 50.52 mg/dl in the post prandial state. The controls
had a mean TC level of 163.78 ± 36.29 mg/dl in the fasting state and 165.42 ±
35.36 mg/dl in the post prandial state. This association has a p value of 0.323,
which is statistically not significant. Hence, there was no significant increase in the post prandial TC level in the cases compared to that of the controls. Similar
observations were made in the studies done by SV Madhu et al 55 wherein the cases had a mean TC level of 209.45 ± 40.27 mg/dl in the fasting state and peak
mean TC level of 232.45 ± 53.13 mg/dl in the post prandial state. The controls
had a mean TC level of 197.6 ± 57.13 mg/dl in the fasting state and peak mean
91
LDL-C levels among the cases and controls
In this study, in the fasting state, 58% of cases had LDL-C levels of <100
mg/dl as compared with that of the control group where 46% of controls had
LDL-C of <100 mg/dl. This association has a p value of 0.266, which is
statistically not significant.
This does not correlate with the study done by sumesh raj et al 54 and SV
Madhu et al 55 which showed that LDL-C was higher in the diabetics than in the controls.
In this study, the cases had a mean LDL-C level of 101.16 ± 38.17 mg/dl in
the fasting state which is within the normal range. In the Strong Heart Study 56 done by Howard BV et al it was shown that, in American Indians, LDL
cholesterol level was the most significant predictor of increased CHD, despite
an average LDL cholesterol level of approximately 115 mg/dL in diabetics. In
the same study, LDL was a strong predictor of CHD at levels as low as 70mg/dl
In this study, the cases had a mean LDL-C level of 101.16 ± 38.17 mg/dl in
the fasting state and 97.38 ± 36.93 mg/dl in the post prandial state. The controls
had a mean LDL-C level of 99.82 ± 36.21 mg/dl in the fasting state and 103.74
± 35.6 in the post prandial state. This association has a p value of 0.383. Hence,
92
In our study though the diabetics had a decreased LDL-C in the post prandial
state, it was statistically insignificant. This does not correlate with a study done
by Lund et al57which showed that in diabetics, LDL-C decreased significantly post prandially (p < 0.005).
VLDL-C levels among the cases and controls
In this study, in the fasting state 28% of cases had total VLDL-C levels of
>40 mg/dl as compared with that of the control group where only 8% of them
had VLDL-C levels of >40mg/dl. This association has p value of 0.029 which is
statistically significant.
Thus cases with diabetes were found to have elevated VLDL-C levels when
compared with that of controls. This correlates with the study done by Angela A
Rivellese et al. 58
Similarly, in the post prandial state, 46% of cases had VLDL-C levels of >40
mg/dl as compared with that of control group, where 14% of them had VLDL-C
levels of >40 mg/dl. This association has a p value of 0.001 which is statistically
significant.
Thus cases with diabetes were found to have elevated post prandial VLDL-C
93
In this study, the cases had a mean VLDL-C level of 36.76 ± 20.01 mg/dl in
the fasting state and 41.58 ± 19.82 mg/dl in the post prandial state. The controls
had a mean VLDL-C level of 26.