ISSN 1818-6769
© IDOSI Publications, 2008
Corresponding Author: Dr. Majid Rashidi, Department of Agricultural Machinery, Faculty of Agriculture,
Prediction of Soil Available Phosphorus Based on Soil Organic Carbon
Mohsen Seilsepour, Majid Rashidi and Borzoo Ghareei Khabbaz
1 2 3
Varamin Soil and Water Research Department, Soil and Water Research Institute, Iran
1
Department of Agricultural Machinery, Faculty of Agriculture,
2
Islamic Azad University, Takestan Branch, Iran
Department of Agricultural Machinery, Faculty of Engineering and Surveying,
3
University of Southern Queensland, Australia
Abstract: There are many cases in which it is desirable to determine relationships among some soil physical and chemical properties. In soil studies, soil available phosphorous (AP) are often determined using laboratory tests, but it may be more suitable and economical to develop a pedotransfer function which uses some easily available soil properties. In this study, a pedotransfer function for predicting soil AP from soil organic carbon (OC) was suggested and soil AP was estimated as a function of soil OC. The soil AP predicted from the soil AP pedotransfer function was compared to the soil AP determined by laboratory test using the paired samples t-test and the Bland-Altman approach. The soil AP predicted by the soil AP pedotransfer function was not significantly different from the soil AP determined by laboratory test (P>0.05). The mean difference between the soil AP pedotransfer function and laboratory test was 1.57 ppm (95% confidence interval: -2.88 and 6.03 ppm; P = 0.453). The standard deviation of the soil AP differences was 7.01 ppm. The statistical results of the study indicated that the soil AP pedotransfer function provides an easy, economic and brief methodology to estimate soil AP and in order to predict soil AP based on soil OC the pedotransfer function AP = 0.7927 e 4.9922
with R = 0.92 can be recommended.
OC 2
Key words:Available phosphorous % Organic carbon % Pedotransfer function % Prediction % Modeling % Soil INTRODUCTION related industries contribute to plant growth through In recent years, there has been increased interest in properties of soil [1, 4]. Besides, previously researches agricultural practices associated with the application report that the availability of soil phosphorus is enhanced phosphorus fertilizers. Phosphorus in plants performs by adding organic matters, due to chelating of polyvalent unique function of energy transfer via formation of cations by organic acids and other decay products [4-6]. pyrophosphate bond. Phosphorus compounds (ADP Precise information on the quantity of soil available and ATP) act as energy currency within the plants and phosphorus can be obtained only with the aid of almost involve in wide range of plant processes from permitting laborious, costly and time consuming standard test cell division to developing good root system [1]. methods [7, 8]. However, for almost 50 years many Phosphorus is removed from the soil by plant uptake attempts have been made to predict some complex soil or lost by soil erosion and runoff. Crops remove varying properties from some easily available soil properties using amounts of phosphorus from the soil [2]. Also, the empirical models. In soil science, such empirical models availability of phosphorus in soils is often limited by are named pedotransfer functions [9, 10].
in Canada, respectively. Rashidi and Seilsepour [11] studied Varamin soils in Iran and proposed a pedotransfer function to predict soil CEC based on soil organic carbon (OC) and pH (PH) as CEC = 26.76 + 8.06 OC – 2.45 PH with R = 0.77. Seilsepour and Rashidi [12, 13] also predicted2
soil CEC from organic carbon using a pedotransfer function as CEC = 7.93 + 8.72 OC with R = 0.74.2
Moreover, the United States Salinity Laboratory (USSL) proposed one of the earlier pedotransfer function to predict soil exchangeable sodium percentage (ESP) from soil sodium adsorption ratio (SAR) as ESP = – 0.0126 + 0.01475 SAR for United States soils [14]. Furthermore, Al-Busaidi and Cookson [15] suggested a pedotransfer function to predict soil sodium adsorption ratio (SAR) based on soil electrical conductivity (EC) as SAR = 0.464 EC + 7.077 with R = 0.83 for saline soil in Oman.2
Since, the above pedotransfer functions have been derived from different saline-zone soils, the general pedotransfer functions between soil properties may be assumed to be similar to those. However, these pedotransfer functions have been shown not to be constant, but to vary substantially with both solution ionic strength and the dominant clay mineral present in the soil [16-19]. Therefore, the pedotransfer functions are not constant and should be determined directly for the soil of interest.
As previously researches report that there is a relationship between the availability of phosphorus in soil and soil organic matter [4-6], soil organic carbon (OC) can be used to estimate soil available phosphorus (AP). Despite the considerable amount of research done, which shows the relationship between soil AP and soil OC, very limited work has been conducted to develop a soil AP pedotransfer function based on soil OC. Therefore, the specific objective of the study presented here was to develop a soil AP pedotransfer function based on soil OC for calcareous soils of Varamin region in Iran and to verify the developed pedotransfer function by comparing its results with those of the laboratory tests.
MATERIALS AND METHODS
Experimental Procedure: Forty-eight soil samples were taken at random from different fields of experimental site of Varamin, Iran. The site is located at latitude of 35°-19'N and longitude of 51°-39'E and 1000 m above mean sea level, in arid climate in the center of Iran. The soil of the experimental site was a fine, mixed, thermic, Typic Haplocambids clay-loam soil. In order to obtain required parameters for determining soil AP pedotransfer function, some physical and chemical properties of the soil samples i.e. sand, silt, clay (% by weight) and pH were measured
Table 1: The mean values, Standard Deviation (S.D.) and Coefficient of Variation (C.V.) of soil physical and chemical properties of the forty-eight soil samples used to develop the soil AP pedotransfer function
Parameter Minimum Maximum Mean S.D. C.V. (%)
Sand (%) 14.0 44.00 33.10 6.31 19.10
Silt (%) 30.0 56.00 45.30 4.13 9.12
Clay (%) 9.00 50.00 22.00 6.65 30.20
pH 7.00 8.10 7.50 0.27 3.60
Organic carbon (%) 0.24 0.71 0.54 0.14 25.50
[image:2.612.314.540.261.338.2]Available phosphorus (ppm) 2.70 43.60 15.30 10.90 71.10
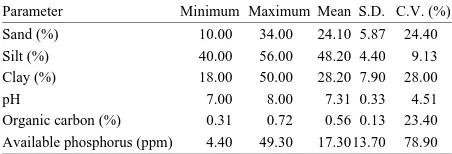
Table 2: The mean values, Standard Deviation (S.D.) and Coefficient of Variation (C.V.) of soil physical and chemical properties of the twelve soil samples used to verify the soil AP pedotransfer function
Parameter Minimum Maximum Mean S.D. C.V. (%)
Sand (%) 10.00 34.00 24.10 5.87 24.40
Silt (%) 40.00 56.00 48.20 4.40 9.13
Clay (%) 18.00 50.00 28.20 7.90 28.00
pH 7.00 8.00 7.31 0.33 4.51
Organic carbon (%) 0.31 0.72 0.56 0.13 23.40
Available phosphorus (ppm) 4.40 49.30 17.3013.70 78.90
using laboratory tests as described by the Soil Survey Staff [20]. Walkley and Black method [21] by oxidation with potassium dichromate using the heating-block modification of Heanes [22] was used to measure organic carbon (% by weight) of the soil samples. The method of Olsen and Sommers [23] was used to measure available phosphorus of the soil samples. Physical and chemical properties of the forty-eight soil samples used to determine the soil AP pedotransfer function are shown in Table 1. Also, in order to verify the soil AP pedotransfer function by comparing its results with those of the laboratory tests, twelve soil samples were taken at random from different fields of the experimental site. Sand, silt, clay, soil pH, organic carbon and available phosphorus of the soil samples, were measured using the same methods as previously mentioned. Physical and chemical properties of the twelve soil samples used to verify the soil AP pedotransfer function are shown in Table 2.
Regression model: In order to develop the soil AP pedotransfer function based on soil OC, typical exponential regression model was suggested as shown in Eq. (1):
Y = a e b X (1)
Where:
Statistical Analysis: A paired samples t-test and the mean difference confidence interval approach were used to compare the soil AP values predicted using the soil AP pedotransfer function with the soil AP values measured by laboratory tests. The Bland-Altman approach [24] was also used to plot the agreement between the soil AP values measured by laboratory tests with the soil AP values predicted using the soil AP pedotransfer function. The statistical analyses were performed using Microsoft Excel (Version 2003).
RESULTS
The p-value of the independent variable, Coefficient of Determination (R ) and Coefficient of Variation (C.V.) of2
the soil AP pedotransfer function are shown in Table 3. Based on the statistical result, the soil AP pedotransfer function was judged acceptable. The R value and C.V. of2
the soil AP pedotransfer function were 0.92 and 23.8%, respectively. The soil AP pedotransfer function is given in Eq. (2).
AP = 0.7927 e 4.9922 OC (2) DISSCUSSION
A paired samples t-test and the mean difference confidence interval approach were used to compare the soil AP values predicted using the soil AP pedotransfer function with the soil AP values measured by laboratory tests. The Bland-Altman approach [24] was also used to plot the agreement between the soil AP values measured by laboratory tests with the soil AP values predicted using the soil AP pedotransfer function.
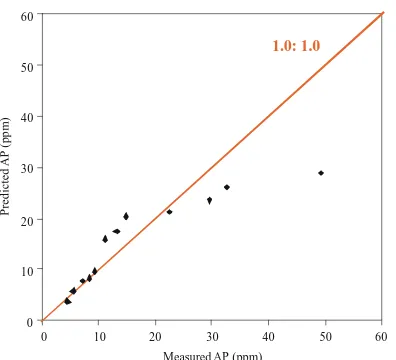
The soil AP values predicted by the soil AP pedotransfer function were compared with the soil AP values determined by laboratory tests and are shown in Table 4. A plot of the soil AP values determined by the soil AP pedotransfer function and laboratory tests with the line of equality (1.0: 1.0) is shown in Fig. 1. The mean soil AP difference between two methods was 1.57 ppm (95% confidence interval: -2.88 and 6.03 ppm; P = 0.453). The standard deviation of the soil AP differences was 7.01 ppm. The paired samples t-test
results showed that the soil AP values predicted with the soil AP measured by laboratory test. As the soil OC soil AP pedotransfer function were not significantly
different than the soil AP measured with laboratory tests (Table 5). The soil AP differences between these two
Table 3: The p-value of independent variable, Coefficient of Determination
(R ) and Coefficient of Variation (C.V.) of the soil AP pedotransfer2
function
Independent
Model variable p-value R2 C.V. (%)
[image:3.612.316.542.131.174.2]AP = 0.7927 e 4.9922 OC OC 2.44E-26 0.92 19.6
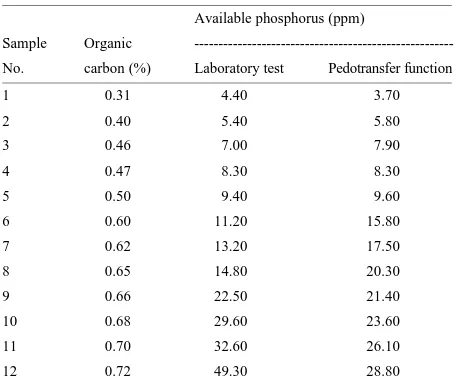
Table 4: Chemical properties of soil samples used in evaluating the soil AP
pedotransfer function
Available phosphorus (ppm)
Sample Organic
---No. carbon (%) Laboratory test Pedotransfer function
1 0.31 4.40 3.70
2 0.40 5.40 5.80
3 0.46 7.00 7.90
4 0.47 8.30 8.30
5 0.50 9.40 9.60
6 0.60 11.20 15.80
7 0.62 13.20 17.50
8 0.65 14.80 20.30
9 0.66 22.50 21.40
10 0.68 29.60 23.60
11 0.70 32.60 26.10
[image:3.612.314.541.210.403.2]12 0.72 49.30 28.80
Table 5: Paired samples t-test analyses on comparing soil available
phosphorus determination methods
Standard 95% confidence
Average deviation of intervals for the
Determination difference difference difference in
methods (ppm) (ppm) p-value means (ppm)
Laboratory test and
pedotransfer function 1.57 7.01 0.453 -2.88, 6.03
[image:3.612.312.542.439.520.2]0 10 20 30 40 50 60
0 10 20 30 40 50 60
Measured AP (ppm)
1.0: 1.0 P re d ic te d A P ( p p m ) -30 -20 -10 0 10 20 30
0 10 20 30 40 50 60 Average of measured and predicted AP (ppm)
[image:4.612.91.289.93.273.2]- 12.17 15.32 1.57 D if fe re n c e o f m e a s u re d a n d p re d ic te d A P ( p p m )
Fig. 1: Measured and predicted AP using the soil AP pedotransfer function with the line of equality (1.0: 1.0)
Fig. 2: Bland-Altman plot for the comparison of measured AP and predicted AP using the soil AP pedotransfer function; the outer lines indicate the 95% limits of agreement (-12.17, 15.32) and the center line shows the average difference (1.57) the soil AP. The average percentage differences for soil AP prediction using the soil AP pedotransfer function and laboratory test was 19.6%.
CONCLUSIONS
An exponential regression pedotransfer function based on soil organic carbon (OC) was used to predict soil available phosphorus (AP) of calcareous soils of Varamin region in Iran. The soil AP values predicted using the soil AP pedotransfer function was compared to the
soil AP values measured by laboratory tests. The paired samples t-test results indicated that the difference between the soil AP values predicted by the soil pedotransfer function and measured by laboratory tests were not statistically significant (P>0.05). Therefore, the soil AP pedotransfer function can provide an easy, economic and brief methodology to estimate soil AP.
ACKNOWLEDGMENTS
The financial support provided by the Agricultural Extension, Education and Research Organization of Iran under research award number 100-15-76048 is gratefully acknowledged.
REFERENCES
1. Meena, S., P. Senthilvalavan, M. Malarkodi and R.K. Kaleeswari, 2007. Residual effect of phosphorus from organic manures in sunflower - assessment using radio tracer technique. Res. J. Agric. Biol. Sci., 3: 377-379.
2. Manunta, P., L. Kryzanowski and D. Keyes, 2001. Mapping soil-available phosphorus: considering changes in crop yield and fertilizer sales. Better Crops, 85: 8-10.
3. Di, H.J., R. Harrison and A.S. Campbell, 1994. Assessment of methods for studying dissolution of phosphate fertilizers of differing solubility in soil. I. An isotopic method. Fert. Res., 38: 1-9.
4. Reddy, S.S., B. Sivaraj, V.C. Reddy and M.C. Ananda 2005. Direct effect of fertilizers and residual effect of organic manures on yield and nutrient uptake of maize (Zea mays L.) in groundnut-maize cropping system. Crop Research, 29: 390-395.
5. Jama, B., A.S. Rob and R.J. Buresh, 1997. Agronomic and economic evaluation of organic and inorganic sources of phosphorus in Western Kenya. Agron. J., 89: 597-604.
6. Mohanty, S., N.K. Paikaray and A.R. Rajan, 2006. Availability and uptake of phosphorus from organic manures in groundnut (Arachis hypogea L.)-corn (Zea mays L.) sequence using radio tracer technique. Geoderma, 133: 225-230.
7. Bray, R.H. and L.T. Kurtz, 1945. Determination of total, organic and available forms of phosphorus in soils. Soil Sci., 59: 39-45.
[image:4.612.84.287.316.507.2]9. MacDonald, K.B., 1998. Development of pedotransfer 18. Marsi, M. and V.P. Evangelou, 1991. Chemical and functions of southern Ontario soils. Report from
greenhouse and processing crops research center. Harrow, Ontario, No.: 01686-8-0436, pp: 1-23. 10. Krogh, L., H. Breuning and M.H. Greve, 2000. Cation
exchange capacity pedotransfer function for Danish soils. Soil and Plant Sci., 50: 1-12.
11. Rashidi, M. and M. Seilsepour, 2008. Modeling of soil cation exchange capacity based on some soil physical and chemical properties. ARPN J. Agric. Biol. Sci., 3: 6-13.
12. Seilsepour, M. and M. Rashidi, 2008a. Modeling of soil cation exchange capacity based on soil colloidal matrix. Am-Euras. J. Agric. Environ. Sci., 3: 365-369.
13. Seilsepour, M. and M. Rashidi, 2008b. Prediction of soil cation exchange capacity based on some soil physical and chemical properties. World Appl. Sci. J., 3: 200-205.
14. Richards, L.A., 1954. Diagnosis and improvement of saline and alkali soils. United States Department of Agriculture, Washington, DC.
15. Al-Busaidi, A.S. and P. Cookson, 2003. Salinity-pH relationships in calcareous soils. Agricultural and Marine Sciences, 8: 41-46.
16. Shainberg, I., J.D. Oster and J.D. Wood, 1980. Sodium-calcium exchange in montmorillonite and illite suspensions. Soil Sci. Soc. Am. J., 44: 960-964. 17. Nadler, A. and M. Magaritz, 1981. Expected
deviations from the ESP-SAR empirical relationships in calcium and sodium-carbonate-containing arid soils: field evidence. Soil Sci., 131: 220-225.
physical behavior of two Kentucky soils: I. Sodium-calcium exchange. J. Environ. Sci. Health, Part A: Toxic-Hazardous Substances and Environmental Engineering, 267: 1147-1176.
19. Evangelou, V.P. and M. Marsi, 2003. Influence of ionic strength on sodium-calcium exchange of two temperate climate soils. Plant and Soil, 250: 307-313. 20. Soil Survey Staff, 1996. Soil survey laboratory
methods manual. Soil Survey Investigations Rep. 42. Version 3.0. U.S. Gov. Print. Washington, DC.
21. Walkely, A. and I.A. Black, 1934. An examination of the Degtjareff method for determining soil organic matter and a proposed modification of the chromic acid titration method. Soil Sci., 37: 29-38.
22. Heanes, D.L., 1984. Determination of total organic C in soils by an improved chromic acid digestion and spectrophotometric procedure. Comm. Soil Sci. Plant Anal., 15: 1191-1213.
23. Olsen, S.R. and L.E. Sommers, 1982. Phosphorus. In: Methods of Soil Analysis, A.L. Page et al. (Eds.). Part 2, ASA and SSSA, Madison, WI., pp: 403-430. 24. Bland, J.M. and D.G. Altman, 1999. Measuring