INTRODUCTION
Light plays an influential role in the ecology and behaviour of most animals, and the structure and phys-iology of visual systems show adaptations to both the intensity and spectral quality of environmental light (Walls 1942, Lythgoe 1979, 1984). Because aquatic sys-tems provide a natural diversity of spectral environ-ments, our understanding of the significance of spe-cies-specific spectral sensitivity has been increased by a wealth of studies on adult teleost visual pigments (Partridge & Cummings 1999 for review). The spectral characteristics of marine waters can vary substantially both vertically and horizontally (Jerlov 1976). Inshore
waters close to continental land masses tend to be eutrophic, with peak transmission in the green-yellow region of the spectrum, while offshore and oceanic waters tend to be relatively oligotrophic with peak transmission in the blue region of the spectrum (Jerlov 1976). Increasing depth further enhances the spectral differences between the different water types as the downwelling light becomes progressively monochro-matic and centred around the wavelength of peak transmission (Partridge 1990, Nilsson 1996). A good match between the spectral absorption characteristics of the double cone photoreceptors of fishes and the spectral transmission characteristics of their habitat has been found (reviewed in Lythgoe 1984, Partridge 1990, Wehner 1997, Partridge & Cummings 1999). For example, fishes living in clear ‘blue’ oligotrophic waters possess double cones, which are more sensitive
© Inter-Research 2001
*E-mail: [email protected]
Spectral sensitivity of larval and juvenile coral reef
fishes: implications for feeding in a variable light
environment
Suresh D. Job
1, Julia Shand
2,*
1Department of Marine Biology, James Cook University of North Queensland, Townsville, Queensland 4811, Australia 2Department of Zoology, University of Western Australia, Crawley, Western Australia 6907, Australia
ABSTRACT: The spectral sensitivity of larval and juvenile stages of 3 species of coral reef fishes, Apogon compressus (Apogonidae), Pomacentrus amboinensis (Pomacentridae) and Premnas biac-uleatus(Pomacentridae) has been investigated using feeding behaviour. Ontogenetic and taxonomic differences in spectral sensitivity were determined by establishing the minimum light intensity at which larvae and juveniles could strike prey at 12 restricted wavelength bands between 355 and 650 nm. Following construction of chromatic action spectra, the wavelength of maximum sensitivity (λmax)
and the median wavelength (λP50) of the 3 species were found to be located close to 500 nm. All 3
spe-cies increased in sensitivity during growth, with A. compressusbecoming the most sensitive prior to settlement. Ontogenetic shifts in spectral sensitivity towards longer wavelengths occurred in P. amboinensisand P. biaculeatus, but not in A. compressus. Spectral efficiency (wavelength-depen-dent efficiency of photon capture) was modelled for eutrophic and oligotrophic coral reef waters (Jerlov types Oceanic IA, Oceanic III and Coastal 1) at 2 different optical depths. Spectral efficiency was highest in the intermediate coral reef water type (JOIII) in all 3 larval fish taxa throughout early ontogeny, regardless of water depth. The results imply that the larvae would be able to feed across a broad spectrum of coral reef water types and depths.
KEY WORDS: Colour vision · Chromatic action spectrum · Feeding behaviour · Ontogeny · Pomacentridae · Apogonidae
to short wavelengths than closely related species from ‘greener’ eutrophic waters (Lythgoe et al. 1994). Simi-larly, the spectral positioning of double cones and the increasingly monochromatic short wavelength-shifted light environment of deeper waters appear to be corre-lated (Bowmaker et al. 1994).
During the pelagic stage, larvae of coral reef fish may be transported by hydrographic processes across a range of water types (Williams et al. 1984, Doherty et al. 1995, Roberts 1997) and it is also known that there are depth-specific habitats for different larval taxa. For example, apogonids live at deeper depths than poma-centrids (Leis 1991a,b, 1993, Boehlert et al. 1992). Thus, both the spectral characteristics and light inten-sity of the ambient light environment the larvae of dif-ferent taxa experience will differ from each other as well as from that of the reef-associated adults. How-ever, nothing is known about inter-specific differences in the spectral sensitivity of coral reef fish during larval stages, and it is inappropriate to reconcile adaptations of adults to the variable conditions experienced by lar-vae (Warner 1997).
Many marine teleosts hatch with a rudimentary visual system, with only 1 type of photoreceptor, and during the subsequent pelagic larval stage the structure of the eye undergoes rapid changes as the adult complement of photoreceptors becomes differentiated (Shand et al. 1999a for review). It has recently been shown that the larvae of those taxa, such as Apogonidae, living in deeper water have greater sensitivity in low light conditions (Job & Bellwood 2000). However, it is not known whether interspecfic differences in spectral sensitivity of deeper-living larvae are tuned to increase sensitivity to the spectrally restricted downwelling light experienced by the deeper-living taxa. Nor is it known how spectral sensitivity changes as the full complement of photoreceptors develops.
In this study, we compare ontogenetic changes in spectral sensitivity in 3 species of coral reef fishes dur-ing the dispersive pelagic larval stage and early ben-thic juvenile stage. The wavelength-specific minimum light intensity at which a fish larva is able to detect and strike at live wild-caught zooplankton is used to con-struct action spectra and provide a measure of spectral sensitivity at different stages in larval and early juve-nile development. The results are used to model wave-length-dependant spectral efficiency of each species in eutrophic and oligotrophic waters at different depths.
MATERIALS AND METHODS
Study species.Three species were examined: a cardi-nalfish (family Apogonidae: Apogon compressus); a damselfish (family Pomacentridae, subfamily
Pomacen-trinae: Pomacentrus amboinensis); and an anemonefish (family Pomacentridae, subfamily Amphiprioninae: Premnas biaculeatus). These species are widespread on Indo-Pacific coral reefs. Adult A. compressus are nocturnal planktivores, adult P. amboinensis are broadly omnivorous and adult P. biaculeatus are pri-marily diurnal planktivores. The larvae of all 3 species are diurnal planktivores. In clear oceanic coral reef wa-ters, larval damselfishes are observed primarily in the upper levels of the water column (0 to 50 m) while lar-val cardinalfishes are more deeply distributed (50 to 200 m) (Boehlert et al. 1992). The distribution patterns of larval anemonefishes are unknown due to their rarity in field ichthyoplankton samples.
Newly hatched larvae of the 3 species were obtained from captive breeding adults and reared in 200 l glass aquaria at 27 to 29°C under a 14:10 h light:dark photo-period. The rearing conditions were broadly similar to those on the Great Barrier Reef lagoon during the sum-mer peak reproductive period. The larvae were reared according to standard protocols (Job et al.1997) under broad spectrum lighting (combination of 1 Osram Bio-lux and 3 Daylight fluorescent tubes; 6500 and 5500 K respectively). Larvae were fed with wild-caught, size-sorted zooplankton (copepod nauplii and copepodites) throughout the larval stage to ensure that there was no conditioning to abnormal prey items (e.g. rotifers). Mean prey width was maintained at approximately 4% of larval standard length (SL).
Experimental procedure. The set-up and protocol for the experiments are based on Loew et al. (1993). Light was spectrally filtered using narrow-band interference filters [Andover Corp., New Hampshire, USA; approxi-mately 10 nm half-bandwidth (FWHM), with out-of-band blocking to at least 1000 nm] before reaching an experimental tank. Larvae were tested at 12 wave-length bands with central wavewave-lengths ranging from 365 to 650 nm (365, 400, 420, 450, 470, 500, 523, 550, 577, 600, 620 and 650 nm). The different wavelength bands were tested in a random sequence. UV photo-sensitivity was assessed within the approximate
spec-tral range of 355 to 375 nm by using a UV light source (Osram HQV 125 W; spectrum similar to that given in Viitala et al. 1995) in conjunction with the 365 nm cen-tral wavelength interference filter (8.5 nm FWHM). Light sources for visible wavelengths were a metal halide lamp (Osram 150 W Daylight bulb) for wave-length bands centred at 400 nm and 420 nm, and a quartz-halogen dichroic lamp (Osram 100 W bulb) for the other wavelengths. The intensity of light reaching the tank was varied by using metallic-coated neutral density filters (Andover Corp., optical densities ranging from 0.2 to 2). Larval feeding behaviour was captured using an infra-red sensitive video camera located above the tank and imaged onto a monitor. An infra-red diode illuminator (880 ± 25 nm) was used to provide sufficient illumination for the video camera. Controls (n = 72) with no additional light source, recorded no feeding behav-iour or directed movement in the larvae at any age.
Twelve sets of 5 larvae were sampled on each exper-imental day (1 set for each wavelength band) after being deprived of food for at least 10 h (i.e. overnight). Each set of larvae was placed in a 170 mm long ×120 mm wide ×120 mm high glass experimental tank contain-ing filtered seawater (approximately 2.2 l volume). The outer surface and base of the experimental tanks were painted black, with the exception of a window where the infra-red diode illuminator was placed. Larvae were light adapted for approximately 30 min under low-intensity broad spectrum lighting (5500 K metal halide daylight bulb) prior to initiating a trial. Follow-ing acclimation, prey organisms (wild-caught zoo-plankton) were added gradually to the experimental tank in small aliquots until a density of 1 to 2 ml–1was
obtained. The use of natural prey ensured that larvae were presented with prey displaying movement pat-terns that closely replicated those of prey in the field. Prey sizes were scaled to larval size (approximately 4% of larval length), being greater than the visual acu-ity threshold of the larvae in full spectrum lighting (cf. Job & Bellwood 1996).
[image:3.612.39.293.79.477.2]During a trial, larval feeding behaviour was ob-served on the monitor. Initial pilot data had deter-mined that there were no differences in the light inten-sity of the feeding threshold whether the experiment was conducted from high to low intensities, or low to high intensities. However, an increased time lag was involved in the low to high direction during light adap-tation and the high to low regime was subsequently followed. To prevent selective adaptation of different cone mechanisms, the first observations were carried out using as dim a light as possible (no greater in inten-sity than 1 log unit above that needed to initiate a response). The light intensity was then decreased gradually by adding neutral density filters until feed-ing ceased. If no feedfeed-ing events occurred within
Fig. 1. Growth and developmental schedules ofPomacentrus amboinensis, Premnas biaculeatusand Apogon compressus. (A) Growth in standard length with post-hatch age. (B) Rela-tionship between eye diameter and standard length. Note that P. biaculeatushatches at a more advanced stage of devel-opment and undergoes flexion and settlement at an earlier age (post-hatch). Values for standard length and eye diameter
are means ± SE. n = 60. After Job (2000)
A
10 min, the light intensity was then increased gradu-ally, by altering the light intensity by 0.2 log units until feeding recommenced. This process was then repeated until a consistent light threshold was obtained by observing successful feeding at least 3 times. The threshold of light intensity for feeding was determined as the minimum light intensity at which at least 1 larva was able to strike consistently at live wild-caught zoo-plankton in 2 consecutive trials. Functional sensitivity at that wavelength band was then calculated as the reciprocal of the minimum light intensity for feeding. Larval feeding behaviour was clearly visible as the younger larvae formed a distinct S-shaped posture and tracked the prey before striking (Job & Bellwood 1996). Older larvae tracked the prey and displayed a prominent tail cocking prior to striking. Strikes pre-ceded by larvae swimming directly into prey were ignored. The experiments were repeated on 3 separate batches of larvae for each species, resulting in 3 repli-cates for each wavelength band and age.
Given the shallow, clear water and that larvae gen-erally fed close to the surface in the experimental tanks, it was assumed that the difference between the surface light intensity and that where the larvae fed would have been minimal. Light intensities at the sur-face for UV wavelengths (< 400 nm) were measured with an International Light IL1702 UV-A sensor (315 to 390 nm range). For wavelengths greater than 410 nm, surface light intensities down to 0.005 µE m–2 s–1
(1 Einstein = 1 mole quanta = 6.022E+ 23 photons) were measured with a Li-Cor LI-192SA quantum sensor (Photosynthetically Active Radiation [PAR] sensor, 400 to 700 nm range). Light intensities below 0.005 µE m–2
s–1were outside the accurate range of the sensor and were calculated based on the measured transmission characteristics of the neutral density filters. Wave-length-specific correction factors based on the sensor’s spectral characteristics (Li-Cor Corp.) were used to adjust for spectral unevenness in the performance of the sensor over narrow band-widths (Tarrant 1989). Intensities at 400 nm (approximately 395 to 405 nm FWHM) were outside the accurate spectral range of both the PAR and UV-A sensors and were measured using a silicon photodiode (RS Components, USA). A cosine correction factor was empirically derived by comparing the response of the photodiode to that of the Li-Cor and International Light sensors at the other 11 wavelength bands. This factor was then used to correct the response of the photodiode at 400 nm. It should be noted that this method of obtaining the cosine correc-tion factor may introduce a possible error as the cosine response of the Li-Cor and International Light sensors may themselves be limited to a narrow waveband.
Data analysis. The reciprocal of the minimum light intensity for feeding was calculated to obtain a linear
sensitivity scale (sensuLoew et al. 1993) and the mean linear sensitivity for each larval age at each experi-mental wavelength band was calculated. Because threshold light intensities for feeding involve physio-logically supra-threshold stimuli and supra-threshold wavelength discrimination operates on a log scale (McMahon & MacLeod 1998), the linear sensitivity results are displayed on a log (base 10) scale (log sen-sitivity). To compare the chromatic sensitivity differ-ences both within and between taxa at selected stages of development across the region of the spectrum investigated, the linear sensitivity values for each batch were normalised (i.e. expressed as a percentage of the maximum sensitivity value for that batch) at selected ages within each species. The mean nor-malised sensitivity was then calculated from the 3 batches for each species at each of the selected ages.
Because the spectral distributions were skewed, the median wavelength (that which divides the total num-ber of photons under the linear sensitivity curve into 2 halves) (λP50) (sensu McFarland 1991a) was calculated
for each species, for each batch, at each age, from the linear sensitivity data. The mean λP50values for each
age were then calculated. Similarly, the mean wave-length of peak sensitivity (mean λmax) for each species
was calculated from the nominal peak sensitivity val-ues (λmax) of each batch at each age from the linear
sensitivity data. Analysis of variance was used to com-pare the mean λP50values at different ages within a
species. As the spectral range over which sensitivity was measurable was narrower in the young larvae, the λP50 values for the analysis were calculated over the
spectral range of 400 to 620 nm at all ages in all the 3 species. Data for 400 and 620 nm in the youngest Pomacentrus amboinensislarvae were estimated from the linear sensitivity graphs. Non-parametric ANOVA (Kruskal-Wallis Test) was used to compare the mean λmaxvalues at different ages within species.
which the pomacentrine pomacentrid larvae would be expected to occur, but at which apogonid larvae would not be expected. The deeper depths are those at which the apogonid larvae would be relatively abundant, but at which the damselfish larvae would be absent (Leis 1991a,b). The field normalised down-welling spectral irradiance curves for each of the water types/depths are shown in Fig. 2. All 3 shallow depths represent similar optical depths in terms of light intensity (in quanta), as do the 3 deeper depths (Jerlov 1976).
The effective spectral sensitivity of each batch of lar-vae at specified ages was calculated as the product of the normalised linear sensitivity of the larvae and the normalised down-welling spectral irradiance in the field (cf. Endler 1986, Lythgoe et al. 1994). The relative spectral efficiency of photon capture by the young fishes at different depths in different water types was used for comparison across the taxa and ages using analysis of variance (for further details see Job 2000). Modelling the spectral distribution of downwelling light. The effective depth to which different wave-lengths penetrate and are detected is a function of both the wavelength-dependent attenuation characteristics of the different water types and the functional spectral sen-sitivity of the larvae. Using the diffuse attenuation coef-ficients for marine waters (Jerlov 1976) and the surface irradiance values for tropical reef waters (Lesser 1995), the approximate depths to which light of a specified wavelength length could penetrate and be used for feed-ing can be estimated by rearrangfeed-ing the equation:
(1) Where Ifis the minimum light intensity for feeding in
W m–2s–1, I
0is the surface irradiance in W m–2s–1, Kis
the diffuse attenuation coefficient and Dis the depth in metres (Lythgoe et al. 1994). Dwas estimated, in the 3 Jerlov water types used above, for early- and mid-stage larvae.
RESULTS
Ontogenetic and inter-taxon differences
The spectral range over which feeding was measur-able was restricted to approximately 400 to 620 nm in the early stage larvae. With growth, the larvae were able to feed using both shorter and longer wavelengths and the chromatic action spectra were extended to cover 365 to 650 nm. The sensitivity of the larvae of all 3 species increased during ontogeny (Fig. 3, Table 1). For example, an approximately 3.5-fold increase in sensitivity was recorded at 500 nm in Apogon com-pressus. The increase in sensitivity appeared to be most rapid during the pelagic larval stage with post-settlement increases in the juveniles being of smaller magnitude (Fig. 3). In all 3 species the λP50values were
distributed over similar wavelengths, ranging from a mean of approximately 493 nm in pre-flexion Premnas biaculeatus to 513 nm in juvenile Pomacentrus amboinensis(Table 2). During ontogeny the λP50
esti-mates of each species tended towards longer wave-lengths, although the shift in sensitivity was only sig-nificant in the two pomacentrid species (Table 3). The λmax values covered a similar range to the λP50
[image:5.612.44.289.77.515.2]If = I0e−KD
Fig. 2. Normalised irradiance spectra (%) in 3 water types at 2 different depths. (A) Normalised irradiance spectra at shallow depths. (B) Normalised irradiance spectra at moderate depths. Data points calculated for the same wavelengths as used in the experiments. All values were converted to µE m–2 s–1
before normalisation. After Job (2000)
A
mates, however the tendency for a shift towards longer wavelength sensitivity during ontogeny was only sig-nificant in P. biaculeatus, in which values increased from 490 to 523 nm (Tables 2 & 3).
The normalised linear sensitivity values for the 3 spe-cies were compared at 3 different larval stages (Fig. 4). In the early-stage (pre-flexion and flexion) larvae (ages 2, 6 and 6 for Premnas biaculeatus, Pomacentrus
am-Fig. 3. Ontogenetic changes in log10 spectral sensitivity in
[image:6.612.60.262.150.687.2](A) Pomacentrus amboinensis, (B) Premnas biaculeatus, (C)Apogon compressus. See Table 1 for raw sensitivity data
Fig. 4. Normalised spectral sensitivity in (A) the early stage larvae of Pomacentrus amboinensis(Day 6), Premnas biac-uleatus(Day 2) and Apogon compressus(Day 6). (B) Mid-stage post-flexion larvae of P. amboinensis(Day 15),P. biaculeatus (Day 6) and A. compressus(Day 15). (C) Post-settlement juve-niles of P. amboinensis(Day 27),P. biaculeatus(Day 14) and
A. compressus(Day 27)
A
A
B
C
C
[image:6.612.307.525.154.644.2]boinensis and Apogon compressus respectively), the normalised spectral sensitivity of the P. biaculeatus lar-vae are slightly short wavelength-shifted, while that of the A. compressuslarvae is slightly long wavelength-shifted compared to P. amboinensislarvae (Fig. 4A). In the mid-stage post-flexion larvae (ages 6, 15 and 15 for P. biaculeatus, P. amboinensisand A. compressus re-spectively), P. biaculeatus larvae have a broader spectral sensitivity distribution than the other 2 species (Fig. 4B). In the post-settlement juveniles (ages 14, 27 and 27 for P. biaculeatus, P. am-boinensis and A. compressus respectively), the spectral distributions of the P. amboinensisand A. compressuslarvae were similar in shape, but with the λmaxof P. amboinensislocated at longer
wave-lengths (Fig. 4C). In contrast, the λmaxof P.
biac-uleatuslarvae was similar to P. amboinensis.The appearance of a secondary peak, at approxi-mately 470 nm, in the post-settlement P. biaculea-tusjuveniles was not found to be significant (sin-gle factor ANOVA showed no difference in the minimum light intensity for feeding at 470, 500 and 523 nm (F= 0.336; df = 2.6; p = 0.727)).
Effective spectral sensitivity
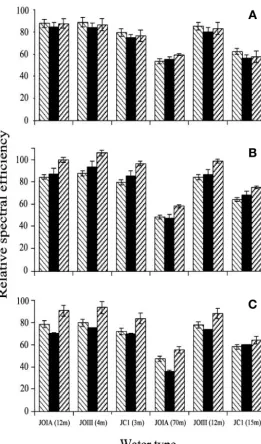
The relative spectral efficiency of the young fishes differed significantly between species, de-velopmental stages (age categories), water types and depths (Table 4). Of the first order interac-tions, 3 were significant, suggesting that some of the main effects need to be interpreted with cau-tion (Zar 1999). Nevertheless, some general pat-terns are clear. All the 3 species display greater relative spectral efficiency in shallow reef waters than in deeper water of the same type. However,
relative spectral efficiency in JOIII waters remained high even at greater depths (Fig. 5). Patterns between species were less consistent and varied depending on developmental stage with differences being minimal in the early stage larvae, but becoming more pro-nounced during development (Fig. 5). ThePremnas bi-aculeatus larvae displayed markedly higher spectral efficiency than the other 2 species after flexion. In con-trast, the spectral efficiency of the Pomacentrus am-boinensis and Apogon compressus larvae remained broadly similar until after settlement.
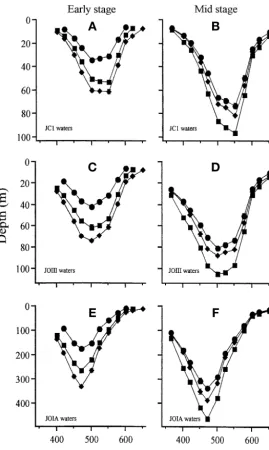
Estimates of feeding at depth
The possible effect of different water types on the depth at which the different species may be able to feed, at 2 different stages of development, is shown in Fig. 6. In eutrophic coastal reef waters, the effective depth range for feeding may be less than 100 m and the wavelengths of maximum sensitivity for feeding in all 3 species shifted towards longer wavelengths (Fig. 6A,B) compared with JOIII waters (Fig. 6 C,D). In the clearest coral reef waters (JOIA, Jerlov 1976), shorter wave-lengths penetrate deepest and long wavewave-lengths are
at-Table 1. Reciprocal of mean minimum light intensity for feed-ing, in the 3 species at 3 ages, at the most sensitive wave
length (µE m–2s–1)
Mean sensitivity SE Wavelength (nm)
Apogon compressus
Day 6 21.04 5.29 500
Day 15 3218.07 446.64 523
Day 27 39902.73 7820.20 500
Pomacentrus amboinensis
Day 6 2.13 0.42 500
Day 15 187.31 36.53 500
Day 27 5436.51 1325.16 523
Premnas biaculeatus
Day 2 82.79 16.43 500
Day 6 392.44 47.83 500
[image:7.612.61.287.121.279.2]Day 14 942.72 301.54 523
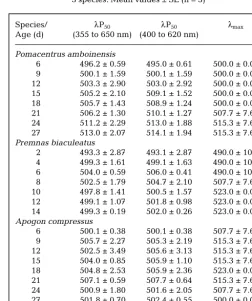
Table 2. Ontogenetic changes in the λP50and λmaxvalues of the
3 species. Mean values ± SE (n = 3)
Species/ λP50 λP50 λmax
Age (d) (355 to 650 nm) (400 to 620 nm)
Pomacentrus amboinensis
6 496.2 ± 0.59 495.0 ± 0.61 500.0 ± 0.00 9 500.1 ± 1.59 500.1 ± 1.59 500.0 ± 0.00 12 503.3 ± 2.90 503.0 ± 2.92 500.0 ± 0.00 15 505.2 ± 2.10 509.1 ± 1.52 500.0 ± 0.00 18 505.7 ± 1.43 508.9 ± 1.24 500.0 ± 0.00 21 506.2 ± 1.30 510.1 ± 1.27 507.7 ± 7.67 24 511.2 ± 2.29 513.0 ± 1.88 515.3 ± 7.67 27 513.0 ± 2.07 514.1 ± 1.94 515.3 ± 7.67 Premnas biaculeatus
2 493.3 ± 2.87 493.1 ± 2.87 490.0 ± 10.00 4 499.3 ± 1.61 499.1 ± 1.63 490.0 ± 10.00 6 504.0 ± 0.59 506.0 ± 0.41 490.0 ± 10.00 8 502.5 ± 1.79 504.7 ± 2.10 507.7 ± 7.67 10 497.8 ± 1.41 500.5 ± 1.57 523.0 ± 0.00 12 499.1 ± 1.07 501.8 ± 0.98 523.0 ± 0.00 14 499.3 ± 0.19 502.0 ± 0.26 523.0 ± 0.00 Apogon compressus
[image:7.612.283.536.421.722.2]tenuated relatively rapidly (Fig. 2) so that although feeding may be possible at greater depths, maximum sensitivity would be at even shorter wavelengths (Fig. 6E,F). In all water types, sensitivity of larvae in-creases during development but the potential feeding depth of the Apogon compressuslarvae increases rela-tive to that of the Premnas biaculeatuslarvae (Fig. 6).
DISCUSSION
Spectral sensitivity and ambient light: coastal versus oceanic water
Pomacentrids and apogonids, like most coral reef fishes, have a bipartite life history, undergoing their early development in the pelagic environment (Leis 1991a,b, 1993). During this time they can occupy a range of light environments, depending upon depth within the water column and proximity to land. The λP50 (irradiance) values of light in shallow coral reef
waters range from approximately 490 nm in oligo-trophic reef waters to approximately 530 nm in more eutrophic reef waters (McFarland 1991a,b, Lesser 1995, Maritorena & Guillocheau 1996). The spectral sensitiv-ity of the larvae of Apogon compressus, Pomacentrus amboinensisand Premnus biaculeatus, assessed in this study by feeding behaviour, is located in similar regions of the spectrum, with their λP50 values ranging
between 493 and 507 nm. Therefore, the relative spec-tral efficiency of the 3 species remains high across a range of water types at shallow depths and these spe-cies appear to be well adapted to the range of possible photic conditions in shallow coral reef waters.
[image:8.612.30.291.77.521.2]Modelling the relative sensitivity of the 3 experimen-tal species, using irradiance data for 3 water types at 2 different depths, shows how the nature of the photic environment could affect the functional sensitivity of larvae. In coastal waters, the greater attenuation of short wavelength radiation relative to oceanic waters means larvae transported into eutrophic reef waters will be in a light environment with relatively fewer short wavelength photons. In contrast, oligotrophic waters reduce spectral efficiency by preferentially re-ducing the effectiveness of long wavelength sensitiv-ity. The coral reef species studied here all display the highest spectral efficiency in JOIII waters, which tend to be intermediate between oceanic and coastal waters in terms of spectral composition. Locating the spectral
Fig. 5. Relative spectral efficiency of (■) Pomacentrus ambo-inensis, ( ) Premnas biaculeatus, and ( ) Apogon compres-sus, in the different water types and depths. (A) Early stage larvae (Days 2, 6 and 6 for Premnas biaculeatus, Pomacentrus amboinensisand Apogon compressusrespectively). (B) Mid-stage post-flexion larvae (Days 6, 15 and 15 for P. biaculeatus, P. amboinensis and A. compressusrespectively). (C) Post-settlement juveniles (Days 14, 27 and 27 for P. biaculeatus,
P. amboinensisand A. compressusrespectively)
Table 3. Statistical comparison of the ontogenetic change in λP50(400 to 620 nm) and λmaxvalues in the 3 species
λP50(1-way ANOVA)
Pomacentrus amboinensis F= 14.77 df = 7, 16 p < 0.001* Premnas biaculeatus F= 6.60 df = 6, 14 p = 0.002* Apogon compressus F= 2.01 df = 8, 18 p = 0.104
λmax(Kruskal-Wallis test)
Pomacentrus amboinensis χ2= 11.38 df = 7 p = 0.123
Premnas biaculeatus χ2= 16.44 df = 6 p = 0.012*
Apogon compressus χ2= 10.56 df = 8 p = 0.227
A
[image:8.612.307.537.110.230.2]sensitivity at longer wavelengths would reduce ex-ploitation of oligotrophic waters, whereas sensitivity shifted to shorter wavelengths would further disadvan-tage larvae carried into eutrophic waters. With spectral sensitivity tuned to intermediate reef waters, the lar-vae are still able to detect enough light for feeding at a range of depths in both coastal and oceanic waters, de-spite the reduction in spectral efficiency. Thus,
al-though reef fish larvae may be vulnerable to transportation by water currents (Roberts 1997), it would appear that their spectral sensitivity allows exploitation of a range of spectral environments.
Spectral sensitivity and ambient light: shallow versus deep water
Field evidence from a range of coral reef water types suggest that the larvae from the family Apogonidae are generally distributed at moder-ate depths, down to at least 200 m in clear oceanic waters (Boehlert et al. 1992). In comparison, lar-vae from the pomacentrid subfamily Pomacentri-nae are generally distributed at shallow depths, less than 50 m in clear oceanic waters. It is at greater depths that the importance of matching spectral sensitivity to the available light spectrum is likely to become visually significant, because increasing depth results in a marked reduction in both the intensity and spectral bandwidth of the available light (Jerlov 1976, Nilsson 1996). One mechanism whereby fishes can increase their photon capture rates is through matching their spectral sensitivity to the ambient light. Such spectral tuning has been observed in the cottoid fishes of Lake Baikal, in which species living in deeper water have double cones absorbing shorter wavelengths than shallow living species (Bowmaker et al. 1994). However, in the present study, we have not found the spectral efficiency of Apogon compressuslarvae to be tuned to the nar-row bandwidth light of deeper water.
[image:9.612.42.312.80.531.2]Vertebrates possess a number of other mecha-nisms for increasing the photon capture, indepen-dent of spectral matching (Land 1981, Warrant 1999 for reviews). The apogonids may therefore be able to increase their sensitivity in other ways. These could include: increasing photoreceptor size (van der Meer 1994, Shand 1997, Pankhurst & Hilder 1998); increasing convergence ratios of photoreceptors to higher order neurones (van der Meer et al. 1995, Fuiman and Delbos 1998); or changes in relative eye dimensions resulting in a reduction in Matthiessen’s ratio (McFarland 1991a, Shand et al. 1999b, Job & Bellwood 2000). When modelling the potential depths to which the lar-vae of the 3 species may be able to feed, it is clear that the apogonids do indeed have greater overall sensitivity than the pomacentrine pomacentrids, despite similarities in both somatic and eye development (see also Job & Bellwood 2000). Our depth estimates predict that in JOIA waters, early stage Apogon compressus larvae may be able to feed down to depths of at least 280 m,
Fig. 6. Model of depths to which sufficient light of different wave-length bands may penetrate, in 3 water types, to enable feeding at 2 stages of development: early stage larvae (A, C, E) and mid-stage postflexion larvae (B, D, F). (d) Pomacentrus amboinensis(Days 6 and 15 respectively); (r) Premnas biaculeatus(Days 2 and 6 re-spectively); and (j) Apogon compressus (Days 6 and 15
respec-tively). Values are means ± SE (n = 3)
C
E
A
D
while early stage Pomacentrus amboinensislarvae may be restricted to depths of approximately 180 m. Thus, the greater depth distribution of the apogonids may simply be a result of their greater overall sensitivity, allowing them greater flexibility for inhabiting spectrally sub-op-timal depths across a range of water types (Job & Bell-wood 2000). It should be noted that selective adaptation of different cone mechanisms could have occurred during our experimental procedure. Furthermore, a broader chromatic environment in the natural environ-ment compared with the experienviron-mental regime may facilitate interactions between different types of photo-receptors, when developed. However, our models pro-vide estimates of the minimum depths to which the lar-vae can feed and it is possible that a combination of the use of colour contrast and variation in the dynamic range of different cone mechanisms could further extend the depth ranges of all 3 species.
Ontogenetic changes in spectral sensitivity
An increase in sensitivity, throughout the spectrum, was recorded for all 3 species during ontogeny. In addition, a change in either λP50, λmax, or both,
oc-curred in the pomacentrid species, with a shift in tral sensitivity towards longer wavelengths. The spec-tral changes were moderate with a maximum range of about 20 nm in the λP50values and about 35 nm in the
λmaxvalues for Premnas biaculeatus. It is possible that
our experimental design is not detecting the full extent of chromatic changes and the mechanisms driving the observed spectral shifts in the species investigated are
unclear. Single cones develop first during the early stages of larval life in many marine teleosts, followed at a later stage by double cones, and rod photoreceptors (reviewed by Shand et al. 1999a). Thus, initially at least, it is likely that only 1 class of visual pig-ment will be present, such as found in larval winter flounder (Evans et al. 1993), and feeding will therefore be photopic. The subsequent shift in spectral sensitivity could be a result of longer-wavelength sensitive double cones being incorporated into the pho-toreceptor mosaic. However, the exact stage at which the use of wavelength discrimination begins is not detectable using our experimental design.
The functional significance of the spectral shifts in the species investi-gated is uncertain. Ontogenetic shifts in the spectral sensitivity of cone pho-toreceptors have been observed in juvenile teleosts, associated with changes in either habitat or diet (Shand et al. 1988, Shand 1993). Marked changes in light environment and feeding behaviour are likely to occur during settlement in reef fishes as the juveniles take up their reef-associated mode of life. The upwelling spectral distribution, in particular, will vary between the pelagic larval and benthic juvenile habi-tats, becoming more prevalent in long wavelength light (McFarland & Munz 1975, McFarland 1991b). However, further information is required about the exact nature of the visual tasks confronting the larvae and juveniles, at specific times during their develop-ment, to fully assess the significance of ontogenetic changes in spectral sensitivity.
Acknowledgements. We thank David Bellwood, Julian Par-tridge, Brigid Kerrigan, Justin Marshall, Julian Caley and Philip Mundy for valuable discussions. Richard Rowe, Richard Aynsley and Rebecca Fisher provided invaluable logistical support. Supported by the Australian Coral Reef Society (S.D.J.), James Cook University’s Merit Research Grant Scheme (S.D.J.) and the National Health and Medical Research Council (Australia), Program Grant 993219 (to J.S.). JCU ethics approval no. A402.
LITERATURE CITED
Boehlert GW, Watson W, Sun LC (1992) Horizontal and verti-cal distributions of larval fishes around an isolated oceanic island in the tropical Pacific. Deep-Sea Res 39:439–466 Bowmaker JK, Govardovskii VI, Shukolyukov SA, Zueva LV,
[image:10.612.67.353.118.326.2]Hunt DM, Sideleva VG, Smirnova OG (1994) Visual pig-ments and the photic environment: the Cottoid fish of Lake Baikal. Vision Res 34:591–605
Table 4. Comparison of the mean areas under the effective sensitivity curves (mean spectral efficiency) between species, developmental stages (age cate-gories), water types and depths. Analysis done using ANOVA (residual df = 108)
Factor F df p
Species 44.64 2 < 0.001*
Developmental stage 41.43 2 < 0.001*
Water type 183.38 2 < 0.001*
Depth 518.18 1 < 0.001*
Species by Developmental stage 11.74 4 < 0.001*
Species by Water type 2.23 4 0.071
Species by Depth 0.24 2 0.789
Developmental stage by Water type 7.27 4 < 0.001*
Developmental stage by Depth 0.83 2 0.439
Water type by Depth 134.44 2 < 0.001*
Species by Developmental stage by Water type 1.55 8 0.148 Species by Developmental stage by Depth 0.15 4 0.962
Species by Water type by Depth 1.07 4 0.375
Developmental stage by Water type by Depth 2.04 4 0.093 Species by Developmental stage by Water type 0.57 8 0.803
Doherty PJ, Planes S, Mather P (1995) Gene flow and larval duration in seven species of fish from the Great Barrier Reef. Ecology 76:2373–2391
Endler JA (1986) Defence against predators. In: Feder ME, Lauder GV (eds) Predator-prey relationships: perspectives and approaches from the study of lower invertebrates. University of Chicago Press, Chicago, p 109–134
Evans BI, Harosi FI, Fernald RD (1993) Photoreceptor spectral absorbance in larval and adult winter flounder ( Pseudo-pleuronectes americanus). Visual Neurosci 19:1065–1071 Finn MD, Kingsford MJ (1996) Two-phase recruitment of Apogonids (Pisces) on the GBR. Mar Freshw Res 47: 423–432
Fuiman LA, Delbos BC (1998) Developmental changes in visual sensitivity of red drum, Sciaenops ocellatus. Copeia p 936–943
Jerlov NG (1976) Marine optics. Elsevier, Amsterdam Job SD (2000) The functional visual capabilities of coral reef
fish larvae. PhD thesis, James Cook University of North Queensland
Job SD, Bellwood DR (1996) Visual acuity and feeding in lar-val Premnas biaculeatus. J Fish Biol 48:952–963
Job SD, Bellwood DR (2000) Light sensitivity in larval fishes: implications for vertical zonation in the pelagic zone. Limnol Oceanogr 45:362–371
Job SD, Arvedlund M, Marnane M (1997) Culture of coral reef fishes. Austasia Aquacult 11:56–59
Land MF (1981) Optics and vision in invertebrates. In: Autrum H (ed) Handbook of sensory physiology, Vol VII/6B. Springer, New York, p 471–592
Leis JM (1991a) The pelagic stage of reef fishes: the larval biology of coral reef fishes.In: Sale PF (ed) The ecology of fishes on coral reefs. Academic Press, San Diego, p 183–230
Leis JM (1991b) Vertical distribution of fish larvae in the GBR lagoon, Australia. Mar Biol 109:157–166
Leis JM (1993) Larval fish assemblages near Indo-Pacific coral reefs. Bull Mar Sci 53:362–392
Lesser MP (1995) General overview of instrumentation, ex-perimental methods, and attenuation of UV radiation in natural waters. In: Gulko D, Jokiel PL (eds) Ultraviolet radi-ation and coral reefs. Sea Grant Publicradi-ation, Hawaii, p 15–18 Loew ER, McFarland WN, Mills E, Hunter D (1993) A chro-matic action spectrum for planktonic predation by juvenile yellow perch, Perca flavescens. Can J Zool 71:384–386 Lythgoe JN (1979) The ecology of vision. Clarendon Press,
Oxford
Lythgoe JN (1984) Visual pigments and environmental light. Vision Res 24:1539–1550
Lythgoe JN, Muntz WRA, Partridge, JC, Shand J, Williams DMcB (1994) The ecology of the visual pigments of snap-pers (Lutjanidae) on the Great Barrier Reef. J Comp Phys-iol A 174:461–468
Maritorena S, Guillocheau N (1996) Optical properties of water and spectral light absorption by living and non-liv-ing particles and by yellow substances in coral reef waters of French Polynesia. Mar Ecol Prog Ser 131:245–255 McFarland WN (1991a) The visual world of coral reef fishes.
In: Sale PF (ed) The ecology of fishes on coral reefs. Acad-emic Press, San Diego, p 16–38
McFarland WN (1991b) Light in the sea: the optical world of elasmobranchs. J Exp Zool Supp 5:3–12
McFarland WN, Munz FW (1975) The evolution of photopic visual pigments in fishes. Part 3. Vision Res 15:1071–1080 McMahon MJ, MacLeod DIA (1998) Dichromatic color vision at high light levels: red/green discrimination using the blue-sensitive mechanism. Vision Res 38:973–983
Nilsson DE (1996) Eye design, vision, and invisibility in plank-tonic invertebrates. In: Lenz PH, Hartline DK, Purcell JE, Macmillan DL (eds) Zooplankton: sensory ecology and physiology. Gordon and Breach, Amsterdam, p 149–162 Pankhurst PM, Hilder PE (1998) Effect of light intensity on
feeding of striped trumpeter Latris lineata larvae. Mar Freshw Res 49:363–368
Partridge JC (1990) The colour sensitivity and vision of fishes. In: Herring PJ, Campbell AK, Whitfield M, Maddock L (eds) Light and life in the sea. Cambridge University Press, Cambridge, p 167–184
Partridge JC, Cummings ME (1999) Adaptation of visual pig-ments to the aquatic environment. In: Archer SN, Djamgoz MBA, Loew ER, Partridge JC Vallerga S (eds) Adaptive mechanisms in the ecology of vision. Kluwer, Dordrecht, p 251–283
Roberts CM (1997) Connectivity and management of Carib-bean coral reefs. Science 278:1454–1457
Shand J (1993) Changes in the spectral absorption of cone visual pigments during settlement of the goatfish Upeneus tragula: the loss of red sensitivity as a benthic existence begins. J Comp Physiol A 173:115–121
Shand J (1997) Ontogenetic changes in retinal structure and visual acuity: a comparative study of coral-reef teleosts with differing post-settlement lifestyles. Environ Biol Fish 49:307–322
Shand J, Partridge JC, Archer SN, Potts GW, Lythgoe JN (1988) Spectral absorbance changes in the violet/blue sen-sitive cones of the juvenile pollack, Pollachius pollachius. J Comp Physiol A 163:699–703
Shand J, Archer MA, Collin SP (1999a) Ontogenetic changes in the retinal photoreceptor mosaic in a fish, the black bream, Acanthopagrus butcheri. J Comp Neurol 412:203–217 Shand J, Doving KB, Collin SP (1999b) Optics of the
develop-ing fish eye: comparisons of Matthiessen’s ratio and the focal length of the lens in the black bream Acanthopagrus butcheri(Sparidae, Teleostei). Vision Res 39:1071–1078 Tarrant AWS (1989) Basic principles of light measurement. In:
Diffey BL (ed) Radiation measurement in photobiology. Academic Press, London, p 1–21
van der Meer HJ (1994) Ontogenetic change of visual thresh-olds in the cichlid fish Haplochromis sauvagei. Brain Behav Evol 44:40–49
van der Meer HJ, Anker GC, Barel CDN (1995) Ecomorphol-ogy of retinal structures in zooplanktivorous hap-lochromine cichlids (Pisces) from Lake Victoria. Environ Biol Fish 44:115–132
Viitala J, Korpimaki E, Palokangas P, Koivula M (1995) Attraction of kestrels to vole scent marks visible in ultravi-olet light. Nature 373:425–427
Walls GL (1942) The vertebrate eye and its adaptive radiation. Hafner, New York
Warner RR (1997) Evolutionary ecology: how to reconcile pelagic dispersal with local adaptation. Coral Reefs 16(Suppl):S115–S120
Warrant EJ (1999) Seeing better at night: life style, eye design and the optimum strategy of spatial and temporal summa-tion. Vision Res 39:1611–1630
Wehner R (1997) Sensory systems and behaviour. In: Krebs JR, Davies NB (eds) Behavioural ecology: an evolutionary approach. Blackwell, Oxford, p 19–41
Williams DMcB, Wolanski E, Andrews JC (1984) Transport mechanisms and the potential movement of planktonic larvae in the central region of the Great Barrier Reef. Coral Reefs 3:229–236
Zar JH (1999) Biostatistical analysis. Prentice-Hall, Engle-wood Cliffs, NJ
Editorial responsibility: Howard Browman (Contributing Editor), Storebø, Norway