University of Southern Queensland Faculty of Engineering and Surveying
Extracting Spatial Information from Aerial Video Imagery
for Monitoring Riparian Areas
A dissertation submitted by
Daniel Boitshoko
In fulfilment of the requirements of
Courses ENG4111 and ENG4112 Research Project
Towards the degree of
Bachelor of Spatial Science (Geographic Information Systems)
ii
ABSTRACT
There are many different techniques being used in remote sensing to capture data for natural resource management. Aerial video mapping is a relatively new technique that is gaining popularity because of its non invasiveness, relative cost-effectiveness and timeliness.
The Queensland Murray Darling Committee (QMDC) has collected video footage of rivers within its catchment area to facilitate their river management activities. It endeavours to ascertain the usefulness and reliability of information provided by aerial video mapping technology for riparian management.
The aim of this project was to develop object-oriented image processing techniques and GIS based techniques for extracting riparian area parameters from aerial video imagery. Specifically, the objectives were to a) use traditional image processing techniques to extract the identified riparian parameters; b) identify and test object-oriented image processing techniques that may be suitable for mapping the selected riparian variables; and c) assess the accuracy of the results generated from both the traditional per-pixel and object-oriented image processing techniques.
Four images were extracted from the aerial video footage. Each image represented a dominant land cover/use type (i.e. agriculture, urban, pasture and forest). For each image, a set of classes representing various riparian parameters were created. These were then used for classifying the images using the maximum likelihood algorithm in ERDAS IMAGINE 9.1, and the object-oriented classification techniques in Definiens Professional 5.
iii
University of Southern Queensland
Faculty of Engineering and Surveying
ENG4111 & ENG4112 Research Project
Limitations of Use
The Council of the University of Southern Queensland, its Faculty of Engineering and Surveying, and the staff of the University of Southern Queensland, do not accept any responsibility for the truth, accuracy or completeness of material contained within or associated with this dissertation.
Persons using all or any part of this material do so at their own risk, and not at the risk of the Council of the University of Southern Queensland, its Faculty of Engineering and Surveying or the staff of the University of Southern Queensland.
This dissertation reports an educational exercise and has no purpose or validity beyond this exercise. The sole purpose of the course "Project and Dissertation" is to contribute to the overall education within the student’s chosen degree programme. This document, the associated hardware, software, drawings, and other material set out in the associated appendices should not be used for any other purpose: if they are so used, it is entirely at the risk of the user.
Professor Frank Bullen
Dean
iv
CERTIFICATION
I certify that the ideas, designs and experimental work, results, analyses and conclusions set out in this dissertation are entirely my own effort, except where otherwise indicated and acknowledged.
I further certify that the work is original and has not been previously submitted for assessment in any other course or institution, except where specifically stated.
Daniel Boitshoko
Student Number: 0050030444
__________________________ Signature
v
ACKNOWLEDGEMENTS
I would like to thank my supervisor, Associate Professor Armando Apan for his support and guidance throughout my project.
vi TABLE OF CONTENTS
ABSTRACT ... II LIMITATIONS OF USE ... III CERTIFICATION ... IV ACKNOWLEDGEMENTS ... V LIST OF FIGURES ... IX LIST OF TABLES ... XI GLOSSARY ... XII
CHAPTER 1 INTRODUCTION ... 1
1.1. INTRODUCTION... 1
1.2. PROBLEM ... 2
1.3. PROJECT AIM AND SPECIFIC OBJECTIVES ... 2
1.4. JUSTIFICATION ... 3
1.5. DISSERTATION STRUCTURE ... 3
CHAPTER 2 LITERATURE REVIEW ... 4
2.1. INTRODUCTION... 4
2.2. RIPARIAN AREAS ... 4
2.3. THE IMPORTANCE OF MONITORING RIPARIAN AREAS... 5
2.4. IMAGE ANALYSIS TECHNIQUES ... 6
2.4.1. Pixel-Based Image Analysis ... 6
2.4.2. Object-Oriented Image Analysis ... 6
2.4.3. Object-Oriented vs. Pixel-Based Approach ... 8
2.5. AERIAL VIDEO MAPPING... 9
2.6. THE POTENTIAL OF AERIAL VIDEO IMAGERY AS A SOURCE OF SPATIAL INFORMATION FOR MONITORING RIPARIAN AREAS ... 11
2.7. OBJECT-ORIENTED PARADIGM AND AERIAL VIDEO MAPPING AS APPLIED TO RIPARIAN MONITORING ... 11
2.8. CONCLUSION ... 12
CHAPTER 3 RESEARCH METHODS ... 13
3.1 INTRODUCTION ... 13
3.2 STUDY AREA ... 13
3.3 METHODS ... 16
3.3.1 Data Capture ... 16
vii
3.3.3 Software Used ... 17
3.3.4 Video Imagery Sampling... 19
3.3.5 Study Site Selection ... 19
3.3.6 Identification of riparian parameters to be extracted ... 19
3.3.7 Image Analysis ... 20
3.3.8 Accuracy Assessment ... 20
3.3.9 Methodology Flow Chart ... 21
3.3.10 Image Extraction ... 22
3.3.11 Image Classification ... 22
3.3.12 Identification of classes... 23
3.3.13 Pixel-Based Classification ... 25
3.3.14 Unsupervised Classification ... 25
3.3.15 Supervised Classification ... 27
3.3.16 Training Samples ... 28
3.3.17 Object-Oriented Classification ... 29
3.3.18 Image Segmentation ... 29
3.3.19 Nearest Neighbour Classification ... 32
3.3.20 Creating Class Hierarchies ... 33
3.3.21 Image Object Feature Space ... 34
3.3.22 Classification ... 35
3.3.23 Refining Classification using rule sets ... 36
3.3.24 Accuracy Assessment ... 39
3.3.25 Pixel-based classification results ... 39
3.3.26 Object-oriented classification results ... 40
3.4 CONCLUSION... 40
CHAPTER 4 RESULTS ... 41
4.1 INTRODUCTION ... 41
4.2 PIXEL-BASED IMAGE CLASSIFICATION RESULTS ... 41
4.2.1 Supervised Classification Results - Agriculture ... 42
4.2.2 Supervised Classification Results - Urban ... 43
4.2.3 Supervised Classification Results - Forest ... 44
4.2.4 Supervised Classification Results - Pasture ... 45
4.3 OBJECT-ORIENTED IMAGE CLASSIFICATION RESULTS ... 46
4.3.1 Object-Oriented Classification Results - Agriculture ... 46
4.3.2 Object-Oriented Classification Results - Forest ... 47
4.3.3 Object-Oriented Classification Results – Urban ... 48
4.3.4 Object-Oriented Classification Results – Pasture ... 49
4.4 ACCURACY ASSESSMENT RESULTS ... 50
viii
CHAPTER 5 ANALYSIS AND DISCUSSIONS ... 51
5.1. INTRODUCTION... 51
5.2. INTERPRETATION OF CLASSIFICATION RESULTS ... 51
5.3. DATA LIMITATIONS ... 53
5.3.1. Lack of Near Infrared Band ... 53
5.3.2. Oblique Nature of the Imagery ... 54
5.4. CONCLUSION ... 54
CHAPTER 6 CONCLUSIONS ... 56
6.1. INTRODUCTION... 56
6.2. CONCLUSIONS ... 56
REFERENCES ... 58
APPENDIX A ... 61
APPENDIX B ... 62
APPENDIX C ... 65
APPENDIX D ... 68
APPENDIX E ... 71
APPENDIX F ... 74
APPENDIX G ... 77
APPENDIX H ... 81
ix
LIST OF FIGURES
Figure 2-1: Riparian Area ... 5
Figure 2-2: Unsegmented Image ... 7
Figure 2-3: Segmented Image ... 7
Figure 2-4: Aerial Video Mapping Setup ... 10
Figure 3-1: Agriculture ... 14
Figure 3-2: Pasture ... 14
Figure 3-3: Urban ... 14
Figure 3-4: Forest ... 14
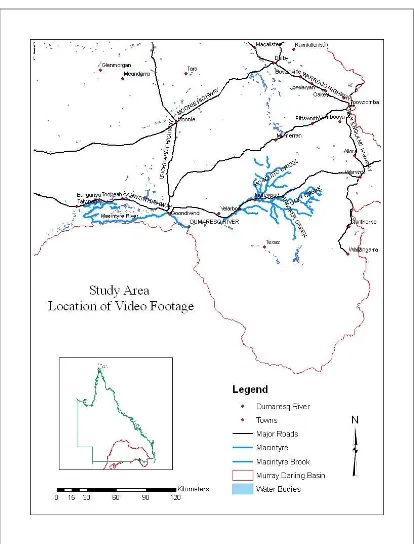
Figure 3-5: Study Area Location ... 15
Figure 3-6: Video Camera mounted on a Helicopter ... 16
Figure 3-7: Methodology Flow Chart ... 21
Figure 3-8: Unsupervised classification dialogue box ... 26
Figure 3-9: Supervised Classification dialogue box ... 27
Figure 3-10: Histogram for Tree Cover 1 training sample ... 28
Figure 3-11: Signature File ... 29
Figure 3-12: Scale parameter 10 ... 30
Figure 3-13: Scale parameter 50 ... 31
Figure 3-14: Scale Parameter Analysis ... 32
Figure 3-15: Defining Feature Space for Nearest Neighbour Classification ... 33
Figure 3-16: An example of a class hierarchy ... 34
Figure 3-17: Image Object Features ... 35
Figure 3-18: Nearest Neighbour Classification Settings ... 36
Figure 3-19: Image Object Features used when classifying the Agriculture image . 37 Figure 3-20: Setting conditions for a custom rule set ... 38
Figure 3-21: Process Tree ... 39
Figure 4-1: Agriculture – Supervised classification results ... 42
Figure 4-2: Urban – Supervised Classification Results ... 43
Figure 4-3: Forest – Supervised Classification Results ... 44
Figure 4-4: Pasture – Supervised Classification Results ... 45
Figure 4-5: Agriculture – Object Oriented Classification Results ... 46
xi
LIST OF TABLES
xii
GLOSSARY
Accuracy assessment: use of different techniques to assess the quality of a
classification
Image classification: this is a process of associating or linking image objects or
pixels with particular informational class (Definiens, 2006).
Image object: this refers to a group of pixels in an image that represent a particular
feature. Each image object has a wide range of properties that can be used in the classification process (Definiens, 2006).
Image segmentation: refers to the use of different algorithms to break an image into
image objects which are then used in image classification (Definiens, 2006).
Object-oriented image classification: an image classification technique that uses
image objects rather than pixels as the basic unit of classification.
Pixel: picture element: the smallest element in an image
Pixel-based image classification: an image classification technique that uses pixels
as the basic unit of the classification. During classification, each pixel is assigned to a particular class (Mather, 2004).
xiii Scale parameter: an arbitrary value used to determine the size of image objects and
1
Chapter 1
INTRODUCTION
1.1.
Introduction
The Queensland Murray Darling Committee (QMDC) is a non-profit natural resource management organisation that strives to ensure the sustainable management of natural resources in the Queensland Murray Darling Basin (QMDB) (QMDC, 2007). QMDC, a co-sponsor for this research project, is concerned with the timeliness and adequacy of the data that it has for river management. It seeks to ensure that it has adequate and timely data to facilitate river management activities (in this case, riparian area management) in the QMDB.
To this end, the QDMC has collected video footage of selected catchments in the QMDB. It endeavours to ascertain the usefulness and reliability of aerial video mapping technology and the quality and usefulness of the information that can be extracted from the aerial video imagery for managing riparian areas.
Upon establishing the usefulness of the data, the QMDC hopes to use the data in many different mapping applications. These include riparian condition mapping, riparian corridor connectivity and riparian width mapping. They also want to map vegetation species, bank stability, and stream width and identify erosion points. The data will also be shared with other land care groups and organisations to be used as an educational and capacity building tool for the community.
2 This study, which is a part of QDMC's Aerial Video Mapping Project (AVM), seeks to develop image processing and GIS based techniques for extracting spatial information from imagery acquired from the aerial video footage, for use in monitoring and managing riparian areas in the QMDB.
1.2.
Problem
QMDC is concerned with the lack of timely and adequate data necessary for the apt, effective and efficient management of rivers within its catchment area. The data that is currently available to QMDC for management of riparian areas is inadequate and often not available when needed or not in a usable form, hence hindering the effective management of riparian zones.
1.3.
Project Aim and Specific Objectives
The aim of this research project was to develop object-oriented image processing techniques and GIS based techniques for extracting riparian parameters from aerial video imagery.
The specific objectives of this study were to:
a. Identify riparian parameters to be extracted from the aerial video imagery.
b. Use traditional image processing techniques to extract the identified riparian parameters.
3 d. Assess the accuracy of the results generated using the selected image
processing techniques.
1.4.
Justification
The need for this project arose because the QMDC was looking for different ways it could tackle its problem of inadequate and untimely data for riparian area management. Also, limited studies have been done using high spatial resolution imagery acquired from aerial video footage for monitoring riparian areas. New techniques, particularly the use of multi-resolution object-oriented image analysis approach, applied to aerial video imagery, have not been incorporated in methods or techniques recommended for monitoring riparian areas.
1.5.
Dissertation Structure
This dissertation is made up of six chapters. Chapter 1 introduces the project, gives a brief outline of the project background. It provides a justification for the project and presents the project aims and objectives. Chapter 2 deals with the literature review. It presents a summary of similar work done in the past and creates a working foundation for this project.
Chapter 3 describes the study area and outlines the research methodology and techniques used to process the data. Chapter 4 provides an analysis and interpretation of the results achieved using the techniques described in chapter 3. Chapter 5 discusses the findings of the project and chapter 6 provides conclusions and recommendations based on the discussions in previous chapters.
4
Chapter 2
LITERATURE REVIEW
2.1.
Introduction
This chapter presents a summary of the literature that was reviewed before undertaking the research work discussed in this paper. It starts by giving a brief description of riparian areas, their importance and the current spatial techniques used in managing them.
It then presents a discussion on pixel-based image analysis and object-oriented image analysis techniques and a comparison between these two techniques. A brief summary of aerial video mapping is also provided here. The chapter concludes by discussing the usefulness of aerial video mapping technology coupled with object-oriented image classification in riparian area management.
2.2.
Riparian Areas
An area of land is referred to as a riparian area if it borders a natural water body. The width of the riparian area is defined in accordance with the objectives of the purpose for which it is being delineated (Price & Lovett, 2002). Figure 2-1 depicts an example of a riparian area. It shows a natural water body, a river in this case, and the land adjacent to it.
5 Figure 2-1: Riparian Area
2.3.
The Importance of Monitoring Riparian Areas
It is important to monitor the condition of riparian areas in order to know the extent of damage or alteration on these areas due to human activities (Goetz, 2006). The availability of timely and adequate data about the state of riparian areas in the Murray Darling Basin will enable QMDC to take appropriate action to keep the riparian areas in good health.
6
2.4.
Image Analysis Techniques
2.4.1.
Pixel-Based Image Analysis
A picture element (pixel) is defined as the smallest unit that can be displayed on a computer screen (Clarke, 2003). In remote sensing terms, a pixel is the smallest unit in an image. Thus, a remotely sensed image is an array of pixels. Each pixel contains a value that represents the amount of electromagnetic energy reflected or emitted by one or more geographic features in the area covered by the image (Mather, 2004).
Pixel-based image classification techniques use pixels as the base elements in the classification process. During classification, each pixel is assigned to a particular class. For example, the maximum likelihood classifier will assign a pixel to a class which it has highest likelihood of being a member (Mather, 2004; Yan et al, 2006). If a pixel represents more than one geographic feature, the pixel is usually assigned to the class of the more dominant feature (Mather, 2004).
2.4.2.
Object-Oriented Image Analysis
Object-oriented image analysis is a relatively new image processing technique that is used to extract spatial information from remotely sensed images.
7 Figure 2-2 shows an unsegmented image and Figure 2-3 shows the same image with images objects created after segmenting the image.
Figure 2-2: Unsegmented Image
[image:20.612.206.404.142.396.2]8
2.4.3.
Object-Oriented vs. Pixel-Based Approach
The advent of high resolution imagery and the availability of better image processing technologies have led to a paradigm shift in image classification techniques used in remote sensing applications (Lang & Blaschke, 2006).
Recent research shows that the object-oriented approach to image processing is becoming the method of choice for many applications that require analysis of imagery with a very high spatial resolution. For example, Zhang and Feng (2005) used the object-oriented approach to map the distribution of urban vegetation from IKONOS imagery. Chubey, Franklin and Wulder (2006) devised a method for extracting forest inventory data from IKONOS-2 imagery using the object-oriented approach to image analysis. Recent undertakings in land use/cover mapping and change detection have favoured the use of the object-oriented approach rather than the pixel-based approach (Walter, 2006).
In the research studies mentioned in the previous paragraph, the authors opted to use the object-oriented approach over conventional classification methods (i.e. the pixel-based approach) because such methods have severe limitations when it comes to dealing with very high spatial resolution imagery. The inability of pixel-based classifiers to incorporate contextual data and other aerial photo interpretation elements during the classification process can lead to inaccurate results (Benz et al., 2004). Riparians areas exhibit a relatively high degree of spatial heterogeneity. In order to map these areas accurately, imagery with very high spatial resolution must be used (Neale, 1997). However, if the pixel-based approach is used to classify such imagery, the results obtained will have lower accuracy because pixel-based classifiers can be easily misled by the heterogeneity inherent in high spatial resolution imagery (Hay & Castilla, 2006).
9 technique, which allows the incorporation of texture (Zhang & Feng, 2005) and other image object characteristics such as shape, size and context into the classification process(Hay & Castilla, 2006).
The pixel-based approach has been proven to produce results with lower classification accuracy when compared to the object-oriented approach in a variety of applications. For example, Yan et al. (2006) undertook a study to compare the accuracy of pixel-based and object oriented image classification techniques for mapping land-cover in a coal fire area. Their findings indicate that the accuracy achieved using the object-oriented methodology (83.25%) was considerably higher than that achieved when using the pixel-based approach (46.48%). Yuan and Bauer (2006) used object-based and pixel-based image classification techniques to map impervious surface areas. They applied both techniques to medium resolution Landsat TM imagery and found that the object-based approach produced results with a higher accuracy than those obtained from the pixel-based approach.
2.5.
Aerial Video Mapping
Aerial video mapping, also known as aerial videography, is a technique used
in remote sensing and other disciplines to gather data about geographic phenomena (Mausel et al., 1992;).
10
Figure 2-4: Aerial Video Mapping Setup Source: Peter Smith (http://www.petersmith.com )
The complexity and sophistication of the camera used depends on the application and budget of the researcher. Positional data is recorded for each video frame using a GPS receiver linked to the video camera (Mausel et al., 1992; Neale 1997).
Data collected using aerial video mapping technology can be used in a variety of natural resource management applications. It also has uses in other non-remote sensing disciplines.
11
2.6.
The Potential of Aerial Video Imagery as a source of Spatial
Information for Monitoring Riparian Areas
A review of previous studies into the use of aerial video mapping technology has revealed that the technique has been used to solve a variety of natural resource management problems, including riparian area mapping, restoration and monitoring. This is because the technique is relatively cost effective, timely and non-invasive (Lamb & Brown, 2000).
For example, Wulder et al. (2007) used airborne digital video in a study aimed at validating a large area land cover product. The authors chose to use the aerial video mapping technique over other approaches because it provided a timely and cost effective solution for their application.
Aerial video mapping has been used in the past for riparian area mapping and restoration activities. Neale (1997) gives a description of airborne multispectral videography and examples of its application in mapping riparian systems. In a study to select sites for riparian restoration, Russell et al. (1997), manually interpreted aerial video imagery in an attempt to verify the results they obtained by classifying Landsat imagery.
Solving spatial problems requires a technique that provides timely, adequate and accurate data. Aerial video imagery can be used to assess the condition of riparian areas both visually and automatically using image classification techniques. The studies discussed above have shown that aerial video mapping is a technique that has produced positive results when used in natural resource management, hence its potential suitability as a source of data for riparian monitoring in the Queensland Murray Darling Basin.
2.7.
Object-Oriented Paradigm and Aerial Video Mapping as
Applied to Riparian Monitoring
12 resource management. Past research shows that the main remote sensing approach used in natural resource management is the extraction of data from satellite imagery, aerial photographs (Goetz, 2006) or aerial video imagery using the pixel-based image classification approach.
For example, Goetz et al. (2003) used IKONOS imagery to map tree cover within riparian buffer zones using the pixel-based approach. In their study, (Congalton et al., 2002) mapped riparian vegetation from aerial photos and Landsat imagery using traditional image classification methods. In a study conducted by Neale (1997), the supervised pixel-based image classification technique was used to extract riparian variables from digital video imagery. Hawkins, Bartz and Neale (1997) undertook a study to assess the vulnerability of riparian vegetation to flooding. They used supervised pixel-based classification on aerial video images acquired before and after the flood event to map the effects of the flood on riparian vegetation.
Very few studies have been conducted using the object-oriented approach in riparian management. Johansen et al. (2007) applied the object-oriented approach to high spatial resolution imagery in a study aiming to discriminate vegetation structural stages in riparian and adjacent forested ecosystems.
2.8.
Conclusion
13
Chapter 3
RESEARCH METHODS
3.1
Introduction
This chapter discusses the research methodology used in this project. First, a brief introduction of the study area is presented. This is then followed by a summary of the techniques used during data capture and pre-processing. A detailed description of the pixel-based and object-oriented image techniques is then presented. The chapter concludes by providing an accuracy assessment report of the results obtained using both the pixel-based and object-oriented image classification approaches.
3.2
Study Area
The study area for this project is comprised of four images extracted from the video footage captured along the Macintyre and Dumaresq rivers in the Borders River Catchment. Each image represents a different riparian land use/cover. For this study, the land cover/use types selected were agriculture, pasture, forest and urban.
14 Figure 3-1: Agriculture
Figure 3-2: Pasture
Figure 3-3: Urban Figure 3-4: Forest
The agriculture, forest and urban images were extracted from video footage captured along the Macintyre River on the 23rd of September 2005 while the pasture image was obtained from video footage captured over the Dumaresq River on the 24th of September 2005.
[image:27.612.147.321.67.196.2]15
16
3.3
Methods
3.3.1
Data Capture
The data used in this project was captured from the 23rd of September 2005 to the 29th of September 2005 by Gyrovision, a company that provides aerial stabilised camera solutions to clients such as QMDC.
The data was captured using a digital video camera mounted to the front of a helicopter. Figure 3-6 below is an illustration of a typical aerial video mapping system.
Figure 3-6: Video Camera mounted on a Helicopter
Source: Gyrovision (http://www.gyrovision.com.au )
17
3.3.2
Data Pre-processing
Once the data was captured and recorded on digital media, it was transferred to spatial DVD (sDvD) using GeoVideo, an extension tool for the ArcGIS environment from Red Hen Systems (Red Hen Systems, 2007). This was done to enable QMDC staff to interact with the video data within ESRI’s ArcGIS (ArcMap) environment.
The data used in this project was provided by QMDC in sDVD format. Two sDVD disks were provided, one had video captured on the 23rd of September 2005 and the other had footage captured on the 24th of September 2005. The video footage in each disk was about an hour long and it was accompanied by other GIS datasets. The datasets included in the disk were rivers, major and minor roads, towns and state of the rivers sites (SOR) data and other water bodies.
3.3.3
Software Used
Three different types of software were used to accomplish the aims and objectives of this research project. The different types were GIS software, Image processing software and Video processing software:
a. ArcGIS 9
Product Version: ESRI ArcMap 9.2 Build (1324) License Type: ArcView Student Edition
Copyright © 1999 – 2006 ESRI Inc. All Rights Reserved
18 b. ERDAS IMAGINE 9
Product Version: 9.1
Copyright © 1998 – 2006 Leica Geosystems GIS Mapping, LLC. All Rights Reserved
This software was used to extract information from the video imagery using the traditional pixel-based image classification techniques. It provided algorithms for performing both the supervised and unsupervised image classification and the associated accuracy assessments. It was also used to perform an accuracy assessment of the results generated using the object-oriented image classification software.
c. Definiens Professional 5
Product Version: Definiens Professional 5
Copyright © 1995 – 2006 Definiens AG, All Rights Reserved
This software was used to classify images using object-oriented techniques. It provided a wide variety of object-oriented functionality that made the classification process more flexible and more accurate as compared to the traditional approach of classifying images.
d. VideoLAN – VLC Media Player
Product Version: 0.8.6c VideoLAN Software Project
19 footage. It was also chosen because it was a cheaper, less restricted alternative to GeoVideo.
3.3.4
Video Imagery Sampling
This step involved watching the video footage to identify potential study sites i.e. the video footage was assessed to locate sections which could be extracted as still images and used as a study site. After an area was identified as a potential site for study, it was extracted using VLC media player.
3.3.5
Study Site Selection
The study site was selected by analysing the video footage from both disks and extracting still images that represented a particular dominant riparian land use/cover type. Four images were selected, each image representing one of pasture, agriculture, forest and urban land use/cover types.
3.3.6
Identification of riparian parameters to be extracted
20
3.3.7
Image Analysis
The imagery selected as study sites were analysed to extract the identified riparian parameters. First, before the images were analysed, the parameters identified for each image were used to create classes. These classes were then used in the classification process to extract spatial information from the images. The images were classified using both the traditional pixel-based algorithms and the new object-oriented algorithms. Section 3.3.11 gives a detailed description of how each of these methods was used to extract information from the four images.
3.3.8
Accuracy Assessment
21
3.3.9
Methodology Flow Chart
[image:34.612.163.448.143.617.2]Figure 3-7 below is a depiction of the methodology used in this project.
22
3.3.10
Image Extraction
The images were extracted from the video footage using VLC. VLC is a freely available media player that allows the extraction of still images from video. This player was chosen because GeoVideo and Pixpoint, the more suitable applications for this project, could not be acquired due to financial and licensing constraints. Only trial versions of these products could be accessed but they had limited functionality and hence were not suitable as the critical functionality needed for extracting images was disabled.
A series of images were extracted from the video footage. Once the entire video footage was examined, the images were assessed and those that were most representative of a particular land use/cover type were chosen as the study area.
3.3.11
Image Classification
Image classification is a process of grouping pixels in an image into informational categories identified by the image analysts.
23
3.3.12
Identification of classes
For all of the four images used in this project, the classes of features present in each image were identified by visual inspection. Where necessary, each class was broken down into subclass to aid the classification process. Table 3-1 below shows the four images and the informational categories identified for each of them.
Land Use/Cover Type Classes/Sub - Classes
1. Agriculture
Figure 3-2: Pasture
• Crops
o Crops 1
o Crops 2
o Crops 3
• Water
o Water 1
o Water 2
o Water 3
• Tree Cover
o Tree Cover 1
o Tree Cover 2
o Tree Cover 3
• Shadow
o Shadow 1
o Shadow 2
• Grass Cover
o Grass Cover 1
• Soil
o Soil 1
o Soil 2
o Soil 3
o Soil 4
2. Forest • Water
o Water 1
24 Figure 3-4: Forest
o Water 3
• Tree Cover
o Tree Cover 1
o Tree Cover 2
o Tree Cover 3
o Tree Cover 4
• Shadow
o Shadow 1
o Shadow 2
• Grass Cover
o Grass Cover 1
3. Urban
Figure 3-3: Urban
• Buildings
o Buildings 1
o Buildings 2
• Water
o Water 1
o Water 2
o Water 3
• Tree Cover
o Tree Cover 1
o Tree Cover 2
o Tree Cover 3
• Shadow
o Shadow 1
o Shadow 2
• Grass Cover
o Grass Cover 1
• Bitumen
o Bitumen 1
o Bitumen 2
4. Pasture • Water
o Water 1
o Water 2
25
Figure 3-2: Pasture
o Tree Cover 1
o Tree Cover 2
o Tree Cover 3
• Shadow
o Shadow 1
o Shadow 2
• Grass Cover
o Grass Cover 1
o Grass Cover 2
o Grass Cover 3
o Grass Cover 4
• Soil
o Soil 1
[image:38.612.102.533.64.318.2]o Soil 2
Table 3-1: Study Area Images and their associated informational categories
3.3.13
Pixel-Based Classification
The pixel-based classification was performed using both the unsupervised and supervised approaches. These are described in the sections 3.3.14 and 3.3.15.
3.3.14
Unsupervised Classification
This technique was used in order to get a feel for the natural groupings of features present in the images.
26 Figure 3-8 shows the interface provided by ERDAS IMAGINE 9 for setting the parameters to be used during the unsupervised classification process. The number of classes or groupings was set to 50. This number tells the algorithm to group the features in an image into 50 different classes.
The maximum iterations value was set to 6. This number determines the number of cycles that the algorithm goes through while re-clustering the data. It prevents the algorithm from looping continuously without reaching the convergence threshold. The convergence threshold determines the maximum percentage of pixels whose cluster assignments can go unchanged between each clustering cycle. The X and Y skip factors were each set to 1 so that all pixels in the image are included in the classification (ERDAS, 2007).
27
3.3.15
Supervised Classification
This technique is heavily dependent on user input and knowledge of the area represented by the image being classified. Prior to classifying an image, training samples were selected for each of the riparian parameters identified for that image. The algorithm used to perform the supervised classifications was the maximum likelihood parametric rule. This rule requires training data to compute the likelihood of a pixel belonging to a particular class. It uses mean values from the training samples to classify pixels in the image (Campbell, 2007). A more detailed description of the inner workings of the maximum likelihood algorithm can be found in Mather (2004). Figure 3-9 shows the interface used to set the parameters for supervised classification.
28
3.3.16
Training Samples
[image:41.612.215.467.317.531.2]Before commencement of the classification process, samples were selected for each of the sub-classes associated with a particular super class for each of the four images. No samples were selected for the super classes as these were only used on a nominal scale. Care was taken to ensure that the samples selected were representative of their classes. The representativeness of samples was checked by inspecting their spectral curves to ensure that they resembled a Gaussian distribution, indicating that the sample represented only one feature class. Figure 3-10 below shows a histogram of a training sample selected to represent the subclass tree cover 1. The histogram has a single peak indicating that the selected sample represents one feature only.
Figure 3-10: Histogram for Tree Cover 1 training sample
Figure 3-11 below shows the signature file containing the samples from which the histogram in Figure 3-10 was generated. The histogram in Figure 3-10 belongs to the highlighted class (Tree Cover 1) in Figure 3-11.
29
Figure 3-11: Signature File
3.3.17
Object-Oriented Classification
Object-oriented classification is a relatively new image processing technique that works on image objects rather pixels. Pixels are the lowest level in the image object hierarchy. Once an image has been segmented and image objects created, the classification process focuses on the image objects and uses them as the basic unit of the classification.
3.3.18
Image Segmentation
This was the first step performed during object-oriented image classification. During this step, the image was broken down into image objects. The size of the image objects depended on the chosen scale parameter. The scale parameter determines the maximum allowed heterogeneity for the resultant image objects (Definiens, 2006).
30 by the trial and error approach. The images were segmented and classified using different scale parameters until an appropriate or satisfactory scale parameter was found. Figure 3-12 shows an image segmented with a scale parameter 10 while Figure 3-13 shows an image segmented with a scale parameter 50. As can be seen from Figure 3-12, a scale parameter of 10 resulted in a large number of small sized objects while Figure 3-13 shows that a scale parameter of 50 resulted in small number of large image objects.
31
Figure 3-13: Scale parameter 50
The images used in this project were segmented using the multi-resolution segmentation algorithm. This algorithm used a heuristic optimization procedure which minimizes the average heterogeneity of image objects for a given resolution (Definiens, 2006). The images analysed in this project had a spatial resolution of 1m.
32
Figure 3-14: Scale Parameter Analysis
3.3.19
Nearest Neighbour Classification
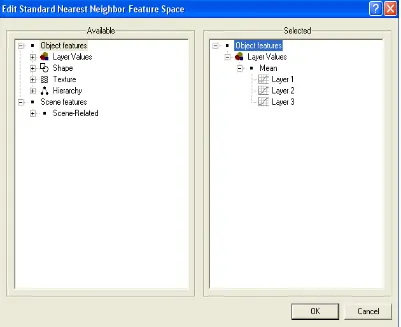
33
Figure 3-15: Defining Feature Space for Nearest Neighbour Classification
3.3.20
Creating Class Hierarchies
34 Figure 3-16: An example of a class hierarchy
3.3.21
Image Object Feature Space
35
Figure 3-17: Image Object Features
3.3.22
Classification
36
Figure 3-18: Nearest Neighbour Classification Settings
Prior to performing the classification, the feature space was defined and applied to the classes defined in the class hierarchy. The image objects were then assigned to their respective classes using the nearest neighbour algorithm. A custom algorithm was used to assign subclasses to their super class. For example, image objects classified as Tree Cover 1 and Tree Cover 2 were assigned to the super class Tree Cover by use of an algorithm defined in the process tree.
3.3.23
Refining Classification using rule sets
The classification results obtained using the Nearest Neighbour approach were not 100% accurate. These results were further refined using custom made rule sets.
Using rule sets to refine classification results allows for the incorporation of other image object characteristics in the classification process. Characteristics or image object features such as area, border to neighbour objects, relative border to neighbour objects and distance to neighbour objects were used to refine the classification results.
37 image object relates to its neighbours. For example, some tree cover objects (incorrectly classified) bordering crop image objects had a “distance to crops” value of zero. This statistic was used as a criterion for classifying those objects as crops. This was validated against the original image to ensure that image objects were assigned to the correct class. The shadow image objects that were misclassified as tree cover were reclassified as shadow using the assign class algorithm. The area and “distance to neighbour objects” features were used to set the conditions for the algorithm, so that only those objects that met the criteria could be classified as shadow. Besides the use of conditions to automatically exclude some objects during classification, the algorithm was also used to classify manually selected (highlighted) image objects.
Figure 3-19: Image Object Features used when classifying the Agriculture image
38 whose area is less than the one specified in the dialogue box were included in the classification.
Figure 3-20: Setting conditions for a custom rule set
39
Figure 3-21: Process Tree
3.3.24
Accuracy Assessment
The quality of the classification results was assessed for both the object-oriented classification results and the pixel-based classification results using ERDAS. Refer to sections 3.3.25 and 3.3.26 for more information about the accuracy assessment procedure used.
3.3.25
Pixel-based classification results
40 random points was assigned a class value (reference value). The assigned class value was compared to the value automatically assigned to the random point. Any mismatch between the manual and automatically assigned values represented a classification error.
3.3.26
Object-oriented classification results
The accuracy assessment for the results obtained from the object-oriented classification was performed using the same technique as that used for those from pixel-based classification. This was accomplished by exporting the object-oriented classification results from Definiens Professional 5 to ERDAS IMAGINE 9 and then using ERDAS’ accuracy assessment tool to perform the accuracy assessment.
3.4
Conclusion
41
Chapter 4
RESULTS
4.1
Introduction
The four images that made up the study area for this project were classified using pixel-based image classification and object-oriented image classification techniques. The object-oriented classification approach produced results with greater accuracy than those obtained from pixel-based analysis. The object-oriented approach achieved results with accuracies greater than 90% while the pixel-based approach managed accuracies ranging from 69% up to 82%.
Please note that the imagery in the maps presented in this chapter was taken at an oblique angle, hence the absence of a scale bar in the maps.
4.2
Pixel-Based Image Classification Results
42
4.2.1
Supervised Classification Results - Agriculture
43
4.2.2
Supervised Classification Results - Urban
44
4.2.3
Supervised Classification Results - Forest
45
[image:58.612.110.502.114.625.2]4.2.4
Supervised Classification Results - Pasture
46
4.3
Object-Oriented Image Classification Results
The classification results shown below were obtained by classifying the four study area images using object-oriented techniques.
[image:59.612.111.502.162.700.2]4.3.1
Object-Oriented Classification Results - Agriculture
47
[image:60.612.112.501.114.627.2]4.3.2
Object-Oriented Classification Results - Forest
48
[image:61.612.111.504.117.628.2]4.3.3
Object-Oriented Classification Results – Urban
49
[image:62.612.111.504.117.620.2]4.3.4
Object-Oriented Classification Results – Pasture
50
4.4
Accuracy Assessment Results
Table 4-1 shows the accuracy assessment results obtained from both the pixel-based image classification and object-oriented classification for each of the images that made up the study area. It shows the overall classification accuracy and the overall Kappa statistics for each method for each of the four images that make up the study area. The complete error matrices for the classification results listed in Table 4-1: Accuracy Assessment Results are in appendices B to I.
Pixel-Based Classification Object-Oriented Classification
Image Overall
Classification Accuracy Overall Kappa Statistics Overall Classification Accuracy Overall Kappa Statistics
Agriculture 69.00 % 0.5098 97.00 % 0.9600
Urban 80.00 % 0.7737 92.00 % 0.8810
Forest 82.00 % 0.7321 93.00 % 0.8682
[image:63.612.106.548.267.388.2]Pasture 73.00% 0.5065 90.00 % 0.8332
Table 4-1: Accuracy Assessment Results
4.5
Conclusion
51
Chapter 5
ANALYSIS AND DISCUSSIONS
5.1.
Introduction
The purpose of this chapter is to provide an in-depth analysis and interpretation of the image classification results presented in the previous chapter. The classification results were as expected, with the object-oriented classification techniques achieving greater classification accuracies than the traditional pixel-based image classification approach.
5.2.
Interpretation of classification results
The object-oriented approach produced results with greater accuracy than those attained by the pixel-based approach. This was the expected outcome since the object-oriented approach has been proven to have a superior ability of handling high resolution imagery. High resolution imagery is made up of pixels with a higher degree of spectral variability which makes the statistical classifiers used in pixel-based classification less effective when dealing with high resolution imagery (Zhang & Feng, 2005).
52 Problems inherent in the classification of high spatial resolution imagery using pixel-based classification were evident from the results obtained. Figures Figure 4-1, Figure 4-2 and Figure 4-4 show the salt and pepper effect that appears on high resolution images classified using the pixel-based techniques. This salt and pepper effect was due to the incapacity of pixel-based classifiers to deal with the increased variability embedded in high spatial resolution imagery (Hay & Castilla, 2006).
Table 4-1 shows the accuracy assessment results of the classifications performed using the pixel-based maximum likelihood technique and object-oriented techniques for all four images in the study area. It shows the overall classification accuracy and the overall Kappa statistics achieved using both the techniques mentioned above for each of the images that made up the study area. The kappa coefficient is a statistical measure of classification accuracy (Mather, 2004). A kappa value of zero means that there is no agreement between the reference data and the classifier output while a value of 1.000 shows perfect agreement (Mather, 2004). The Kappa coefficient endeavours to provide a measure of agreement between the reference data and the classifier output that has been adjusted for chance agreement (Campbell, 2006).
53 The classification results achieved in this research project were found to be consistent with results obtained from previous studies that used both the pixel-based image classification approach and the object-oriented image classification approach to classify imagery with a high spatial resolution. Yuan and Bauer (2006) used object-based and pixel-based image classification techniques to map impervious surface areas. They applied both techniques to medium resolution Landsat TM imagery and found that the object-based approach produced results with a higher accuracy than those obtained from the pixel-based approach. Yan et al. (2006) undertook a study to compare the accuracy of pixel-based and object oriented image classification techniques for mapping land-cover in a coal fire area. Their findings indicate that the accuracy achieved using the object-oriented methodology (83.25%) was considerably higher than that achieved when using the pixel-based approach (46.48%).
5.3.
Data Limitations
The data used in this research project was found to have two major limitations. It lacked some spectral bands which would have made it possible to extract more information from the imagery and it was collected at an oblique angle.
5.3.1.
Lack of Near Infrared Band
The aerial video footage from which the imagery was extracted was collected in three spectral bands only: red, green and blue. The absence of the near infrared band proved to be a major limitation during the classification process.
54 near infrared band and low reflectance in the red band (Campbell, 2007). This contrasting spectral behaviour would have made it easier to distinguish between actively growing vegetation and dead vegetation (logs) in the imagery. The lack of the near infrared band also hindered the use of vegetation indices and ratios to distinguish between native and exotic vegetation species in the riparian zones.
5.3.2.
Oblique Nature of the Imagery
The video data used in this project was captured at an oblique angle. This in turn meant that the imagery extracted from the video footage was oblique. In an oblique image, the scale is constant along any line parallel to the true horizon but differs from point to point along any other line (Moffit & Mikhail, 1980).
Since the scale in the imagery acquired from the video footage varied continually from point to point, it was not possible to take measurements from the imagery. The inability to take measurements from the imagery hindered the extraction of some riparian parameters. For example, it was impossible to determine the total area covered by bare soil patches, which serve as an indicator of soil erosion along the riparian corridor. Other parameters which could not be extracted from the imagery due to the changing scale were the width of the riparian zone and the stream width.
5.4.
Conclusion
56
Chapter 6
CONCLUSIONS
6.1.
Introduction
This chapter presents the conclusions derived from the analysis of the results achieved in this project. The specific objectives of this study were to:
a. Identify riparian parameters to be extracted from the aerial video imagery.
b. Use traditional image processing techniques to extract the identified riparian parameters.
c. Develop object-oriented image processing techniques that may be suitable in mapping the selected riparian variables.
d. Assess the accuracy of the results generated using the selected image processing techniques.
These objectives were successfully completed although the data limitations identified in chapter 5 hindered the extraction of some riparian parameters using the object-oriented approach. The pixel-based approach was successfully used to extract the identified riparian parameters albeit with a lower degree of accuracy compared to the object-oriented approach.
6.2.
Conclusions
The conclusions drawn from the findings of this study are;
57 b. The lack of the near infrared band hindered the extraction of certain riparian parameters. This limited the amount of useful information that could be extracted from the video imagery.
58
REFERENCES
Benz, U.C, Hofman, P, Willhauck, G, Lingenfelder, I & Heynen, M, 2004, ‘Multi-resolution, object-oriented fuzzy analysis of remote sensing data for GIS-ready information’, ISPRS Journal of Photogrammetry and Remote Sensing, vol. 58, pp. 239-258.
Campbell, J.B, 2007, Introduction to Remote Sensing, 4rd Edition, The Guildford Press
Chubey, M.S, Franklin, S. E, & Wulder, M.A, 2006, `Object-based Analysis of Ikonos-2 Imagery for Extraction of Forest Inventory Parameters`, Photogrammetric
Engineering and Remote Sensing, vol.72, no.4, April 2006, pp. 383-394.
Clarke, K.C, 2003, Getting started with Geographic Information Systems, 4th Edition, Upper Saddle River, N.J, Pearson Education
Congalton, R. G., Birch, K., Jones, R. & Schriever, J, 2002, ‘Evaluating remotely sensed techniques for mapping riparian vegetation’, Computers and Electronics in
Agriculture, 37, 113-126.
Definiens AG, 2006, Definiens Professional 5 User Guide, Definiens AG, Germany Goetz, S. J., Wright, R. K., Smith, A. J., Zinecker, E. & SchauB, E, 2003, IKONOS imagery for resource management: Tree cover, impervious surfaces, and riparian buffer analyses in the mid-Atlantic region. Remote Sensing of Environment, 88, 195-208.
Goetz, S.J, 2006, Remote Sensing of Riparian Buffers: Past Progress and Future Prospects, Journal of the American Water Resources Association, vol. 42, no. 1, February 2006, pp. 133-143.
Gyrovision – Aerial Stabilized Camera Solutions, viewed 2 October 2007, http://www.gyrovision.com.au/
Hawkins, C.P, Bartz, K.L. & Neale, C.M.U, 1997, Vulnerability of Riparian Vegetation to Catastophic Flooding: Implications for Riparian Restoration,
Restoration Ecology, vol.5, no.4S, December 1997, pp 75-84.
Hay, G.J & Castilla, G, 2006, Object-Based Image Analysis: Strengths, Weaknesses, Opportunities and Threats (SWOT), OBIA, 2006: The International Archives of the
Photogrammetry, Remote Sensing and Spatial Information Sciences.
Johansen, K., Coops, N. C., Gergel, S. E. & Stange, Y. Application of high spatial resolution satellite imagery for riparian and forest ecosystem classification. Remote
Sensing of Environment, In Press, Corrected Proof.
Lamb, D. W & Brown, R.B, 2001, Remote Sensing and Mapping of Weeds in Crops,
59 Lang, S & Blaschke, T, 2006, Bridging Remote Sensing and GIS-What are the main supportive pillars?, 1st International Conference on Object-Based Image Analysis
(OBIA, 2006)
Mather, P. M, 2004, Computer Processing of remotely sensed images: an
Introduction, 3rd Edition, Chichester, West Sussex, England
Mausel, P.W, Everitt, J.H, Escobar, D.E, & King, D.J, 1985, Airborne Videography: Current Status and Future Perspectives, Photogrammetric Engineering and Remote
Sensing, vol. 58, no.8, August 1992, pp 1189-1195.
Neale, C.M.U, 1997, Classification and Mapping of Riparian Systems Using Airborne Multispectral Videography, Restoration Ecology, vol.5, no.4S, December 1997, pp 103-112.
Peter Smith – Ultramedia, Aerial Photography & Video Specialists, viewed 2 October 2007, http://www.petersmith.com/
Price, P & Lovett, S, 2002, ‘Managing Riparian Land’, Fact Sheet 1, Land & Water, Canberra, Australia.
Queensland Murray Darling Committee, viewed 12 April 2007, http://www.qmdc.org.au/about-qmdc.html
Red Hen Systems, viewed 2 October 2007,
http://www.redhensystems.com/products/multimedia_mapping_software/geovideo/de fault.asp?sm=2
Richardson, A.J, Menges, R.M. & Nixon, P.R, 1985, Distinguishing weed from crop plants using video remote sensing, Photogrammetric Engineering and Remote
Sensing, vol. 51, no.11, November 1985, pp 1785-1790.
Russel, G.D, & Hawkins, C.P. & O’Neill, M.P, 1997, The Role of GIS in Selecting Sites for Riparian Restoration Based on Hydrology and Land Use, Restoration
Ecology, vol.5, no.4S, December 1997, pp 56-68
Walter, V, (2004), Object-based classification of remote sensing data for change detection, ISPRS Journal of Photogrammetry and Remote Sensing, vol.58, pp. 225-238.
Wulder, M. A, White, J.C, Magnussen, S. & McDonald, S, 2007, Validation of a large area land cover product using purpose-acquired airborne video. Remote Sensing of
Environment, 106, 480-491.
Yan, G, Mas, J.F, Maathuis, B.H.P, Xiangmin, Z & Van Dijk, P.M, 2006,
Comparison of pixel-based and object-oriented image classification approaches – a case study in a coal fire area, Wuda, Inner Mongolia, China, International Journal of
60 Yuan, F & Bauer, M. E, 2006, Mapping Impervious surface area using high resolution imagery: a comparison of object-based and per pixel classification, ASPRS 2006
Annual Conference, Reno, Nevada
Zhang, X & Feng, X, (2005), ‘Detecting Urban Vegetation from Ikonos Data Using an Object-Oriented Approach’, Geoscience and Remote Sensing Symposium, 2005.
IGARSS Proceedings, 2005 IEEE International, vol. 2, 25-29 July 2005 pp. 1475 -
62
APPENDIX B
Object – Oriented Classification Error Matrix Study Area Image: Agriculture
CLASSIFICATION ACCURACY ASSESSMENT REPORT --- Image File : e:/ecog/agriculturereclass.img
User Name : w0030444
Date : Wed Oct 17 21:34:23 2007
ERROR MATRIX ---
Reference Data ---
Classified Data Unclassifi Water Tree Cover Crops
--- --- --- --- ---
Unclassified 0 0 0 0
Water 0 10 1 0
Tree Cover 0 0 37 0
Crops 0 0 0 21
Shadow 0 1 0 0
Soil 0 0 0 0
Column Total 0 11 38 21
63
---
Classified Data Shadow Soil Row Total
--- --- --- ---
Unclassified 0 0 0
Water 0 0 11
Tree Cover 1 0 38
Crops 0 0 21
Shadow 9 0 10
Soil 0 20 20
Column Total 10 20 100
--- End of Error Matrix ---
ACCURACY TOTALS ---
Class Reference Classified Number Producers Users
Name Totals Totals Correct Accuracy Accuracy
--- --- --- --- --- ---
Unclassified 0 0 0 --- ---
Water 11 11 10 90.91% 90.91%
Tree Cover 38 38 37 97.37% 97.37%
Crops 21 21 21 100.00% 100.00%
Shadow 10 10 9 90.00% 90.00%
Soil 20 20 20 100.00% 100.00%
Totals 100 100 97
Overall Classification Accuracy = 97.00%
--- End of Accuracy Totals ---
64
---
Overall Kappa Statistics = 0.9600
Conditional Kappa for each Category. ---
Class Name Kappa
--- ---
Unclassified 0.0000
Water 0.8979
Tree Cover 0.9576
Crops 1.0000
Shadow 0.8889
Soil 1.0000
--- End of Kappa Statistics ---
65
APPENDIX C
Object – Oriented Classification Error Matrix Study Area Image: Forest
CLASSIFICATION ACCURACY ASSESSMENT REPORT --- Image File : e:/ecog/forestreclass.img
User Name : w0030444
Date : Wed Oct 17 20:23:29 2007
ERROR MATRIX ---
Reference Data ---
Classified Data Unclassifi Water Tree Cover Bare Soil
--- --- --- --- ---
Unclassified 0 0 0 0
Water 0 24 0 0
Tree Cover 0 1 60 0
Bare Soil 0 0 0 0
Grass Cover 0 0 1 0
Shadow 0 1 2 0
66
Reference Data ---
Classified Data Grass Cove Shadow Row Total
--- --- --- ---
Unclassified 0 0 0
Water 0 1 25
Tree Cover 0 1 62
Bare Soil 0 0 0
Grass Cover 0 0 1
Shadow 0 9 12
Column Total 0 11 100
--- End of Error Matrix ---
ACCURACY TOTALS ---
Class Reference Classified Number Producers Users
Name Totals Totals Correct Accuracy Accuracy
--- --- --- --- --- ---
Unclassified 0 0 0 --- ---
Water 26 25 24 92.31% 96.00%
Tree Cover 63 62 60 95.24% 96.77%
Bare Soil 0 0 0 --- ---
Grass Cover 0 1 0 --- ---
Shadow 11 12 9 81.82% 75.00%
Totals 100 100 93
Overall Classification Accuracy = 93.00%
67
KAPPA (K^) STATISTICS ---
Overall Kappa Statistics = 0.8682
Conditional Kappa for each Category. ---
Class Name Kappa
--- ---
Unclassified 0.0000
Water 0.9459
Tree Cover 0.9128
Bare Soil 0.0000
Grass Cover 0.0000
Shadow 0.7191
--- End of Kappa Statistics ---
68
APPENDIX D
Object – Oriented Classification Error Matrix Study Area Image: Urban
CLASSIFICATION ACCURACY ASSESSMENT REPORT --- Image File : e:/ecog/urbanreclass.img
User Name : w0030444
Date : Wed Oct 17 19:51:18 2007
ERROR MATRIX ---
Reference Data ---
Classified Data Unclassifi Water Tree Cover Bitumen
--- --- --- --- ---
Unclassified 0 0 0 0
Water 0 27 2 0
Tree Cover 0 1 44 2
Bitumen 0 0 0 7
Building 0 0 1 0
Shadow 0 0 0 0
Grass 0 0 0 1
69
Reference Data ---
Classified Data Building Shadow Grass Row Total
--- --- --- --- ---
Unclassified 0 0 0 0
Water 0 0 0 29
Tree Cover 0 1 0 48
Bitumen 0 0 0 7
Building 2 0 0 3
Shadow 0 11 0 11
Grass 0 0 1 2
Column Total 2 12 1 100
--- End of Error Matrix ---
ACCURACY TOTALS ---
Class Reference Classified Number Producers Users
Name Totals Totals Correct Accuracy Accuracy
--- --- --- --- --- ---
Unclassified 0 0 0 --- ---
Water 28 29 27 96.43% 93.10%
Tree Cover 47 48 44 93.62% 91.67%
Bitumen 10 7 7 70.00% 100.00%
Building 2 3 2 100.00% 66.67%
Shadow 12 11 11 91.67% 100.00%
Grass 1 2 1 100.00% 50.00%
Totals 100 100 92
70
--- End of Accuracy Totals ---
KAPPA (K^) STATISTICS ---
Overall Kappa Statistics = 0.8810
Conditional Kappa for each Category. ---
Class Name Kappa
--- ---
Unclassified 0.0000
Water 0.9042
Tree Cover 0.8428
Bitumen 1.0000
Building 0.6599
Shadow 1.0000
Grass 0.4949
--- End of Kappa Statistics ---
71