Software Process Evaluation: Experience Report
Aileen Cater-Steel
Senior Lecturer, Department of Information Systems Faculty of Business
University of Southern Queensland Toowoomba 4350
(Also PhD Student, Software Quality Institute, Griffith University) Australia
Abstract
Software Engineering Australia and the Software Quality Institute undertook a survey in 1999 to evaluate the level of adoption of best practice by software developers in Queensland. This paper explains how the survey evaluated the software processes in use and then describes a Process Improvement Program undertaken to measure the capability of software developers, based on the Software Process Improvement and Capability dEtermination (SPICE) standard. The two evaluation methods and their results are then compared and contrasted.
1. Introduction
Software Engineering Australia (SEA) is a not-for-profit association, funded under grants and in-kind contributions from government, universities and the private sector. Its aim is to harness Australian and international expertise and resources to deliver services that foster software engineering excellence in Australia. In 1997, the Minister for Industry, Science and Tourism commissioned a report by the Information Industries Taskforce. One of the report recommendations was to support the collection and dissemination of improved industry statistics and undertake regular benchmarking. Consequently, as part of the National Industry Improvement Project, SEA Qld and the Software Quality Institute (SQI) undertook a survey in 1999 to evaluate the level of adoption of best practice by software developers in Queensland. This paper explains how the survey evaluated the software processes in use and then describes a Process Improvement Program undertaken to measure the capability of software developers.
The first part of this paper explains the background and aims of the study, the execution of the survey, and presents some interesting findings related to levels of adoption of best practice. The questionnaire was adapted from the European Software Institute's (ESI) Best Practice Questionnaire and the preliminary findings from Queensland are compared with the ESI's results.
Further to the survey, many of the survey respondents were invited to participate in the Process Improvement Program, sponsored by SEA and conducted by SQI. A total of 25 organisations accepted the invitation. Based on the Software Process Improvement and Capability dEtermination (SPICE) standard ISO15504, an evaluation tool was developed and applied to enable rapid assessments of software organisations to be performed. The second part of the paper describes this evaluation tool and the method developed to assess the capability of these organisations.
2. Background
businesses employing about 55,000 persons (ABS 1997a). The software industry is also one of the fastest growing industries in Australia, growing at a rate of 15 per cent per annum (BSA 1998).
In formulating national policies and programs for the industry, it must be remembered that the Australian computer services industry is dominated by very small businesses - 88 percent employ less than five persons (ABS 1997b). A similar situation exists in the USA - Fayad et al. (2000) report 65 percent of data processing companies have less than five employees. This presents a challenge in terms of determining the current practices of industry participants, and in devising improvement initiatives which are feasible for these very small organisations.
In recent years, concern has been expressed about the need for the Australian Computer Services industry to achieve global competitiveness (Goldsworthy 1997, McKerlie 1996). Software process improvement is recognised as having the potential to improve competitiveness by increasing productivity; reducing costs, defect and rework; and improving time to market and customer satisfaction (El Emam & Briand 1997).
The survey, which forms part of the National Industry Improvement Program, was conducted by SEA Queensland and the Software Quality Institute (SQI) of Griffith University. The aim of the survey was to determine to what extent software developers are using best practice techniques. The survey was conducted initially in Queensland, is currently being administered in Western Australia, and is planned to be used in all remaining Australian states.
A best practice is defined as "a management practice that is widely recognised as excellent and is recommended by most practitioners and experts in the field" (ESI 1999). The European Software Institute (ESI) survey instrument has five sections:
• organisational issues (8 questions) addressing project management, change control, training programmes for managers;
• standards and processes (13 questions) covering formal assessment of benefits and risks, management reviews, control of subcontractors, independent audits, coding standards, formal handovers, test planning;
• metrics (8 questions) such as records of actual and estimated resources, error sources, test efficiency, computer performance, project tracking;
• control of the development process (6 questions) for example accountability for estimates and schedules, requirements management, control of code and specification changes, regression testing;
• tools and technology (7 questions) for instance use of design notations, automated testing tools, prototyping, data dictionary, project management tools.
3. Survey Methodology
The unit of analysis was Queensland organisations undertaking software development. The target population was all organisations in Queensland which develop software for sale (custom and commercial off-the-shelf developers) and in-house software developers of large organisations. Several sampling frames were used as a single list of all developers was not available. Rather than identify a sample of the population, the aim was to reach the entire population of organisations which develop software. As it was not possible to identify organisations undertaking software development from all organisations involved in the Information Technology and Communications industry, a list of 5,600 possible organisations was compiled, sourced from the Australia on Disk and MIS 3000 databases and contact lists from the Queensland Government's Information Industries Board and SQI.
3.1 Survey design
To overcome constraints of time and cost, the ESI was approached for permission to customise and use the ESI questionnaire. Permission was granted on the condition that minimal changes were made, and that the Australian results would be made available to ESI for comparison with the European data. During the pretest, concerns were raised about the section headings of the ESI questionnaire. It was decided to arrange the questions in more of a lifecycle sequence so that organisations with very few developers would feel less threatened by the survey format, and thus respond more readily. The new headings used were Requirements and Design (6 questions); Code and Test (13 questions); Configuration Management (5 questions); Estimates and Schedules (9 questions); and Project Management and Training (10 questions).
The format of the questionnaire was changed to appear more compact, and some questions were split to reduce ambiguity. Two additional questions were included in the body of the questionnaire to provide information relating to the use of programming languages and development tools. To further customise the instrument to local conventions, the ANZSIC list of industrial sectors was used in place of the European sector breakdown.
3.2 Data collection and analysis
A total of 5,600 survey forms were mailed in January 1999 with a cover letter and reply-paid envelope. As expected, many of the organisations did not develop software and more responses were returned from non-developers (354) than developers (209).
Table 1. Breakdown of responses by type
Response Type N
Valid Responses from software developers 209
Invalid responses from developers 3
Responses from non-developers 354
Undeliverable - correct address not found 408
Total returned 974
A web site was created to enable data entry. Microsoft Excel and SPSS were used to provide descriptive statistics, to assess normality, and to calculate correlations.
4. Survey Findings
It was recognised that some organisations may have multiple roles in the software industry. For example, most large organisations develop and use in-house systems as well as purchasing 3rd party software. Also, many software development companies produce off-the-shelf packages as well as providing custom-built systems to clients. The survey included a question to determine the primary involvement of organisations in the software industry. Although the question was worded to encourage respondents to select only one option as their primary involvement, the results (in table 2) show many respondents selected more than one option.
Table 2. Responses to primary involvement question Primary Involvement in Industry N
Software user - developed in-house 54
Software user - developed by a 3rd party 44 Software developer producing off-the-shelf systems 88 Software developer producing custom software systems 128 Research and Development Institute or University 10 Interest Group eg professional society or standards body 2
Other 5
Total options selected
Average options selected per respondent
331 1.6
4.2 Adoption levels
For each response, the level of adoption of the best practices was calculated. The number of "yes" responses to the 43 best practice questions were summed and a percentage calculated based on the proportion of "yes" responses to "yes" and "no" responses. Blank and "not applicable" responses were ignored in this calculation. Of the 209 valid responses, four provided demographic details but left the best practice section blank. These four responses were excluded from the analysis of adoption of best practice.
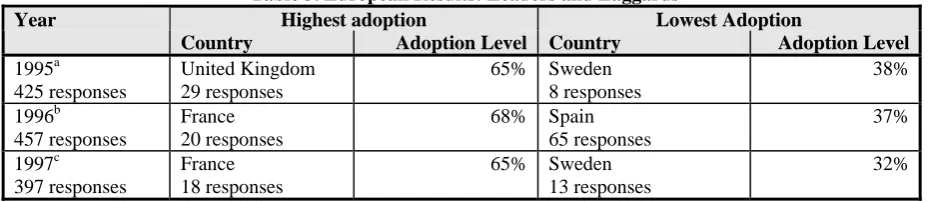
The mean adoption level of 47.5 percent with a standard deviation of 21 percent is slightly lower than the average reported by the ESI from its 1997 questionnaire (51% s.d.21%) (ESI 1999). Table 3 compares the leaders and laggards in best practice adoption from the ESI surveys 1995-1997.
Table 3. European Results: Leaders and Laggards
Highest adoption Lowest Adoption Year
Country Adoption Level Country Adoption Level
1995a
425 responses
United Kingdom 29 responses
65% Sweden 8 responses
38%
1996b
457 responses
France 20 responses
68% Spain 65 responses
37%
1997c
397 responses
France 18 responses
65% Sweden 13 responses
32%
(Source: a. Dutta et al. 1998; b. ESI 1996b; c. Dutta et al. 1999)
From the survey responses, a histogram of adoption levels was produced, and rather than the expected normal distribution, a bi-modal distribution occurred.
4.3 Adoption levels by size
[image:4.595.65.531.516.617.2]associated with organisation size. Large organisations exhibited much greater adoption than medium organisations, which in turn out-performed small companies.
Table 4. Average adoption levels by organisation size
Organisation Size N Average Adoption of Best Practice Level
Small: less than 10 staff 129 44.0%
Medium: 10-500 staff 65 52.9%
Large: more than 500 staff 11 56.4%
Looking at size from the perspective of the number of software developers engaged in programming or maintenance, a stronger pattern emerges. Organisations with fewer developers reported much lower average adoption of best practice compared to organisations with a large number of software developers, shown in table 5.
Table 5. Average adoption by development team size
Size of Development Team N Average Adoption of Best Practice Level
Small: 0-5 developers 139 43.0%
Medium: 5-50 developers 58 54.9%
Large: 50-500 developers 8 71.7%
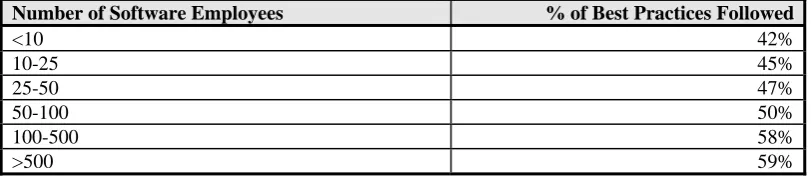
[image:5.595.66.472.407.496.2]The ESI survey conducted in 1995 also found that the size of the software organisation influences best practice levels as shown in table 6.
Table 6. ESI Results: Size of development team and Best Practice Level Number of Software Employees % of Best Practices Followed
<10 42%
10-25 45%
25-50 47%
50-100 50%
100-500 58%
>500 59%
(Source: ESI 1996a)
4.4 Assessing normality
Prior to undertaking any correlation analysis to statistically prove the association between variables such as organisation size and adoption of best practice, the characteristics of the data were explored to ensure the correct statistical approach was selected. The assumption of normality is a prerequisite for many inferential statistical techniques.
In this case, it was found that the distribution of the variable adoption level was not distributed normally. Smaller groups of responses, based on organisation size, development team size and involvement in the software industry were checked for normal distribution. The complimentary groups of commercial off-the-shelf (COTS) and non-COTS developers were the only subsets of responses which exhibit a normal distribution for the variable adoption level, and therefore represent difference populations. (Full details of the statistical analysis are available in Cater-Steel 2000).
4.5 Adoption levels by primary involvement
In comparing adoption levels of COTS and custom software developers, highest adoption of best practice was reported from organisations which develop COTS software (see table 7). According to the CEO of SEA Qld at that time, Phil Scanlan, the large number of developers (88) who saw their primary role as COTS developers reflects the large concentration of vertical niche market package developers in the Brisbane area.
Table 7. Comparison of adoption levels for COTS and custom developers Developer Type N Average Adoption Level
Develop COTS software 88 51.8%
Do not develop COTS software 117 44.3%
The large difference in adoption levels between the two groups of developers begs the question: Are there specific practices which have been more readily adopted by one group compared to the other? When adoption levels were analysed on a question by question basis, it was found that for the following five practices, COTS developers reported adoption levels of at least 17 percent higher than the non-COTS developers:
• maintain records from which all current versions and variants of software systems and their components can be quickly and accurately reconstructed in the development environment;
• establish a change control function for each software project;
• log, track and analyse post-implementation software problem reports;
• apply common coding standards to each software project; and
• use software tools used for tracking and reporting the status of the software /subroutines in the software development library.
In fact, there was only one practice where non-COTS developers exhibited higher adoption: the use of automated testing tools.
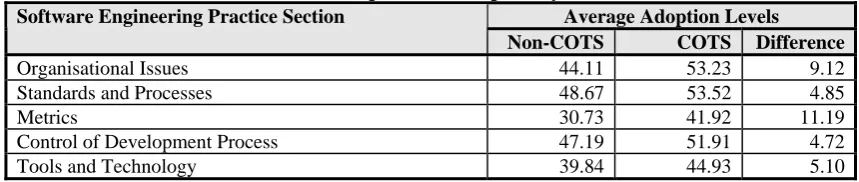
[image:6.595.69.499.557.648.2]The ESI questionnaire arranges the practices under five headings: organisational issues; standards and processes; metrics; control of the development process; and tools and technology. As can be seen from the data provided in table 8, COTS developers exhibit much higher adoption than non-COTS organisations for every section of practices.
Table 8. Comparison of adoption by ESI sections
Average Adoption Levels Software Engineering Practice Section
Non-COTS COTS Difference
Organisational Issues 44.11 53.23 9.12
Standards and Processes 48.67 53.52 4.85
Metrics 30.73 41.92 11.19
Control of Development Process 47.19 51.91 4.72
Tools and Technology 39.84 44.93 5.10
To gain an understanding of which software engineering practices are most used in Queensland, the highest scoring questions were collated and ranked for COTS and non-COTS developers (refer to table 9).
Table 9. Most used software engineering practices COTS
Rank
Practice
1 Each software project has a nominated project manager 1 2 Common coding standards are applied to each project 6 3 Appropriate level of user/customer/ marketing input is made throughout the project 2 4 Post-implementation problems are logged and their resolution tracked and analysed 7 5 Independent testing is conducted by users under SQA 3
Three of the most popular practices relate to coding and testing, the other two involve requirements and project management. This is not surprising, as the importance of these practices has been recognised in the industry press and stressed in information systems and software engineering training courses for some time.
5. Process Improvement Program
During the last six months of 1999, 25 organisations accepted the invitation from SQI to participate in the Process Improvement Program. This program was funded by SEA (Qld) for SEA members and was conducted at no cost to participants. Researchers at SQI developed a procedure to enable Rapid Assessments for Process Improvement for software Development (RAPID) (SQI 1999a). The RAPID method is based on ISO/IEC 15504 (SPICE) standard and designed to enable assessments to be performed in one day (Rout et al. 2000; SQI 1999b).
5.1 Evaluation Instrument
[image:7.595.64.540.473.575.2]The ISO 15504 standard sketches out a roadmap for the implementation of best practice in software engineering by defining 40 processes, divided into five categories: customer-supplier (10); engineering (9); support (8); management (4); and organisation (9). The process capability of each defined process evaluates to what extent the process achieves its defined purpose and objectives (SPIRE 1998 p57). Capability is measured in levels from incomplete (level 0) to optimising (level 5) as shown in table 10. These capability levels represent milestones along the road to software process improvement.
Table 10. Capability Levels Capability
Level
ISO 15504 SPICE Capability Levels Software Process Improvement in Regional Europe (SPIRE) Level Descriptions
0 Incomplete Chaos reigns
1 Performed Do your own thing
2 Managed Teams rule
3 Established The organisation learns
4 Predictable Management by number
5 Optimising Optimising
(Source: ISO/IEC TR 15504 and SPIRE 1998)
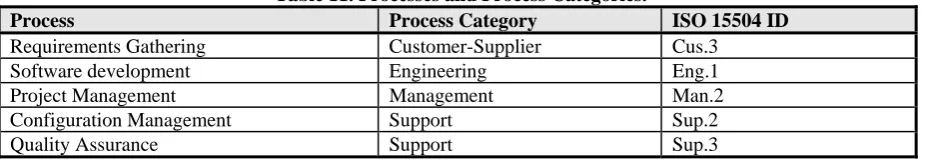
[image:7.595.67.531.647.727.2]As the RAPID assessments were restricted to one day each, rather than use the 40 processes defined in ISO 15504, only eight processes were evaluated, as listed in table 11.
Table 11. Processes and Process Categories.
Process Process Category ISO 15504 ID
Requirements Gathering Customer-Supplier Cus.3
Software development Engineering Eng.1
Project Management Management Man.2
Configuration Management Support Sup.2
Problem Resolution Support Sup.8
Risk Management Management Man.4
Process Establishment Organisation Org.2.1
Although ISO-15504 provides rating levels from 0 (incomplete) to 5 (optimising), for the RAPID assessments, only questions relating to levels 1 (performed), level 2 (managed) and level 3 (established) were included. Also, data were collected by interviews and discussion rather than examining actual work products such as project plans. Each evaluation was undertaken by two trained SPICE assessors, one in the role of team leader and the other as support assessor. A set of procedures and templates were prepared covering the demographic questionnaire, assessment plan, assessment instrument, assessment report, feedback form, follow-up meeting and final report.
5.2 Evaluation Procedure
Firstly, the assessment team leader contacted the sponsor of the organisation, and sent the demographic questionnaire to the sponsor for completion. Using the demographic information, a plan was compiled jointly by the team leader and the support assessor, and agreed to by the sponsor. On-site interviews were conducted by the team leader and support assessor with key people involved in managing the software development effort of the organisation. For each of the eight processes examined, the assessors followed the script of the assessment instrument to determine the extent to which the process attributes have been achieved using a four point scale: not achieved, partially achieved, largely achieved and fully achieved. The capability level (0,1, 2 or 3) for each process was then determined, based on the achievement of the process attributes.
A draft report was prepared by the assessment team leader and support assessor and forwarded to the sponsor at the organisation to confirm that the assessment team had accurately recorded the information discussed. Any changes suggested by the sponsor were discussed and then the assessment report was submitted to the organisation sponsor, SEA (Qld) and SQI. A feedback form was sent with the assessment report to the sponsor to solicit comments regarding the conduct and value of the assessment. Six months after the assessment, a half-day follow-up meeting was planned and the final report prepared for the organisation sponsor, SEA (Qld) and SQI.
5.3 Results from Process Improvement Program
To date, 25 assessments have been conducted with 21 assessment reports submitted. A few follow-up meetings and final reports have been completed, but many organisations requested the follow-up meeting be postponed as all their resources were absorbed implementing the new Australian Goods and Services Tax for the current financial year.
All except one of the 25 organisations were located in Brisbane. Based on the 21 assessments reports completed, there were four small organisations (less than five developers), 14 medium size (from five to 50 developers), and three large organisations (greater than 50 developers).
0% 20% 40% 60% 80% 100% Requirements Gathering
Softw are Development Project Management Configuration Management Quality Assurance Problem Resolution Risk Management Process Establishment
Level 0 Incomplete
Level 1 Performed
Level 2 Managed
Level 3 Established
From the 21 assessment reports available at this time, a profile of capability level ratings shows (figure 1) that the weakest processes are process establishment and quality assurance. On the other hand, more than half the organisations have achieved either managed or established levels for requirements gathering. Software development and configuration management processes were also quite strong with a significant proportion of organisations assessed at either the managed or established level.
6. Comparison of Survey Results and RAPID Findings
As the ESI survey was partially based on the SPICE standard and the RAPID method was wholly based on SPICE, it would be expected that the survey results regrading best practice adoption would correlate with the RAPID results. To enable the survey results to be compared with the RAPID findings, a Capability Score was calculated by assigning values to the extent of achievement of the process attributes for each of the eight processes:
• not achieved - zero points
• partially achieved - 1 point
• largely achieved - 2 points
• fully achieved - 3 points.
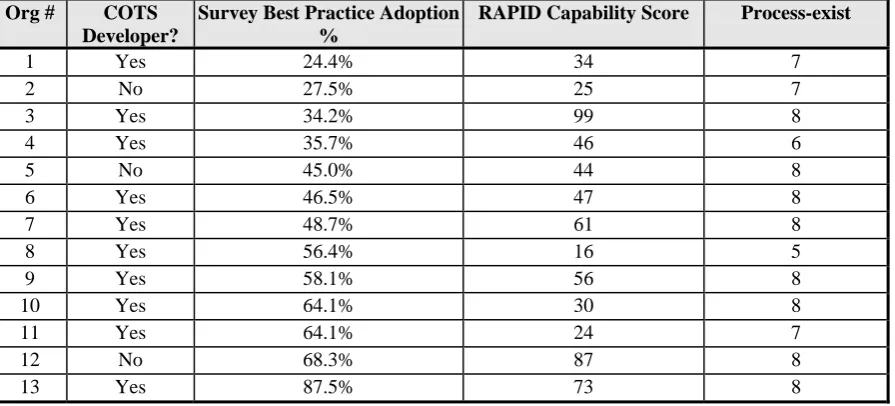
Although all assessed organisations were members of the SEA, some had not responded to the survey. Hence, both survey and RAPID data were available for only 13 of the assessed organisations. The best practice adoption results from the survey and the corresponding Capability Score from the RAPID assessment for these 13 organisations are shown in Table 12. The results are in order from lowest to highest best practice adoption.
The ESI questionnaire is designed to assess the existence, not the adequacy, of best practices (Dutta et al. 1999). On the other hand, the RAPID assessment evaluates the existence, use and further development of software management processes. In order to adapt the RAPID results closer to the design of the ESI questionnaire, a variable "process-exist" was derived to represent how many of the eight processes existed in each organisation. Process-exist counts how many of the processes are fully, largely or partially achieved as opposed to not achieved. Table 12 lists the values of the "process-exist" score. A weak relationship was found between the level of best practice adoption reported in the survey and the existence of RAPID processes (Kendall's tau 0.2660, p>.12; Spearman Rank Correlation Coefficient= 0.3491, p>.12).
Table 12. Comparison of Survey Best Practice Adoption, RAPID Capability Score, and Process-exist Score
Org # COTS Developer?
Survey Best Practice Adoption %
RAPID Capability Score Process-exist
1 Yes 24.4% 34 7
2 No 27.5% 25 7
3 Yes 34.2% 99 8
4 Yes 35.7% 46 6
5 No 45.0% 44 8
6 Yes 46.5% 47 8
7 Yes 48.7% 61 8
8 Yes 56.4% 16 5
9 Yes 58.1% 56 8
10 Yes 64.1% 30 8
11 Yes 64.1% 24 7
12 No 68.3% 87 8
13 Yes 87.5% 73 8
It is interesting to note that in the Process Improvement Program, the small organisations (less than 5 software developers) averaged a higher RAPID Capability Score (52.5) than the medium sized organisations (40.6). The large organisations (more than 50 software developers) achieved the highest average RAPID Capability Score of 72.7.
6. Discussion
On the other hand, the Process Improvement Program provided many small organisations with an objective assessment of the strengths and weaknesses of their key processes against a model of industry best practice by qualified SPICE assessors. Most of the organisations, especially the smaller ones, would not be able to pay commercial rates for such an assessment. The feedback from the organisations praised the professionalism of the assessors, the relevance of the recommendations in the assessment report, and expressed appreciation to SEA for the opportunity to participate in such a valuable program. Many of the managers had an idea of areas they wished to target for improvement, and the assessment provided the opportunity for the key developers in these organisations to discuss their processes with the SPICE assessors and commit to a plan.
Prior to the survey execution, one of the members of the SEA National Board questioned the relevance of the survey to COTS developers. He raised the point that Australian COTS developers may be using excellent practices which are not included in the ESI questionnaire, for example, management of beta tests. If this is the case, then the adoption levels from the ESI questionnaire may not provide an entirely valid measurement of best practice. This point is acknowledged by the ESI: "progress in software engineering may not be visible along dimensions measured in the survey" (ESI 1998 p.29).
Another issue to consider is that software practices may have changed significantly in the six years since the ESI questionnaire was designed. For example, reuse is now recognised as one of the most valuable software engineering practices (Mili et al. 1995) but is not included in the ESI questionnaire. Longitudinal studies such as that undertaken by the ESI are valuable in mapping the take-up rate of recommended techniques and practices but the data collection tools need to be kept up-to-date whist still providing comparative data. This presents a challenge to researchers to identify and integrate new practices into the questionnaire.
The concept of Software Engineering was first identified at a 1968 conference of the NATO Science Committee in Garmisch, Germany (Naur & Randell 1969). The term "software crisis" has been used since the late 1960s in relation to recurring system development problems resulting in projects which are over budget, over time and which are not able to satisfy the requirements of the client. In the late 60s, the main source of large scale software was development contracts issued by the U.S. Department of Defense, and "since then, virtually all software engineering literature has concentrated explicitly or implicitly on the model of DoD contract software development" (Fayad et al. 2000 p.115). Today, the software development contract effort for large governments departments is dwarfed by mass-market software, much of which is produced by small companies. Fayad et al. (2000) raise the point that issues such as company size, development mode (contract vs COTS), development size (program size, shipped volume) and development speed have not been adequately addressed in the software engineering literature. In particular, they believe that start-up firms have specialised needs which cannot be met by traditional software engineering models.
7. Conclusion
those from Queensland. The proportion and best practice adoption level of COTS developers will be of particular interest in relation to the Queensland findings.
Although all the follow-up meetings for the Process Improvement Program have not yet been completed, feedback from the participant organisations has been positive. Thompson (1994) is concerned that technology transfer of appropriate software engineering practices is inhibited by management and developers because they often have poor attitudes towards change. He advises that the software development community needs a much better understanding of the practices, their use and potential benefits. It is hoped that through the publication of these success stories from the Process Improvement Program, local developers will appraise such information in an impartial manner and adopt best practice willingly and with enthusiasm.
A valuable outcome of the Process Improvement Program is the development of the RAPID evaluation tool which provides a realistic option to very small development organisations which traditionally lack the resources to undertake full-blown software process assessments. With the Australian software community dominated by very small organisations (88 percent have less than five staff), this program may provide valuable opportunities for such developers to evaluate and improve their processes, thereby achieving success in domestic and global markets.
Funding has been made available to provide full SPICE assessments and mentoring for two of the Process Improvement Program participants. It is anticipated that case studies, in a similar format to the SPIRE (Software Process Improvement in Regional Europe) Case Studies will be compiled and published. The Federal Government's support for software incubators, such as the one operating at SEA Qld, promises an opportunity for small start-up companies to overcome traditional resource limitations. These steps may facilitate the achievement of the goal of improved global competitiveness for the Australian software industry.
REFERENCES
ABS (1997a) Computing Services Industry, Australia 1995-96, Australian Bureau of Statistics, Canberra.
ABS (1997b) Information Technology in Australia 1995-96, Australian Bureau of Statistics,
Canberra.
BSA (1998) The Contribution of Packaged Software Industry to the Australian Economy, Business Software Alliance, December.
Cater-Steel A.P. (2000) "COTS Developers Lead Best Practice Adoption", in ASWEC'2000,
Canberra.
Dutta, S., Lee M. & Van Wassenhove, L. (1999) "Software Engineering in Europe: A Study of Best Practices", IEEE Software, May/June, pp82-90.
Dutta, S. & Van Wassenhove, L. N. (1997) "An Empirical Study of Adoption Levels of Software Management Practices Within European Firms", Report 97/118/TM, INSEAD, Fontainebleau, France, [Online], Available from URL: http://xrise.insead.fr/risenew/ [Accessed 19 July 2000].
Dutta, S., Van Wassenhove, L., Kulandaiswamy, S. (1998) "Benchmarking European Software Management Practices, Communications of the ACM, June, pp77-86.
Fayad, M. E., Laitinen, M., Ward, R.P. (2000) "Software Engineering in the Small",
Communications of the ACM, vol 43, no. 3, pp115-118.
ESI (1996a) 1995 "Software Best Practice Questionnaire Analysis of Results", [Online], Available from URL:http://www.esi.es/Publications/Reports/tr-sbpqaor.html [Accessed 19 July 2000]
ESI (1996b) 1996 "Software Best Practice Questionnaire Analysis of Results", [Online], Available from URL: http://www.esi.es/Publications/Reports/tr-sbpqaor2.html, [Accessed 19 July 2000].
ESI (1998) "Software Best Practice Questionnaire: Trend Analysis 1995-1997", [Online], Available from URL: http://www.esi.es/Publications/Reports/tr-sbpqta.html, [Accessed 19 July 2000].
ESI (1999) "1997 Software Best Practice Questionnaire: Analysis of Results", [Online], Available from URL: http://www.esi.es/Publications/Reports/tr-sbpqaor3.html, [Accessed 19 July 2000]
Goldsworthy, A. (1997) "The Global Information Economy - The Way Ahead - Executive Summary", Report of the Information Industries Taskforce, DIST, August.
McKerlie Consulting (1996) "Needs Analysis for Enhancement for Software Development Capability within Australian Industry", DIST.
Mili, H., Mili, F. and Mili, A. (1995) "Reusing Software: Issues and Research Directions",
IEEE Transactions on Software Engineering, 26(6), pp528-561.
Naur, P. & Randell, B. (Eds) (1969) Conference on Software Engineering, NATO Scientific Affairs Division, Garmisch, Germany.
Rout, T.P., Tuffley, A, Cahill, B. & Hodgen, B. (2000) "The Rapid Assessment of Software Process Capability", SPICE 2000, Limerick, pp47-55.
Software Quality Institute (1999a) "Method for the RAPID Assessment of Process Capability", Griffith University, Brisbane, Queensland, Australia, 30 August.
Software Quality Institute (1999b) "Process Model for the RAPID Assessment of Process Capability", Griffith University, Brisbane, Queensland, Australia, 30 June.
SPIRE (1998) The SPIRE Handbook: Better, Faster, Cheaper Software Development in
Small Organisations, SPIRE Project, CSE, DCU, Dublin, Ireland.
Thompson, J.B. (1994) "The Development of Quality Software: Problems and Solutions",
Software Quality Concern for People: Proceedings of the 4th European Conference on