promoting access to White Rose research papers
White Rose Research Online [email protected]
Universities of Leeds, Sheffield and York
http://eprints.whiterose.ac.uk/
This is the author’s post-print version of an article published inNature Climate Change
White Rose Research Online URL for this paper:
http://eprints.whiterose.ac.uk/id/eprint/76085
Published article:
Ledger, M.E., , Brown, LE, , Edwards, F, , Milner, A.M., and Woodward, G., (2013) Drought alters the structure and functioning of complex food webs.Nature Climate Change, 3 (3). 223 - 227. ISSN 1758-678X
Drought alters the structure and functioning of complex food webs
12
Mark E. Ledger1, Lee E. Brown2, François K. Edwards1,3, Alexander M. Milner1,4, Guy 3
Woodward5 4
5
1
School of Geography, Earth and Environmental Sciences, University of Birmingham, 6
Edgbaston, Birmingham, B15 2TT, UK. 7
2
School of Geography/water@leeds, University of Leeds, Woodhouse Lane, Leeds, LS2 9JT, 8
UK. 9
3
Centre for Ecology and Hydrology, Maclean Building, Benson Lane, Crowmarsh Gifford, 10
Wallingford, OX10 8BB, UK. 11
4
Institute of Arctic Biology, University of Alaska, Fairbanks, Alaska 99775, USA. 12
5
School of Biological and Chemical Sciences, Queen Mary, University of London, London, 13
E1 4NS, UK. 14
Correspondence: Dr Mark Ledger, School of Geography, Earth and Environmental Sciences, 15
University of Birmingham, Edgbaston, Birmingham, B15 2TT, UK. email: 16
[email protected], phone 0121 414 5540, fax 0121 414 5528. 17
Climate change is expected to make many regions of the world much drier over coming 19
decades1,2. Rivers will be transformed as drought becomes more frequent3 with 20
potentially severe but largely unknown consequences at the higher (multispecies) levels 21
of organisation4. Food webs are complex networks of species and their interactions5, 22
and here we show experimentally how the intensification of drought may alter their 23
underlying structure and functioning (biomass flux dynamics) profoundly in fresh 24
waters. Drought triggered substantial losses of species and interactions, especially 25
among rare predators, leading to the partial collapse of the webs. Total resource-26
consumer biomass flux was also strongly suppressed by disturbance, yet several 27
network-level properties (e.g. connectance, interaction diversity) were conserved, driven 28
by consumer resource fidelity, and a substantial reconfiguration of fluxes within the 29
webs as production shifted down the size spectrum from large to small species. Our 30
research demonstrates that drier climates could have far-reaching impacts on the 31
functioning of freshwater ecosystems. 32
Climate change is altering the global water cycle1-3, with extensive impacts on local 33
ecosystems4,6. In fresh waters, future shifts in the distribution of water will alter river flows 34
and create new hydrologic regimes3. Declining rainfall and overuse of water are predicted to 35
increase the intensity and frequency of droughts in river systems3, threatening the structure 36
and functioning of food webs, and their provision of valuable ecosystem goods and services4, 37
such as biomass production6. Many species adapted to life in permanently flowing waters are 38
vulnerable to drought7-9, and declining, intermittent flows could modify habitats, stripping 39
away sensitive species and size classes9-10, with unknown but potentially powerful impacts on 40
food web architecture and dynamics. Biomass fluxes among species are key to understanding 41
such changes because they determine ecosystem production, nutrient cycling, and resilience 42
species and feeding paths, eroding resilience to future change by removing alternative trophic 44
pathways5. This could be mitigated, however, where compensatory mechanisms (e.g.
45
increased production of small taxa as large individuals are lost) reconfigure the food web 46
sufficiently to maintain ecosystem functioning in the face of disturbance11. 47
Despite the potential for drought disturbance to alter food web dynamics, previous 48
research has focused on structural attributes of communities12-14 and little empirical evidence 49
exists for predicting future change on functioning at these higher levels of organisation6. 50
Most studies of stream drought have focused on predictable seasonal events and have not 51
addressed how the novel intensified droughts forecast by regional climate models may 52
reshape stream ecosystems15. Here, we report the results of an experimental manipulation of 53
highly taxonomically resolved quantified stream food webs conducted to measure the impacts 54
of supraseasonal drought on trophic structure and dynamics. We tested two hypotheses: first, 55
that drought disturbance would generate turnover in biomass production, with small r -56
selected species replacing larger, longer-lived taxa with moreK-selected traits16, and second, 57
that dietary generalists would benefit over specialists17, modifying network properties and 58
biomass flux. 59
Eight replicate mesocosms (stream channels 0.3 m x 12 m) fed by a river in southern 60
England were subjected to intermittent flow (6-days of dewatering per month), mimicking 61
supraseasonal droughts8,9 that cause repeated stream drying (see Methods), or left as 62
unmanipulated controls (under perennial flow), for two years. At the end of the experiment 63
we examined treatment effects on taxon richness and biomass of benthic assemblages and 64
quantified network properties and biomass flux through the food webs. Food web nodes and 65
links were identified by direct observation from benthic counts and gut contents analysis 66
quantitative food web metrics (e.g. connectance, linkage density) were used to characterise 69
drought impacts on network architecture and fluxes20. The webs, which are among the most 70
highly-resolved published to date, collectively encompassed 783 pairwise trophic interactions 71
among 84 trophic elements, which consisted of detrital resources (leaf litter and amorphous 72
detritus [i.e., organic matter produced by biofilms]), fungi, benthic algae (green algae, 73
diatoms and cyanobacteria; Supplementary Table 1) and a taxonomically diverse array of 74
macroinvertebrate consumers (e.g., amphipod shrimps, beetles, leeches, snails, worms and 75
larval alderflies, caddisflies, mayflies, stoneflies and midges; Supplementary Table 2). 76
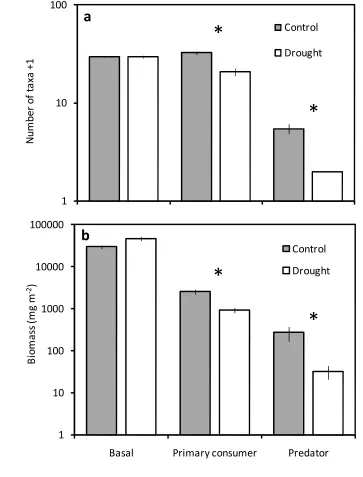
Drought significantly reduced the number of species (by 21%, from mean 61.0 ± SE 77
1.6 to 48.0 ± 1.5, ANOVA F1,3= 28.5, P < 0.05) and links (by 34%, from 376.3 ± 36.2 to 78
248.0 ± 23.1, ANOVA F1,3 = 21.77, P = 0.019), although resilience to drought varied 79
markedly among trophic groups (Fig. 1, 2). The taxon richness and biomass of basal 80
resources was maintained (Fig. 1), despite a marked shift in dominance from encrusting green 81
algae to diatoms21. In contrast, 37% of invertebrate primary consumer taxa were eliminated 82
by drought and their biomass was suppressed by 64%. Extinction was most profound among 83
the predators (78% loss of taxa, Fig. 1a), whose biomass collapsed by 88% under drought 84
(Fig. 1b). For primary and secondary consumers, local extinctions were associated strongly 85
with rarity (logistic regression, χ2
= 9.398, P= 0.002). A particularly striking result was that 86
drought eroded food webs from the top-down, reducing proportions of predators and primary 87
consumers relative to basal species. The loss of predators reduced mean (from 1.49 ± 0.17 to 88
1.09 ± 0.01, ANOVA F1,3= 25.36, P = 0.015) and maximum (from 2.53 ± 0.05 to 2.16 ± 89
0.04, ANOVA, F1,3 = 11.73, P = 0.042) food chain length, consistent with theoretical 90
predictions and field surveys along disturbance gradients13,14. Drought caused high mortality 91
among predators stranded in unfavourable habitat19. Potential food limitation was, however, 92
our first hypothesis thatr-selected species would exploit disturbance. This reflected a general 94
shift away from larger taxa that had greater access to ‘size refugia’ from predation towards a 95
morer-selected assemblage better able to access physical refugia from drought19. 96
Food webs were largely detritus-based in both treatments, with biomass fluxes from 97
detritus accounting for 96% of all flux (including to predators), and 90 % of biomass flux was 98
channelled through just 5% of links (Fig. 3). The largest fluxes were from amorphous detritus 99
(i.e. autochthonous organic matter produced by biofilms) to snails (Radix balthica L., 100
Potamopyrgus antipodarum L., mean 46% of flux to primary consumers). Only a small 101
proportion of fluxes to primary consumers were transferred to predators (2.2%), because in 102
both treatments many of the primary consumers (e.g. snails, caddis, shrimps) were too large 103
(max. body mass 42 mg) for the gape-limited predators (max. body mass 32 mg) to handle. 104
These size disparities between invertebrate predators and prey may effectively decouple their 105
production in the webs22. 106
Drought strongly suppressed the total amount of biomass flux through the food webs 107
by 59.8% (from 98.9 to 39.8 g m-2 yr-1; Fig. 3a), despite extensive reconfiguration of fluxes 108
among surviving species: i.e. network restructuring did not fully maintain ecosystem 109
functioning. Biomass flux increased through 43% of links, whereas drought caused steep 110
reductions in the remaining pathways, including major fluxes to the highly productive snail 111
populations (maximum 95 % reduction of 43.6 g m-2 yr-1 toPotamopyrgus antipodarumL.). 112
Shifts in biomass flux (i.e. faster vs. slower) to consumers were related to their body mass 113
(logistic regression, χ2
= 9.808,P= 0.002), with increasing fluxes confined to small taxa such 114
as midge larvae, and profound reductions for larger species, including snails, amphipod 115
shrimps, caddis and mayfly larvae (Fig. 3b). This pronounced shift of production downwards 116
fluxes within the webs (Fig. 3; equivalent interaction evenness among treatments, Table 1), 118
precluding the potentially destabilising concentration of biomass within fewer species5. 119
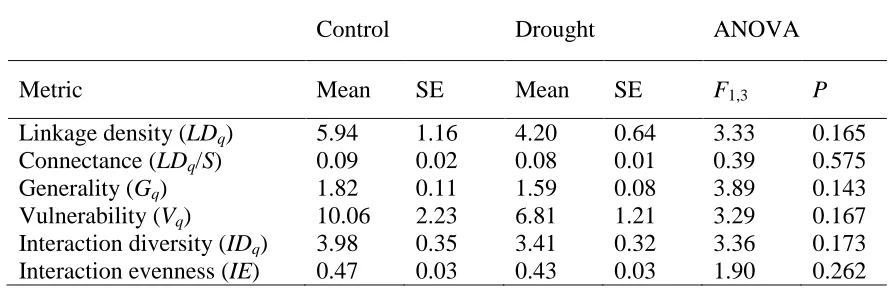
Surprisingly, several structural network properties (linkage density, connectance and 120
interaction diversity) were unaffected by drought (ANOVAP> 0.05, Table 1, Supplementary 121
Table 3) as were absolute and weighted measures of generality (numbers of resources per 122
consumer) and vulnerability (numbers of consumers per resource). These five metrics are a 123
manifestation of foraging behaviour and resource availability23, and their constancy suggests 124
consumer diets were consistent in the face of disturbance. Contrary to our second hypothesis, 125
we found no evidence that disturbance promoted trophic generalists over specialists through 126
indirect effects on food supply17, which would increase web connectance and linkage density. 127
Rather, our data show drought acted directly by increasing consumer mortality through 128
physiological stress19, with large species being most strongly affected, likely reflecting their 129
relatively high metabolic demands24. 130
Fresh waters are particularly vulnerable to climate change25 and our results 131
demonstrate that the present and future intensification of drought may have major effects on 132
both biodiversity and ecosystem processes. The food webs underwent considerable 133
restructuring in trophic height and the magnitude and distribution of biomass fluxes, driven 134
by a reduction in consumer body-size, consistent with the emerging view that global change 135
tends to have disproportionately strong negative effects on larger species10. However, the 136
shift in biomass production from large to small species could not compensate fully for losses 137
among the former, resulting in reduced overall biomass flux. Similar functional impairments 138
of food webs can be expected in regions where future climate change exacerbates drought19. 139
Such changes have implications for the future stability of food webs in an era of rapidly 140
changing climate, as they could temper the effects of perturbations11,26. 141
METHODS 143
Experimental design and application 144
A drought experiment was conducted over 24 months (March 2000 – February 2002) in four 145
blocks of two linear stream mesocosms (width 0.33 m, length 12 m, depth 0.30 m) sited 146
outdoors adjacent to, and fed by, a chalk stream at the Freshwater Biological Association 147
River Laboratory, UK (50°40’48’’N, 2°11’06’’W)19,21 (see Supplementary Method 1). The 148
mesocosms replicate reaches of small headwater streams with stony beds and shallow 149
subsurface sediments (20 cm depth)19. Following a two-month colonization period, an 150
intermittent flow regime (6 days of flow cessation per month) was applied to one mesocosm 151
in each block, mimicking supraseasonal hydrologic drought8,9. This simulated hydrograph 152
approach allowed us to gauge how the biota responded to repeated stream drying caused by 153
low rainfall29 and/or overabstraction30 as two predicted consequences of future climate 154
change under Intergovernmental Panel on Climate Change (IPCC) scenarios1,2. As with all 155
mesocosm experiments, our flow manipulations necessitated some trade-off between realism 156
and replication19,21. Specifically, the simulated hydrograph may adequately capture the 157
expected changes in the magnitude and frequency of river drying under climate change but 158
does not necessarily mimic the expected changes in seasonality of these events. During 6-d 159
dewatering, surface flows ceased and exposed substrata dried in patches, although water 160
remained in the interstices beneath the bed surface, and small pools persisted at intervals 161
along the length of the dewatered channels19,21. Surfaces of exposed substrata dried at natural 162
ambient rates such that the stress experienced by organisms stranded in the mesocosms was 163
consistent with those in adjacent drying stream reaches19. In the control mesocosms, flows 164
were continuous throughout the experiment. 165
Estimates of invertebrate biomass were made from samples (Surber sampler 0.025m2, 300 167
µm mesh, n=3 per channel) collected monthly from each mesocosm. Invertebrate secondary 168
production was calculated from biomass, determined from 63,092 individual body length 169
measurements, using the size-frequency method (see Supplementary Methods 2), as part of a 170
related study19. At the end of the experiment (after two years), we collected the entire 171
macroinvertebrate assemblage in each mesocosm, using samples to construct food webs by 172
direct observation of feeding links in 3,643 individuals in total, and determined biomass of 173
basal resources (detritus and algae) as the ash-free dry mass of material collected from the 174
surfaces of mineral substrata (n=8) in each mesocosm21. 175
176
Food web construction 177
Binary food webs were constructed based on the presence/absence of resources in the diet of 178
consumers. These webs were then quantified, with links expressed as flows of biomass from 179
resources to consumers for each mesocosm community, using estimates of secondary 180
production19. The trophic basis of production method was used to quantify directly-observed 181
feeding links as biomass flux (Fij, g m-2 yr-1) from resource i to consumer j (see 182
Supplementary Method 3). 183
184
Qualitative and quantitative food web metrics 185
Metrics derived from binary webs based on the presence-absence of feeding links were: web 186
size (S, the number of trophic elements in each web), number of pairwise feeding links (L), 187
linkage density (L/S), directed connectance, the proportion of all possible links realised 188
(L/S2), generality (number of resources per consumer, L/Sconsumer), vulnerability (number of 189
consumers per resource,L/Sresource), and mean and maximum food chain length27. Quantified 190
quantified weighted measures of linkage density (LDq), interaction diversity (IDq), 192
interaction evenness (IEq), generality (Gq) and vulnerability (Vq) (see Supplementary 193
Method 4). 194
195
Data Analysis 196
Three-way analysis of variance (ANOVA) was used to test the effect of drought treatment, 197
trophic group and experimental block on taxon richness and biomass (in SPSS 16.0, Chicago, 198
IL, USA). The analysis revealed a significant (P < 0.05) interaction between treatment and 199
trophic position and two-way ANOVAs were performed subsequently to test for treatment 200
and block effects on each trophic group. Treatment and experimental block were fixed factors 201
in the analyses and data were log-transformed to homogenise variances. ANOVA also 202
determined effects of treatment and block on food web metrics. Significance levels were 203
adjusted for multiple tests using sequential Bonferroni correction. Logistic regressions tested 204
for relationships between consumer extinctions (binary variable) and ln (abundance), ln (body 205
mass), ln (body length) and voltinism (>1, 1, <1 cycles per year), and between directional 206
shifts in energy flux (increase or decrease under drought, binary variable) and ln (body mass), 207
ln (body length) and voltinism. The presence-absence of consumer species in each web was 208
determined from the collection of the whole community at the end of the experiment. 209
210
211
212
References
1. Beniston, M.et al. Future extreme events in European climate: an exploration of regional 214
climate model projections.Climate Change81, 71-95 (2007). 215
2. IPCC, Climate Change 2007: Impacts, Adaptation and Vulnerability. Contribution of 216
Working Group II to the Fourth Assessment, Report of the Intergovernmental Panel on 217
Climate Change, eds Parry, M. L., Canziani, O. F., Palutikof, J. P., van der Linden, P. J. & 218
Hanson, C. E. (Cambridge University Press, Cambridge, UK, 2007). 219
3. Milly, P. C. D., Dunne, K. A. & Vecchia, A. V. Global pattern of trends in stream flow and 220
water availability in a changing climate.Nature438, 347-350 (2005). 221
4. Vörösmarty, C. J. et al. Global threats to human water security and river biodiversity. 222
Nature467, 555-561 (2010). 223
5. Tylianakis, J. M., Tscharntke, T. & Lewis, O. T. Habitat modification alters the structure 224
of tropical host-parasitoid food webs.Nature445, 202-205 (2007). 225
6. Woodward, G. et al. Ecological networks in a changing climate. Adv. Ecol. Res. 42, 72-226
138 (2010). 227
7. Boulton, A. J. Parallels and contrasts in the effects of drought on stream macroinvertebrate 228
assemblages.Freshw. Biol.48, 1173-1185 (2003). 229
8. Lake, P. S. Ecological effects of perturbation by drought in flowing water. Freshw. Biol.
230
48, 1161-1172 (2003). 231
9. Lytle, D. A. & Poff, N. L. Adaptation to natural flow regimes.Trends. Ecol. Evol.19, 94-232
10. Daufresne, M., Lengfellner, K., & Sommer, U. Global warming benefits the small in 234
aquatic ecosystems.Proc. Natl. Acad. Sci. USA.106, 12788-12793 (2009). 235
11. Ives, A. R. & Cardinale, B. J. Food-web interactions govern the resistance of 236
communities after non-random extinctions.Nature429, 174-177 (2004). 237
12. Closs, G. P. & Lake, P. S. Spatial and temporal variation in the structure of an 238
intermittent-stream food-web.Ecol. Monogr.64, 1-21 (1994). 239
13. Walters, A.W. & Post, D. M. An experimental disturbance alters fish size structure but 240
not food chain length in streams.Ecology89, 3261-3267 (2008). 241
14. Sabo, J. L., Finlay, J. C., Kennedy, T. & Post, D. M. The role of discharge variation in 242
scaling of drainage area and food chain length in rivers.Science330, 965-967 (2010). 243
15. Bogan, M. T. & Lytle, D. A. Severe drought drives novel community trajectories in desert 244
stream pools.Freshwat. Biol.56, 2070-2081 (2012). 245
16. Pianka, E. R. OnrandKselection.American Naturalist104, 592-597 (1970). 246
17. Vázquez, D. P. & Simberloff, D. Ecological specialization and susceptibility to 247
disturbance: conjectures and refutations.American Naturalist159, 606-623 (2002). 248
18. Benke, A. C. & Wallace, J. B. Trophic basis of production among riverine caddisflies: 249
implications for food web analysis.Ecology78,1132-1145 (1997). 250
19. Ledger M. E., Edwards F. K., Brown L. E. & Milner A. M. Woodward G. Impact of 251
simulated drought on ecosystem biomass production: an experimental test in stream 252
mesocosms.Global Change Biol.17, 2288-2297 (2011). 253
21. Ledger, M. E., Harris, R. M. L., Armitage, P. D. & Milner, A. M. Disturbance frequency 256
influences patch dynamics in stream benthic algal communities. Oecologia 155, 809-819 257
(2008). 258
22. Davis, J. M., Rosemond, A. D., Eggert, S. L., Cross, W. F. & Wallace, J. B. Long-term 259
nutrient enrichment decouples predator and prey production.Proc. Natl. Acad. Sci. USA.107, 260
121-126. 261
23. Beckerman, A. P., Petchey O. L. & Warren, P. H. Foraging biology predicts food web 262
complexity.Proc. Natl. Acad. Sci. U.S.A.103, 13745-13749 (2006). 263
24. Brown, J. H., Gilooly, J. F., Allen, A. P., Savage, V. M. & West, G. B. Toward a 264
metabolic theory of ecology.Ecol. Lett.85, 1173-1185 (2004). 265
25. Heino, J., Virkkala, R. & Toivonen, H. Climate change and freshwater biodiversity: 266
detected patterns, future trends and adaptations in northern regions. Biol. Rev. 84, 39-54 267
(2009). 268
26. de Ruiter, P. C., Wolters, V., Moore, J. C. & Winemiller, K. O. Food web ecology: 269
playing Jenga and beyond.Science309, 68-69. 270
27. Brown, L. E., Edwards, F., Milner, A. M., Woodward, G. & Ledger, M. E. Food web 271
complexity and allometric scaling relationships in stream mesocosms: implications for 272
experimentation.J. Anim. Ecol.80, 884-895 (2011). 273
28. Hynes, H. B. N. & Coleman M. J. A simple method of assessing the annual production of 274
stream benthos.Limnol. Oceanogr.13, 569-573 (1968). 275
29. Davey, A. D. & Kelly D. J. Fish community responses to drying disturbances in an 276
30. Finn, M.A., Boulton, A.J., Chessman, B.C. Ecological responses to artificial drought in 278
two Australian rivers with differing water extraction.Fundam. Appl. Limnol.175, 231-248 279
(2009). 280
281
Acknowledgements 282
The Freshwater Biological Association (FBA) and the Centre for Ecology and Hydrology 283
generously supported this research. We would like to thank Rebecca Harris and Patrick 284
Armitage for their significant contribution to the project. Russell Death, Jose Montoya and 285
three anonymous referees provided helpful comments that improved the manuscript. The 286
project was supported by a FBA/Natural Environmental Research Council (NERC) 287
postdoctoral fellowship to MEL and NERC grants NER/B/S/2002/00215 and NE/J02256X/1. 288
289
Author Contributions 290
MEL was responsible for funding application, research design and planning, data collection 291
and analysis, LEB prepared and analysed food webs, FKE collected and analysed data, AMM 292
applied for funds and planned the experiment, GW applied for funds and planned food web 293
research. All authors discussed the results and wrote the manuscript. 294
295
Figure legends. 297
Figure 1. Drought impacts on taxon richness and biomass varied among trophic groups. 298
Mean (± 1 SE) taxon richness (a) and biomass (b) of basal resources, primary consumers and 299
predators in drought and control food webs. Trophic group, drought treatment and their 300
interaction significantly affect taxon richness and biomass (ANOVA, n=24,P< 0.0001 in all 301
cases). Asterisks above individual trophic groups denote significant differences between 302
treatments (ANOVA, n=8,P<0.05). 303
Figure 2. Drought reconfigured stream food webs. Quantitative food webs in one block of 304
control (a) and drought disturbed (b) mesocosms (all webs shown in Supplementary Fig. 1). 305
For each web, lower bars are basal resources, middle bars are primary consumers and top 306
bars are predators. For each consumer, the height and width of the bars is proportional to 307
mean annual secondary production and biomass flux from resources (total inflows to 308
consumers), respectively. For basal species, the relative width of bars on the x-axis is 309
proportional to total consumption by invertebrates (total outflows from each resource to 310
consumers), and for this trophic level production (y-axis) was not quantified. The black 311
triangles that link trophic levels illustrate the relative contribution of resource flows to the 312
production of each consumer, summing to the total inflows. Numbers refer to consumer 313
identity and letters distinguish categories of basal resource, omitting rare species (<1% total 314
production). Flows from individual green algae and diatom taxa are grouped for display only. 315
See Supplementary Tables 1 and 2 for full lists of taxa. 316
Figure 3. Drought reduced and reconfigured biomass flux from resources to consumers. 317
(a) magnitude of biomass fluxes in one block of disturbed and control assemblages (all webs 318
shown in Supplementary Fig. 2). For each treatment, fluxes were ranked from left to right in 319
order of decreasing magnitude. (b) shifts in biomass flux were related to body mass, as 320
revealed by the relationship between mean body mass and mean change in biomass flux to 321
consumers for strongest pathways (> 1 g m-2yr-1). Symbols above and below the dashed line 322
in (b) denote taxa with increasing or decreasing fluxes in response to drought, respectively. 323
324
Table 1. Quantitative weighted network properties were conserved under drought. 325
The effect of the treatment was non-significant (ANOVA,P>0.05). 326
Figure 1. Drought impacts on taxon richness and biomass varies among trophic groups. 328
Mean (± 1 SE) taxon richness (a) and biomass (b) of basal resources, primary consumers and 329
predators in drought and control food webs. Trophic group, drought treatment and their 330
interaction significantly affect taxon richness and biomass (ANOVA, n=24,P< 0.0001 in all 331
cases). Asterisks above individual trophic groups denote significant differences between 332
treatments (ANOVA, n=8,P<0.05). 333
334
335
336
1 10 100
N
um
be
ro
ft
ax
a
+1
Control
Drought
1 10 100 1000 10000 100000
Basal Primary consumer Predator
Bi
om
as
s(
m
g
m
-2 )
Control Drought
*
*
*
*
a
Figure 2. Drought reconfigures stream food webs. Quantitative food webs in one block of 338
control (a) and drought disturbed (b) mesocosms (all webs shown in Supplementary Fig. 1). 339
For each web, lower bars are basal resources, middle bars are primary consumers and top 340
bars are predators. For each consumer, the height and width of the bars is proportional to 341
mean annual secondary production and biomass flux from resources (total inflows to 342
consumers), respectively. For basal species, the relative width of bars on the x-axis is 343
proportional to total consumption by invertebrates (total outflows from each resource to 344
consumers), and for this trophic level production (y-axis) was not quantified. The black 345
triangles that link trophic levels illustrate the relative contribution of resource flows to the 346
production of each consumer, summing to the total inflows. Numbers refer to consumer 347
identity and letters distinguish categories of basal resource, omitting rare species (<1% total 348
production). Flows from individual green algae and diatom taxa are grouped for display only. 349
See Supplementary Tables 1 and 2 for full lists of taxa. 350
351
352
353
a
Figure 3. Drought reduces and reconfigures biomass flux from resources to consumers. 354
(a) magnitude of biomass fluxes in one block of disturbed and control assemblages (all webs 355
shown in Supplementary Fig. 2). For each treatment, fluxes were ranked from left to right in 356
order of decreasing magnitude. (b) shifts in biomass flux were related to body mass, as 357
revealed by the relationship between mean body mass and mean change in biomass flux to 358
consumers for strongest pathways (> 1 mg m-2yr-1). Symbols above and below the dashed line 359
in (b) denote taxa with increasing or decreasing fluxes in response to drought, respectively. 360 361 362 -5 -4 -3 -2 -1 0 1 2
0 100 200 300 400
Lo g10 flu x (m g m -2 yr -1 ) Flux Rank Control Drought -100 0 100 200 300
-5 0 5
% ch an ge in bi om as sf lu x (t re at m en t-co nt ro l/ co nt ro l)
Ln Body Mass
a
Table 1. Quantitative weighted network properties are conserved under drought. The 364
effect of the treatment was non-significant (ANOVA,P>0.05). 365
Control Drought ANOVA
Metric Mean SE Mean SE F1,3 P
Linkage density (LDq) 5.94 1.16 4.20 0.64 3.33 0.165 Connectance (LDq/S) 0.09 0.02 0.08 0.01 0.39 0.575
Generality (Gq) 1.82 0.11 1.59 0.08 3.89 0.143
Vulnerability (Vq) 10.06 2.23 6.81 1.21 3.29 0.167 Interaction diversity (IDq) 3.98 0.35 3.41 0.32 3.36 0.173 Interaction evenness (IE) 0.47 0.03 0.43 0.03 1.90 0.262 366
367
368
SUPPLEMENTARY MATERIALS 370
Supplementary Method 1 371
Stream mesocosms. Each mesocosm was a linear channel (width 0.33 m, length 12 m, depth 372
0.30 m) receiving water and suspended particles (including algae, detritus, and invertebrates) 373
through a 110 mm diameter feeder pipe (6 m length). Water flow was controlled by a valve at 374
the closed upper end of each channel. Water drained freely from mesocosms under gravity, 375
via an open outlet positioned 10 cm above a downstream channel to prevent any potential 376
cross-contamination among the mesocosms. Channels were filled with a 20 cm layer of stony 377
substrate of the same substratum particle size distribution (85 % of particle volume 11-25 378
mm) and geological parent material (chert) to that of the source stream19,21, providing both 379
benthic and interstitial substrata in which suitably-adapted species may find refuge during 380
drought31-32. Although there is currently no consensus as to the importance of the hyporheic 381
zone as a refugium for biota during drought33,34, the depth of mesocosm sediments was 382
consistent with that of oxygenated hyporheic sediments (<20 cm) in neighbouring streams35 383
and within the range of published estimates of the depth of hyporheic zones34-38. 384
Physicochemistry was highly congruent among mesocosms and closely paralleled those of 385
the source stream31. Biota (algae and macroinvertebrates) in the mesocosms were 386
taxonomically diverse and similar in composition to nearby streams32. 387
388
Supplementary Method 2 389
Macroinvertebrates: sample processing and secondary production estimation. Animals 390
in samples were sorted from debris, identified to the lowest practicable taxonomic unit 391
(usually species or genus) and counted. For secondary production estimation, 392
dry weight) was calculated for all macroinvertebrate specimens using published length-mass 395
regressions39. Secondary production of all macroinvertebrates was calculated from biomass 396
using the size-frequency method28 (excepting rare taxa < 1 % total abundance where 397
production was estimated by multiplying mean annual biomass by an annual P/B value of the 398
most closely related taxon19). Production for the first year and the second year of the 399
experiment was averaged and incorporated in to biomass flux estimates as mean annual 400
secondary production (mg m-2yr-1). 401
402
Supplementary Methods 3 403
Food web construction. Binary food webs were constructed based on the presence/absence 404
of resources in the diet of consumers sampled at the end of the experiment. These webs were 405
then quantified, with links expressed as flows of biomass from resources to consumers for 406
each mesocosm community. The trophic basis of production method19 was used to quantify 407
directly observed feeding links, with biomass flux (Fij, mg m-2 yr-1) from resource i to 408
consumerjestimated as follows: 409
Determine the proportion of production derived from food typei(Bi): 410
Bi= (Gi× AEi) /ƩGi=1,...,n• 411
Calculate the flow of biomass via food typeito consumerj(Fij). 412
Fij= (Bi× Pj) / (AEi× NPE) 413
whereGiis the percentage cover of food typei, AEiis the assimilation efficiency of food type 414
i, Pj is the secondary production19 of consumer j, and NPE is assumed net production 415
efficiency. 416
Feeding linkages were determined directly by gut contents analysis (x 1000) of 417
macroinvertebrates. The food webs were dominated by herbivore-detritivores that feed on 418
feeding throughout the year40. In total 4,305 dissected guts were examined, with consumed 420
items identified to the lowest practicable taxonomic unit. The guts of invertebrates were 421
dissected at x20 magnification, and the gut contents were mounted on glass slides with an 422
aqueous agent (Aquamount®). Five fields of view were examined on each slide at x 200 423
magnification using an ocular grid (1 cm2 divided into 100 cells of 1 mm2). Gut contents 424
were identified as algae, fungi, invertebrates, large plant detritus and amorphous detritus. 425
Amorphous detritus is organic matter derived from biofilms on the stream bed. It consists of 426
polysaccharide matrix, microorganisms and their by-products18. Invertebrate, diatom and 427
other algal components of diet were identified to genus or species whenever possible. The 428
relative amount of each food type in a field of view was derived by counting the squares on 429
the ocular grid dominated by that food type. The percentage of each food type for an 430
individual was then calculated from the five fields of view and expressed as a percentage of 431
the total particle area. Yield effort curves (number of food types versus number of guts 432
examined) were drawn for each taxon to determine when a sufficient number of individuals 433
had been examined to describe its diet accurately27. 434
435
Supplementary Method 4 436
Quantitative food web metrics.Food webs with links quantified as flux of biomass (mg m-2 437
yr-1) from resources to consumers were compared using metrics derived from information 438
theory5,20. For each food web, we determined the quantified, weighted measures of linkage 439
density (LDq), interaction diversity (IDq), interaction evenness (IEq), generality (Gq, mean 440
number of resources per comsumer) and vulnerability (Vq, mean number of consumers per 441
resource). The metrics incorporate the inflow and outflow of biomass to each species in the 442
food web, and the diversity of biomass flows derived from the resource (HN, the diversity of 443
b b b b H k ik i k ik k N,
log2
s
1 445
446
447
In each food web matrix, column sum b•k and row sum bk• are the sum total biomass flux 448
from resources, and to consumers, of taxon k, respectively. The reciprocals ofHN•kand HP•k 449 are: 450 0 if 0 2
b
n k H k N, k N, 451 0 if 0 2
b
n k H k P, k P, 452
Weighted quantitative linkage density (LDq) was calculated as the average of the equivalent 453
numbers of resources (nN,k) and consumers (nP,k), weighted by their inflows and outflows: 454
s 1 s 1 2 1 k k k N, k k P, k q n b b n b b LD 455whereb••is the total biomass flux in the web matrix20. Quantified connectance was calculated 456
asLDq/S. Weighted generality (Gq) and vulnerability (Vq) were calculated as: 457
n b b
G N,k
k k q
s 1 458 n b bV P,k
k k q
s 1 459The diversity and evenness of quantified links in each food web was calculated using the 460
Shannon index of entropy: 461
p pIDq
ilog2 i462
N p p
IEq i i
log log 2 2
463 b b b b H k kj s j k kj k P
log2
Wherepiis the proportional contribution of interactionito the total number of interactions in 464
the web (N). 465
Supplementary Figure 1. Quantitative food webs in replicate control (C1-C4) and drought (D1-D4)
467
treatments (webs C1 and D1 shown in Fig. 1). For each web, lower bars are basal resources, middle bars
468
are primary consumers and top bars are predators. For each consumer, the height and width of the bars
469
is proportional to mean annual secondary production and biomass flux from resources (total inflows),
470
respectively. For basal species, the relative width of bars on the x-axis is proportional to total
471
consumption by invertebrates (total outflows from each resource to consumers), and for this trophic
472
level production (y-axis) was not quantified. The black triangles that link trophic levels illustrate the
473
relative contribution of resource flows to the production of each consumer, summing to the total
474
inflows. Numbers refer to consumer identity and letters distinguish categories of basal resource,
475
omitting rare species (<1% total production). Flows from individual algal taxa are grouped for display
476
only. See Supplementary Tables 1 and 2 for full lists of resource and consumer taxa, respectively.
Supplementary Figure 2. Magnitude of biomass fluxes from resources to consumers for all 481
control and drought-disturbed webs. For each treatment, fluxes were ranked from left to right 482
in order of decreasing magnitude. 483
484
-5 -4 -3 -2 -1 0 1 2
0 100 200 300 400 500
Lo
g10
flu
x
(m
g
-2yr -1)
Flux Rank
Supplementary Table 1. List of benthic algae in mesocosm food webs. 485
Group Taxon
Bacillariophyceae Amphora inariensisKrammer
Amphora libycaEhrenberg
Amphora ovalis(Kützing) Kützing
Amphora pediculus(Kützing) Grunow in Schmidt
Cocconeis placentulaEhrenberg
Cymatopleura solea(Brébisson & Godey) W. Smith
Diatoma vulgareBory
Encyonema minutum(Hilse in Rabenhorst) Mann
Fragilaria vaucheriae(Kützing) Petersen
Gomphonema olivaceum(Hornemann) Brébisson
Gyrosigmasp.
Melosira variansAgardh
Navicula capitataEhrenberg
Navicula gregariaDonkin
Navicula lanceolata(Agardh) Ehrenberg
Navicula menisculusSchumann
Navicula tripunctata(O.F. Müller) Bory
Nitzschia dissipata(Kützing) Grunow
Nitzschia perminuta(Grunow) M. Peragallo
Nitzschiasp. 1
Placoneis clementis(Grunow) E.J. Cox
Planothidium lanceolatum(Bréb. ex Kützing) Round & Bukhtiyarova
Psammothidium lauenburgianum(Hustedt) Bukhtiyarova & Round
Rhoicosphenia abbreviata(Agardh) Lange-Bertalot
Staurosira elliptica(Schumann) Williams & Round
Staurosirella leptostauron(Ehrenberg) Williams & Round
Surirella brebissoniiKrammer & Lange-Bertalot
Surirella minutaBrébisson in Kützing
Synedra ulna(Nitzsch) Ehrenberg Chlorophyceae Gongrosira incrustansReinsch Cyanophyceae Phormidiumsp. 1
Phormidiumsp. 2
486
487
488
489
490
Supplementary Table 2. List of macroinvertebrate taxa found in mesocosm food webs. 492
Predatory taxa are highlighted in bold. 493
494
495
496
497
498
499
500
501
502
503
504
505
506
507
508
Group Taxon
Oligochaeta Naididae Tubificidae
Gastropoda Ancylus fluviatilis(Müller)
Potamopyrgus antipodarum(J.E. Gray)
Radix balthica(L.)
Theodoxus fluviatilis(L.)
Valvata piscinalis(Müller) Bivalvia Pisidiumsp.
Hirudinea Erpobdella octoculata (L.)
Isopoda Asellus aquaticus(L.) Amphipoda Gammarus pulex(L.) Ephemeroptera Baetidae
Ephemera danicaMüller Plecoptera Leuctra geniculataStephens Coleoptera Brychius elevatus(Panzer)
Elmis aenea(Müller)
Haliplus lineatocollis(Marsham)
Limnius volckmari(Panzer)
Oulimnius tuberculatus(Müller)
Platambus maculatus(L.) Megaloptera Sialis lutaria(L.)
Trichoptera Athripsodesspp.
Brachycentrus subnubilusCurtis
Hydropsyche spp.
Limnephilus lunatusCurtis
Polycentropus flavomaculatus(Pictet)
Sericostoma personatum(Spence)
Tinodes waeneri(L.) Diptera Cricotopussp.
Cryptochironomussp.
Heterotrissocladiussp.
Macropelopiasp.
Microtendipessp.
Pentaneurasp.
Polypedilumsp.
Procladiussp.
Prodiamesa olivacea (Meigen)
Synorthocladiussp. Simuliidae
Supplementary Table 3. Qualitative (binary) food web metrics for drought and control stream food 509
webs. Metrics were linkage density (L/S) whereL is number of consumer-resource links and Sis 510
the number of species in the web, directed connectance (L/S2), generality (L/Sconsumers), 511
vulnerability (L/Sresources). ANOVA tested for the effect of drought (below) and block (P>0.05, not 512
shown). 513
Control Drought ANOVA
Metric Mean SE Mean SE F1,3 P
Linkage density 5.96 0.53 4.94 0.38 2.20 0.212
Directed connectance 0.09 0.01 0.10 0.01 0.17 0.706
Generality 11.68 1.11 12.84 0.55 1.42 0.390
Vulnerability 6.63 0.63 5.26 0.40 3.37 0.164
514
Supplementary references 516
31. Harris, R. M. L., Milner, A. M., Armitage, P. D. & Ledger, M. E. Replicability of 517
physicochemistry and macroinvertebrate assemblages in stream mesocosms: implications for 518
experimental research.Freshwat. Biol.52, 2434-2443 (2007). 519
32. Ledger, M. E., Harris, R. M. L., Armitage, P. D. & Milner, A. M. Realism of model 520
ecosystems: an evaluation of physicochemistry and macroinvertebrate assemblages in 521
artificial streams.Hydrobiologia 617, 91-99 (2009). 522
33. Wood, P J., Bolton, A. J., Little, S. & Stubbington, R. Is the hyporheic zone a refugium 523
for aquatic macroinvertebrates during severe low flow conditions?Fundam. App. Limnol.
524
176, 377-390 (2012). 525
34. Dole-Olivier, M.-J. The hyporheic refuge hypothesis reconsidered: a review of 526
hydrological aspects.Mar. Freshwat. Res.62, 1281-1302 (2011). 527
35. Trimmer, M., Maanoja, S., Hildrew, A. G., Pretty, J. L. & Grey, J. Potential carbon 528
fixation by methane oxidation in well-oxygenated riverbed gravels.Limnol. Oceanogr.55, 529
560-568 (2010). 530
36. Hill A. R. & Lymburner D. J. Hyporheic zone chemistry an stream-subsurface exchange 531
in two groundwater-fed streams.Can. J. Fish. Aqu. Sci.55, 495-506 (1998). 532
37. Lansdown, K., Trimmer, M., Heppell, C. M., Sgouridis, F., Ullah, S., Heathwaite, A. L., 533
Binley A. & Zhang, H. Characteristic of the key pathways of dissimilatory nitrate reduction 534
and their response to complex organic substrates in hyporheic sediments.Limnol. Oceanogr. 535
38. Mullholland, P. J., Marzolf, E. R., Webster, J. R., Hart, D. R. & Hendricks, S. P. Evidence 537
that hyporheic zones increase heterotrophic metabolism and phosphorus uptake in forest 538
streams.Limnol. Oceanogr.42, 443-451 (1997). 539
39. Edwards, F. K., Lauridsen, R. B., Armand, L., Vincent, H. M. & Jones, J. I. The 540
relationship between length, mass and preservation time for three species of freshwater 541
leeches (Hirudinea).Fundam. Appl. Limnol.173, 321-327 (2009). 542
40. Harris, R. M. L. Ph.D. Thesis, University of Birmingham (2006). 543
544