This is a repository copy of
Analyzing the Mobile WiMAX System Resource Exploitation of
the Downlink Direction
.
White Rose Research Online URL for this paper:
http://eprints.whiterose.ac.uk/116438/
Version: Accepted Version
Article:
Lagkas, T. orcid.org/0000-0002-0749-9794, Sarigiannidis, P.G. and Louta, M.D. (2014)
Analyzing the Mobile WiMAX System Resource Exploitation of the Downlink Direction.
Wireless Personal Communications, 77. 2. pp. 1117-1127. ISSN 0929-6212
https://doi.org/10.1007/s11277-013-1557-2
Reuse
Unless indicated otherwise, fulltext items are protected by copyright with all rights reserved. The copyright exception in section 29 of the Copyright, Designs and Patents Act 1988 allows the making of a single copy solely for the purpose of non-commercial research or private study within the limits of fair dealing. The publisher or other rights-holder may allow further reproduction and re-use of this version - refer to the White Rose Research Online record for this item. Where records identify the publisher as the copyright holder, users can verify any specific terms of use on the publisher’s website.
Takedown
If you consider content in White Rose Research Online to be in breach of UK law, please notify us by
Analyzing the Mobile WiMAX System Resource
Exploitation of the Downlink Direction
Thomas D. Lagkas
*, Panagiotis Sarigiannidis
+, and Malamati Louta
+*
Computer Science Department, International Faculty of the University of
Sheffield, CITY College, Thessaloniki, Greece
+
Department of Informatics and Telecommunications Engineering, University of
Western Macedonia, Kozani, Greece
E-mail: [email protected], {psarigiannidis, louta}@uowm.gr
Abstract Worldwide Interoperability for Microwave Access (WiMAX) constitutes a viable networking technology, providing wireless connectivity in an efficient manner. In this work, on the grounds of the defined frame structure, a novel performance analysis of the mobile WiMAX standard in terms of the downlink resource utilization is presented. The analysis is validated via simulation, the results of which are also provided along with numerical results, studying the effectiveness of the OFDMA-based downlink mapping. The results reveal the relationship among the frame dimensions, the mapped request size, and the number of unexploited OFDMA slots.
Keywords
IEEE 802.16e, mapping, OFDMA, performance analysis, resource
utilization, simulation, WiMAX
1. Introduction
Interoperability for Microwave Access (WiMAX) constitutes one of the most promising candidate
networking technology for the realization of the 4G vision, supporting high-speed, sustainable, and
long-distance wireless connections [1]. Either built in a mesh architecture or as an access network,
WiMAX is based on the Orthogonal Frequency Division Multiple Access (OFDMA), which is
responsible for arranging bandwidth requests from the Medium Access Control (MAC) to PHYsical
(PHY) layer and vice versa in both time and frequency dimensions. Considering a WiMAX-based
access network, the downlink scheduler, located in the Base Station (BS), receives the requests
originating from all Mobile Stations (MSs) and forwards MAC requests to the mapper. The mapper
decides on the final bandwidth distribution, taking into account the available resources in terms of
slots, which define the minimum allocation unit in OFDMA systems.
One can find various analytical efforts of OFDMA systems in the literature. For example,
process to obtain the queue occupancy distribution. The work in [3] provides findings of the
signaling impact on the spectral efficiency in dynamic OFDMA systems. The authors infer that the
throughput of dynamic OFDMA systems is significantly influenced by the signaling overhead. In [4] a subcarrier and power allocation method that minimizes the total transmitted power is proposed.
The allocation strategy requires only the knowledge of the channel statistics and the rate
requirements for all users. Furthermore, the authors provide an extension and a performance analysis
of the suggested scheme in a multi-user environment. The work presented in [5] focuses on VoIP
traffic in OFDMA systems. Both simulation and analytical models were employed to study the
performance of scheduling algorithms for real-time data in the IEEE 802.16e uplink direction.
Another approach in [6] involves a Markov chain to derive bounds for delay and queue backlog for
various scheduling strategies. The results obtained indicate upper bounds on the buffer overflow
probability, giving insights for practical buffer dimensioning problems in OFDMA systems. Authors
in [7] use simulation to validate their proposed algorithm for QoS supportive resource allocation in
OFDMA systems. They demonstrated the efficiency, feasibility, and fairness of their scheme, which
is based on the awareness of the packet buffer state. QoS provision is also the main feature of the
OFDMA rate allocation algorithm proposed in [8] with the name MARA (Maximum Achievement
Rate Allocation). In the specific work, simulations were performed to exhibit the throughput
improvement achieved by the algorithm in the downlink sub-frame.
However, to the best of our knowledge, there is no prior work focusing on deriving the
intra-frame utilization of the OFDMA systems. Bearing in mind that the downlink mapping
operation dramatically influences the efficiency of the OFDMA-based systems [9], in this study, we
endeavor to cover this gap by providing a rigorous analytical approach studying the performance of
the IEEE 802.16e systems with respect to downlink sub-frame dimensions and the number of
connected subscribers. Simple Packing Algorithm (SPA) [10], a very common downlink mapping
algorithm is adopted as the main allocation policy that simply creates allocation rectangles to provide
full support of the various downlink requests. The remainder of this paper is organized as follows.
Section 2 introduces SPA along with its variations and presents the analytical solution modeling its
2. Analysis of the SPA Unexploited Resources
2.1. Slot Utilization in SPA
SPA is a well-known and simple to implement mapping scheme, arranging MS requests in the grid
of OFDMA slots provided by the WiMAX frame. There are two variants of the specific algorithm;
the vertical and the horizontal. The difference between these two variants lies in the way consecutive
slots are allocated to a MS. In the vertical case, a request occupies slots in a column-by-column
manner, where each column corresponds to an OFDMA timeslot. On the other hand, horizontal SPA
assigns OFDMA slots in a row-by-row basis; starting with the slots of the first sub-channel, the
algorithm then proceeds with the allocation of the second sub-channel’s slots and so on. Both SPA variants have to align with a basic condition derived by the 802.16 physical layer specifications for
the downlink; each MS request must form a rectangular area of OFDMA slots called data region.
On this ground, vertical SPA always allocates a MS request either to a part of a single column or to
multiple whole columns and horizontal SPA always allocates a MS request either to a part of a single
row or to multiple whole rows. Each request forwarded by the scheduler is examined to decide
whether it is small enough to fit into a single column/row (vertical/horizontal SPA) or it has to be
mapped to multiple columns/rows. It is noted that one column/row is allowed to include multiple
MS requests as long as the rectangular shape constraint is satisfied. This process carries on until all
requests are examined or the available slots are exhausted and there is no adequate frame space to
handle the remaining requests.
In general, the procedure of mapping MS requests to OFDMA slots involves idle slots. This
may be attributed to the rectangular restriction of the data region. Specifically, a request that is
allocated slots in new columns/rows (vertical/horizontal case) may leave idle slots in the previously
assigned column/row or in its last assigned column/row. Moreover, idle slots may appear towards
the end of the downlink sub-frame, either due to the lack of requests or the lack of adequate frame
space. A graphic representation example of the above described slot distribution technique is
illustrated in Fig. 1, where four MS requests are mapped according to vertical SPA. The unexploited
slots are depicted in this resource grid as idle slots and the formed data regions are highlighted with
double line borders. In the downlink sub-frame, idle slots are inactive blocks that correspond to no
data reception. Hence, they lead to lower bandwidth utilization and consequently to performance
analyze both schemes together, since the number of occupied slots is identical in both cases,
depending exclusively on the requests and the respective resource space dimensions.
2.2 Analytical Solution
In this subsection, the unexploited part of the downlink sub-frame resource space when SPA is
employed is mathematically estimated. The available OFDMA slots are allocated to MS requests on
a per frame basis. That is for each frame the requests provided by the scheduler are examined and
mapped to data regions according to the SPA technique. It is noted that the specific analysis refers
to the vertical SPA case; however, it is straightly applicable to the horizontal case, because of the
symmetric operation of the two variants regarding the number of idle slots. Actually, interchanging
in the following formulae sub-frame height with width causes the transition from the vertical case
to the horizontal one and vice versa.
When estimating system’s behavior in such type of analytical approaches, it is a common practice to assume Poisson arrivals. Thus, it is hereafter considered that the scheduler feeds the
mapping entity with MS requests of a random number of OFDMA slots that follows Poisson
distribution with parameter . In fact, the specific random variable could never be nullified nor be
higher than the total number of available slots in the whole downlink sub-frame, since a MS could
never request zero slots or more than the resource space. Hence, the request’s size actually follows a restricted Poisson distribution, so parameter is not exactly equal to its expected value.
The first step in this analysis is to estimate the number of idle slots, when a MS is assigned
downlink slots in a new column (since we examine the vertical SPA variant). In more specific, a MS
request that occupies s slots starting in a new column leaves idle slots, when it does not fill an integer
number of columns. Considering that each column is of height H OFDMA slots, a request leaves no
idle slots only in the case that its size is an integer multiple of H. In the general case, d idle slots are
left when s is a multiple of H, minus d. For instance, a request of 2H – 1 slots occupies one full column and H – 1 slots in the second column, where it leaves the last slot idle. Based on this fact and taking into account that the maximum feasible number of columns occupied by a request is W,
which is defined as the sub-frame width, the probability a MS that is assigned slots in a new column
1 10,
1,
!
[ ]
,
,
,
.
!
iH d W i i W H ie
d
H
iH
d
q d
d W H
e
i
(1)
Note that in Equation (1), the numerator is directly derived by the assumption that the request size
follows the Poisson distribution [11], as it is already explained. However, the resulted value is
normalized, so that the sum of the probabilities of all possible outcomes is one, on the ground that
the request size is actually bounded in the range of 1 to WH, since a practical system does not allow
mapping in a downlink sub-frame of zero slots nor requests exceeding the maximum capacity of the
sub-frame. Thus, the aggregated Poisson probability in Equation (1) is divided by the probability
the number of mapped slots lies in the abovementioned limits, which quantity is actually the
normalizing constant [12]. It is noted that the specific normalization practice, which ensures real
system conditions, is followed throughout the presented analysis. Next, the estimated number of idle
slots a MS, which is assigned slots in a new column, leaves is denoted by D and calculated as
follows: 1 1
[ ]
,
.
H dD
q d
d
W
(2)
The subsequent step is to estimate the number of MSs per frame that are served in new downlink
columns. For that reason, we calculate the mean number of columns a MS that is assigned slots in a
new column occupies. The probability that it occupies k columns derives by:
( 1) 1
1
0,
,
!
[ ]
,
,
,
.
!
i k Hi k H i W H i
e
k
W
i
p k
k W H
e
i
(3)
Consequently, the mean number of columns a MS that is assigned slots in a new column occupies
is equal to:
1
[ ]
,
.
W
k
M
p k
k
W
(4)
As a result, the number of MSs per frame that are served with new downlink columns is estimated
to be:
,
,
.
W
R
M
W
W
M
We proceed with the estimation of the number of MSs that are served with columns already
occupied by another MS. The probability that l requests are mapped to a single column of height H
is given by:
1 0
[ ]
[
]
[
],
,
,
.
H l l iQ l
P H
i
P
i
l
H
l H
(6)
where Py[x] is the probability that the total number of slots requested by y MSs is equal to x and
Py[>x] gives the probability that the aggregate number of requested slots is higher than x. Regarding
the computation of Py[x], it would not be precise to employ the additive property of the Poisson
distribution, according to which the sum of Poisson variables is also Poisson distributed, because in
this analysis the sum of the random variables does not follow the exact Poisson distribution, as
already explained. For this reason, we provide here the detailed analysis outcome:
( 1) 1 1 1
[ ]
[
]
[ ],
,
,
.
x y y y iP x
P
x
i
P i
x
y
x y
(7)
Please note that Py[x]=0, when x < y, since there are no empty downlink requests. Furthermore,
Py[x]=0, when x > y×W×H, as there can be no request exceeding the downlink sub-frame size. The
respective probability for a single MS request is:
1
1
!
[ ]
,
0,
.
!
x i W H ie
x
P x
x
e
i
(8)
Referring to (6), we can easily calculate Py[>x] using the following formula:
1
[
]
[ ]
1
[ ],
,
,
.
x
y y y
i x i y
P
x
P i
P i
x
y
x y
(9)
Based on (6), the estimated number of requests mapped to a single column already occupied by
another MS is:
2
[ ] (
1),
.
H
l
A
Q l
l
H
(10)
Our goal to estimate the mean number of MSs served with columns already occupied by another MS
Next, the analysis proceeds with the calculation of the mean number of slots allocated to MS requests
mapped to columns already occupied by another MS. The probability that m slots are allocated to
an already occupied column is given by:
1 1
1 1
[ ]
[ ]
[
]
[ ] ,
,
,
.
H m m
j
i j
u m
P i
P
H
m i
P m
m
H
l H
(12)
The mean number of slots allocated to an already occupied column is then equal to:
1
1
[ ]
,
.
H
m
B
u m
m
H
(13)
The mean number of idle slots per downlink sub-frame (I) finally results by computing the number
of idle slots related with the MSs that are served with new columns and then subtracting the slots
allocated in the already occupied columns. Specifically, it holds:
.
B
I
R D
E
A
(14)
Equation (14) provides an estimation of the number of unexploited OFDMA slots per downlink
sub-frame, given that the number of requests scheduled for mapping is unlimited. Thus, we come up
with a theoretical value corresponding to the saturation case. In what follows, the mean number of
idle downlink slots per frame is estimated for a limited number of MS requests. Considering that
there are N MSs requesting for resources, the following formula provides the mean number of idle
OFDMA slots per downlink sub-frame:
,
, , , . ,
N
I N R E
I NRD NRM NEB N W H
W H N R E
R E R E R E A
(15)
3 Numerical Results and Discussion
A simulation program1 was developed in MATLAB to validate the mathematical approach presented
above. The simulator implements a model of the vertical SPA technique, mapping requests that are
generated according to the described restricted Poisson distribution to the two-dimension slot space.
The frame characteristics considered by this work are as follows. The Time Division
Duplexing (TDD) technique is adopted. The frequency diversity mode is PUCH (Partially Used
sub-Channelization), according to which H equals to 30 sub-channels. The downlink sub-frame width is
determined by the downlink-to-uplink sub-frame ratio and the frame duration. Specifically, taking
into account the control information fields, for the default 5ms frame, W is equal to 9, 12, and 15
timeslots corresponding to downlink-to-uplink sub-frame ratios of 1:1, 2:1, and 3:1, respectively,
whereas for 10ms frame, W is equal to 21, 27, and 33 timeslots corresponding to downlink-to-uplink
sub-frame ratios of 1:1, 2:1, and 3:1, respectively.
In the presented graphs, it is obvious that the analytical and the simulation results coincide
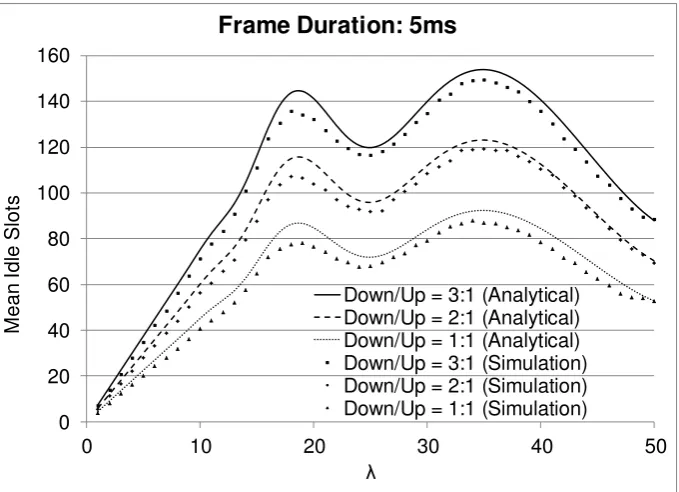
to a satisfactory degree. Fig. 2 and Fig. 3 assume unlimited requests and depict the mean number of
idle slots with respect to the Poisson parameter , for different downlink-to-uplink sub-frame ratios
and considering frame duration 5ms and 10ms, respectively. Generally, it is evident that the larger
the downlink sub-frame is the more idle slots are left. Initially, the number of idle slots increases as
increases, since more “blank” spaces take place. This is due to the increasing request size that disallows mapping multiple requests in single columns. When the mean request size reaches the
frame height, an upwards concavity is noticed, since a request tends to “fit” in a whole column. This local minimum value, that is approximately equal to 26% of the total number of slots, occurs for
close to 25, which corresponds to a mean request size approximately equal to 30 on the basis of the
considered restricted Poisson distribution. Then and up to the maximum considered value of 50,
there is a decreasing trend justified by the large regions occupied by the requests leaving limited idle
slots, since they expand to multiple columns and cause less "blank" spaces. The two highest numbers
of idle slots, corresponding approximately to 34% and 31% of the total slots, are observed for =35
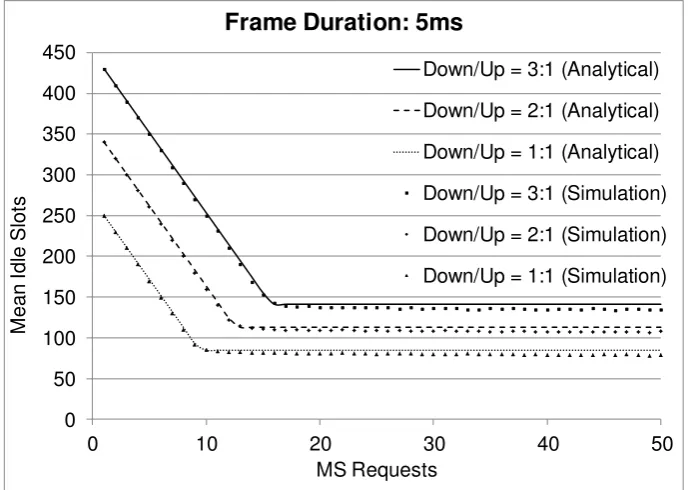
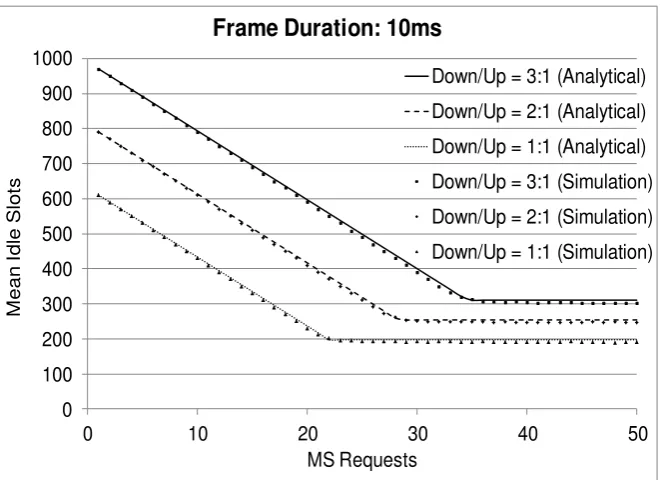
and =19, respectively. In Fig. 4 and Fig. 5, the estimated number of idle slots is plotted versus the
number of MS requests considering =20, for different downlink-to-uplink sub-frame ratios for
frame duration 5ms and 10ms, respectively. Apparently, an increased number of requests leads to
reduced idle slots, until a saturation point is reached, the exact value of which depends on the frame
duration and the downlink-to-uplink sub-frame ratio. This value converges close to 30% of the total
number of slots in the resource grid.
technique is the commonly employed SPA scheme and the analysis outcome concerns both vertical
and horizontal variants, because of their symmetrical operation. The numerical results, which were
validated via MATLAB simulation, have shown that the number of idle OFDMA slots depends on
the available resource space size as well as the length of the MS requests. The minimum slot
utilization amounts approximately to 66% and is observed for request size about 20% higher than
the time/frequency grid height, in case of vertical SPA, or width, in case of horizontal SPA.
References
1. Andrews, J., Ghosh, A., Muhamed, R. (2007). Fundamentals of WiMAX, Understanding Broadband Wireless Networking. Prentice Hall.
2. Niyato, D., Hossain, E. (2005). Queueing analysis of OFDM/TDMA systems. IEEE Global Telecommunications Conference (GLOBECOM '05), 6, 3712-3716.
3. Gross, J., Geerdes, H.-F., Karl, H., Wolisz, A. (2006). Performance analysis of dynamic OFDMA systems with inband signalling. IEEE Journal on Selected Areas in Communications, 24(3), 427- 436.
4. Gault, S., Hachem, W., Ciblat, P. (2007). Performance Analysis of an OFDMA Transmission System in a Multicell Environment. IEEE Transactions on Communications, 55(4), 740-751. 5. So, J.-W. (2008). Performance Analysis of Uplink Scheduling Algorithms for VoIP Services in the IEEE 802.16e OFDMA System. Springer Wireless Personal Communications, 47(2), 247-263. 6. Wunder, G., Chan, Z. (2009). Queueing analysis for the OFDMA downlink: Throughput regions, delay and exponential backlog bounds. IEEE Transactions on Wireless Communications, 8(2), 871-881.
7. Fraimis, I.G., Kotsopoulos, S.A. (2013). Queue-Aware Resource Allocation for Multi-cell OFDMA Systems with QoS Provisioning. Springer Wireless Personal Communications. DOI: 10.1007/s11277-012-0988-5.
8. Cho, T.-K., Oh, C.-Y., Lee, T.-J. (2012). Maximum Achievement Rate Allocation Algorithm for Downlink Multi-User OFDMA Systems. Springer Wireless Personal Communications. DOI: 10.1007/s11277-012-0757-5.
9. So-In, C., Jain, R., Tamimi, A.-K (2009) Scheduling in IEEE 802.16e mobile WiMAX networks: key issues and a survey. IEEE Journal on Selected Areas in Communications, 27(2), 156-171. 10. Perez-Costa, X., Favaro, P., Zubow, A., Camps, D., Arauz, J. (2008). On the Challenges for the Maximization of Radio Resources Usage in WiMAX Networks. 5th IEEE Consumer Communications and Networking Conference (CCNC 2008), 890-896.
11. Zhang, H., He, J., Huang, H. (2013). On Nonnegative Integer-Valued Lévy Processes and Applications in Probabilistic Number Theory and Inventory Policies. American Journal of Theoretical and Applied Statistics. 2(5), 110-121. DOI: 10.11648/j.ajtas.20130205.11.
Time Axis
F
req
ue
nc
y
A
x
is
RE1 RE1 RE2 RE4 i RE1 RE1 RE2 RE4 i RE1 RE1 RE2 RE4 i RE1 RE1 RE2 RE4 i RE1 RE1 RE3 RE4 i RE1 i RE3 RE4 i RE1 i RE3 i i RE1 i RE3 i I
RE1 i I i I
[image:12.595.246.401.70.209.2]RE1 i I i I
Fig. 1 Example of mapping four MS requests in an OFDMA resource space on the basis of vertical
SPA (RE: request, i: idle slot).
Fig. 2 Mean number of idle slots per DL sub-frame versus the Poisson parameter related to the
requested slots in a 5ms long frame.
0 20 40 60 80 100 120 140 160
0 10 20 30 40 50
M
ean
Idle
Slot
s
Frame Duration: 5ms
[image:12.595.157.497.257.503.2]Fig. 3 Mean number of idle slots per DL sub-frame versus the Poisson parameter related to the
requested slots in 10ms long frame.
Fig. 4 Mean number of idle slots per DL sub-frame versus number of MS requests in 5ms long
frame.
0 50 100 150 200 250 300 350
0 10 20 30 40 50
M
ean
Idle
Slot
s
Frame Duration: 10ms
Down/Up = 3:1 (Analytical) Down/Up = 2:1 (Analytical) Down/Up = 1:1 (Analytical) Down/Up = 3:1 (Simulation) Down/Up = 2:1 (Simulation) Down/Up = 1:1 (Simulation)
0 50 100 150 200 250 300 350 400 450
0 10 20 30 40 50
M
ean
Idle
Slot
s
MS Requests
Frame Duration: 5ms
Down/Up = 3:1 (Analytical)
Down/Up = 2:1 (Analytical)
Down/Up = 1:1 (Analytical)
Down/Up = 3:1 (Simulation)
Down/Up = 2:1 (Simulation)
[image:13.595.154.500.366.611.2]13
Fig. 5 Mean number of idle slots per DL sub-frame versus number of MS requests in 10ms long
frame.
0 100 200 300 400 500 600 700 800 900 1000
0 10 20 30 40 50
M
ean
Idle
Slot
s
MS Requests
Frame Duration: 10ms
Down/Up = 3:1 (Analytical)
Down/Up = 2:1 (Analytical)
Down/Up = 1:1 (Analytical)
Down/Up = 3:1 (Simulation)
Down/Up = 2:1 (Simulation)