This is a repository copy of
Global analysis of photovoltaic energy output enhanced by
phase change material cooling
.
White Rose Research Online URL for this paper:
http://eprints.whiterose.ac.uk/81538/
Version: Accepted Version
Article:
Smith, CJ, Forster, PM and Crook, R (2014) Global analysis of photovoltaic energy output
enhanced by phase change material cooling. Applied Energy, 126. 21 - 28. ISSN
0306-2619
https://doi.org/10.1016/j.apenergy.2014.03.083
eprints@whiterose.ac.uk https://eprints.whiterose.ac.uk/
Reuse
Unless indicated otherwise, fulltext items are protected by copyright with all rights reserved. The copyright exception in section 29 of the Copyright, Designs and Patents Act 1988 allows the making of a single copy solely for the purpose of non-commercial research or private study within the limits of fair dealing. The publisher or other rights-holder may allow further reproduction and re-use of this version - refer to the White Rose Research Online record for this item. Where records identify the publisher as the copyright holder, users can verify any specific terms of use on the publisher’s website.
Takedown
If you consider content in White Rose Research Online to be in breach of UK law, please notify us by
Global analysis of photovoltaic energy output enhanced by phase change material cooling
Christopher J. Smitha,∗, Piers M. Forsterb, Rolf Crooka
aEnergy Research Institute, University of Leeds, Leeds, LS2 9JT, United Kingdom bSchool of Earth and Environment, University of Leeds, Leeds, LS2 9JT, United Kingdom
Abstract
This paper describes a global analysis to determine the increase in annual energy output attained by a PV system with an integrated phase change material (PCM) layer. The PCM acts as a heat sink and limits the peak temperature of the PV cell thereby increasing efficiency. The simulation uses a one-dimensional energy balance model with ambient temperature, irradiance and wind speed extracted from ERA-Interim reanalysis climate data over a 1.5◦ longitude×1.5◦latitude global grid. The effect of varying the PCM melting temperature from 0◦C to 50◦C was investigated to identify the optimal melting temperature at each grid location. PCM-enhanced cooling is most beneficial in regions with high insolation and little intra-annual variability in climate. When using the optimal PCM melting temperature, the annual PV energy output increases by over 6% in Mexico and eastern Africa, and over 5% in many locations such as Central and South America, much of Africa, Arabia, Southern Asia and the Indonesian archipelago. In Europe, the energy output enhancement varies between 2% and nearly 5%. In general, high average ambient temperatures correlate with higher optimal PCM melting temperatures. The sensitivity to PCM melting temperature was further investigated at locations where large solar PV arrays currently exist or are planned to be constructed. Significant improvements in performance are possible even when a sub-optimal PCM melting temperature is used. A brief economic assessment based on typical material costs and energy prices shows that PCM cooling is not currently cost-effective for single-junction PV.
Keywords: Phase change material, photovoltaics, global study, heat transfer, simulation
1. Introduction 1
The addition of phase change material (PCM) to a solar cell 2
has been proposed as a method to increase solar PV energy out-3
put by keeping the temperature of PV cells close to the ambient 4
[1]. The PCM is a layer of high latent heat capactiy which acts 5
as a heat sink, absorbing heat that is transferred from a PV cell. 6
Solar cell efficiency is dependent on cell temperature, with a 7
drop in efficiency of 0.45% (relative) for every 1◦C rise in cell 8
temperature for crystalline silicon [2]. Therefore, any mecha-9
nism which reduces the cell temperature, particularly at times of 10
high irradiance, will increase cell efficiency and PV energy out-11
put. Alongside phase change materials, existing cooling meth-12
ods proposed include water and air cooling. Water cooling may 13
be unsuitable due to the weight of water required to deliver ap-14
propriate cooling [3]; furthermore, in many locations where so-15
lar energy has great potential such as deserts, water is scarce. If 16
either air or water cooling is activated, this introduces a main-17
tanence burden that could increase operating costs and system 18
downtime. 19
The potential for improvement by using a PV/PCM system 20
has been demonstrated in numerical simulations [1, 4], labora-21
tory tests [1, 5, 6] and in outdoor studies [5, 7, 8]. In terms of 22
outdoor testing of PV/PCM systems, it was estimated that ef-23
ficiency from a PV/PCM system would be improved by 7.5% 24
∗Corresponding author
Email address:pmcjs@leeds.ac.uk(Christopher J. Smith)
at peak solar hours due to a 17◦C difference in temperature be-25
tween an aluminium flat plate and an aluminium box contain-26
ing PCM [5]. A PV/PCM panel tested outdoors in Pakistan 27
resulted in a PV cell temperature that was 21.5◦C lower than 28
the reference at the peak time of the day [7]. These figures 29
are maximum temperature differentials as the PCM and non-30
PCM systems change temperature at different rates due to the 31
difference in thermal masses. However over the course of the 32
day it was calculated that PV energy output would be improved 33
by 6.8% compared the reference cell, estimated from the cell 34
manufacturers’ data of a 0.5% K−1decline in efficiency and the
35
temperature difference between the cells at each point during 36
the day. In the cooler climate of Ireland in mid-September, the 37
power output increase was approximately 3.8% with the same 38
PCM. During an experiment in Western India it was demon-39
strated that PCM cooling could be very promising for use in 40
concentrating solar PV cells [8]. 41
This paper evaluates the global potential for PCM-assisted 42
cooling by measuring the absolute and relative increases in 43
electrical output from a silicon solar cell using a numerical sim-44
ulation. The simulation is performed globally using typical cli-45
matological data for each region. For sites of current and future 46
interest for solar PV, the dependence in energy output on PCM 47
melting temperature is analysed. The locations where PCM-48
assisted cooling is likely to lead to significant energy output 49
increases are therefore identified. 50
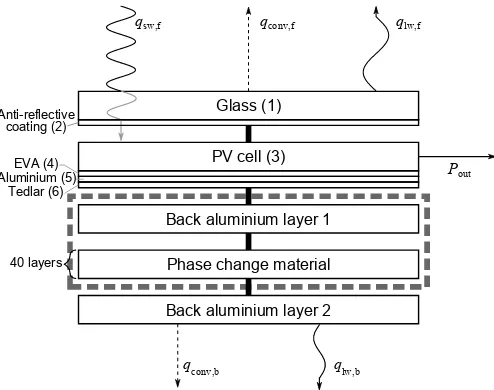
2. Model PV/PCM cell 51
The model PV/PCM cell consists of a solar cell layered on 52
top of an aluminium box containing PCM (Fig. 1). The heat 53
transfer through a PV/PCM cell is modelled performed using a 54
one dimensional finite difference energy balance method with 55
a one hour timestep. The energy balance scheme consists of 56
the incoming solar energy less the heat lost to the surroundings 57
in the form of convection and radiation and energy extracted 58
in the form of electricity (Fig. 1). Conductive heat exchange 59
occurs between each component of the PV/PCM cell. 60
qsw,f qlw,f
Glass (1)
Back aluminium layer 1
qlw,b qconv,b
PV cell (3)
Back aluminium layer 2 Phase change material 40 layers
Anti-reflective coating (2)
EVA (4)
Tedlar (6) Aluminium (5)
qconv,f
[image:3.595.39.286.216.411.2]Pout
Figure 1: Energy balance diagram showing the energy fluxes into and out of the PV/PCM system. The thick black lines rep-resent conductive heat exchange. Subscripts are defined as fol-lows: sw=shortwave, lw=longwave, conv=convective, f= front, b =back. Pout is the electrical energy generated by the
cell. The dotted grey box encompasses the components of the PV/PCM system that are omitted from the reference PV sys-tem. Numbers in brackets refer to the subscripts given to each layer in Table 1 and eqs. (1) to (6).
2.1. PV cell
61
The PV cell is based on that of Armstrong and Hurley [9] 62
and has 6 separate layers numbered 1–6 in Fig. 1 and Table 1. 63
Given the small heat capacity of the some of the layers, the glass 64
and anti-reflective coating are treated as one combined thermal 65
mass, referred to hereafter as theglasslayer, and the PV cell, 66
EVA layer, aluminium rear contact and Tedlar backing are com-67
bined into another separate thermal mass, referred to hereafter 68
as the celllayer. The combining of small thermal masses im-69
proves the numerical stability of the model by avoiding division 70
by very small numbers. 71
The total heat capacity (J K−1) of the glass layer is given by
Cglass=A
ρ1cp1z1+ρ2cp2z2
(1)
and thermal conductance (W K−1) is given by
Gglass=
A z1/k1+z2/k2
(2)
whereAis the area of the cell. The heat capacity and thermal conductance of the PV cell layer is similarly given by
Ccell=A
ρ3cp3z3+ρ4cp4z4+ρ5cp5z5+ρ6cp6z6
(3)
and
Gcell=
A
z3/k3+z4/k4+z5/k5+z6/k6
. (4)
2.2. Aluminium casing
72
The PV cell described is attached to an aluminium box 73
which sandwiches the PCM following the experimental meth-74
ods of Huanget al. [5]. It was shown that a highly conductive 75
material for the PCM housing such as aluminium is more ef-76
fective than an insulating housing such as Perspex [10]. Heat 77
losses through the sides of the PCM box are assumed to be neg-78
ligible compared to the front and back of the box based on a 79
cell size ofA=1 m2.
80
Both top and bottom aluminium sheets have heat capacity and thermal conductanceGalugiven by
Calu=Aρalucp,aluzalu (5)
and
Galu=
Akalu
zalu
. (6)
withzalu =5 mm and values ofρ,cpandkthe same as for the 81
back-contact aluminium given in Table 1. 82
2.3. Phase change material
83
PCMs can either be isothermal or undergo a small phase 84
change temperature range. Various materials have been ex-85
ploited as PCMs, including salt hydrates, fatty acids and paraf-86
fin waxes [11]. Paraffin waxes attain their highly tunable melt-87
ing points due to the varying chain lengths of their constituent 88
hydrocarbons, and as such experience a phase change range 89
[12]. 90
Ideally, a PCM should have a small thermal expansion co-91
efficient, high thermal conductivity, high latent heat of fusion 92
and a high specific heat capacity [4]. The thermal expansion 93
of the PCM is assumed to be small [13]. PCMs available com-94
mercially tend to have low coefficients of thermal conductivity, 95
which limits the rate of heat transfer [14]. However, thermal 96
conductivity can be improved in several ways. Examples of 97
this include metal fins attached to the PCM aluminium layer 98
which increase the contact surface area between the plate and 99
PCM, inserting a metal mesh into the PCM, inserting high ther-100
mal conductivity particles into the PCM, micro-encapsulation 101
of the PCM, or metal conductive strips interspersed within the 102
PCM [8, 15]. Enhancements in thermal conductance by a factor 103
of 10–20 over a plain PCM layer have been reported [16]. In 104
this study, a heat transfer enhancement factor of 2 is used. 105
The PCM component is thick and has a low thermal conduc-106
tance compared to the PV and aluminium components. There-107
fore the PCM has been divided into 40 layers to model the 108
temperature gradient through the PCM. In liquid regions of the 109
PCM, flow is assumed to be laminar and heat transfer primar-110
ily occurs by conduction rather than convection, an assumption 111
Subscript Layer ρ cp z k
1 Glass covering 3000 500 0.003 1.8
2 Anti-reflective coating 2400 691 1.0×10⁻⁷ 32
3 PV cells 2330 677 2.25×10⁻⁴ 148
4 EVA 960 2090 5.0×10⁻⁴ 0.35
5 Aluminium (cell) 2700 900 1.0×10⁻⁵ 237
[image:4.595.150.447.80.167.2]6 Tedlar 1200 1250 0.0001 0.2
Table 1: Heat transfer parameters of the PV panel, from references within [9]. ρ: material density (kg m−3), c
p: specific heat capacity (J kg−1K−1),z: material thickness (m),k: thermal conductivity (W m−1K−1).
validated by other models [7]. This enables a one-dimensional 112
numerical model to be used where PCM temperature is a func-113
tion of depth only. The properties of the PCM are shown in 114
Table 2. 115
The heat content of a non-isothermal PCM can be modelled using the enthalpy method or the effective heat capacity method [13]. The enthalpy method describes the total heat content of the PCM as a monotonically increasing, continuous and invert-ible function of temperature. Based on paraffin wax PCM melt-ing profiles in the literature [13, 17] the enthalpy function of the PCM can be described to a good approximation by a hyperbolic tangent model:
H=1 2 h
CpcmsTpcm(1−tanh(s(Tpcm−Tmelt)))
+Qliq(1+tanh(s(Tpcm−Tmelt)))
+Cpcml(Tpcm−Tmelt)(1+tanh(s(Tpcm−Tmelt)))
i (7)
wheresis a scale factor that describes the steepness of the phase change region of the curve. s = ∞for an isothermal PCM. The effective heat capacity of the PCM layer is given by the derivative of enthalpy with respect toTpcm[18]. In Eq. (7), the
cumulative heat required to melt the PCM is given by
Qliq=
Azpcm
l
ρpcmscpcmsTmelt+ρpcmlL
(8)
and the solid and liquid heat capacitiesCpcmsandCpcml
respec-116
tively of each layer are 117
Cpcm=Acpcmρpcm
zpcm
l (9)
where the parameters for solid or liquid PCM from Table 2 are 118
used in Eq. (9) as appropriate. The thermal conductance of 119
each PCM layerj=1, . . . ,40 is given by the proportion of solid 120
and liquid PCM in each layer which follows from the enthalpy 121
function: 122
Gpcmj=
Gpcml−Gpcms
2 (1+tanh(s(Tpcmj−Tmelt)))+Gpcms (10) where the thermal conductance of solid (Gpcms) and liquid
123
(Gpcml) PCM is
124
Gpcm=
Apkpcm
zpcm/l
. (11)
3. Energy balance scheme 125
3.1. Meteorological data
126
Synoptic monthly means of the 2 m air temperature, 10 m 127
eastward and northward wind components and surface solar ra-128
diation downwards were taken from ERA-Interim reanalysis 129
data [19] with a global resolution of 1.5◦ longitude×1.5◦ lat-130
itude. The 12-month period spanning July 2012 to June 2013 131
was used as the meteorological year under consideration and 132
the reanalysis data provides even global spatial coverage from 133
a combination of observations, numerical weather models and 134
forecasts [20]. 135
Monthly mean synoptic data is available 8 times per day 136
from 0000 UTC in 3-hour steps. The surface solar radiation 137
downwards field gives integrated global horizontal irradiance 138
totals in 3-hour steps for the half-days ending at 0000 UTC and 139
1200 UTC. To recover the insolation for each 3-hour period, 140
the difference between the irradiation values at the start and the 141
end of each 3-hour time period was taken and this total divided 142
by 10800 seconds to convert from a total irradiation to an aver-143
age insolation. The insolations derived were deemed to be the 144
irradiance values at the midpoint of each 3-hour period (i.e. at 145
times 0130 UTC, 0430 UTC, and so on). The magnitude of the 146
10 m wind speed is given asW = √U2+V2 whereU andV
147
are the eastward and northward wind components respectively. 148
From the 3-hour irradiance, temperature and wind speed data, 149
hourly values of each variable were extracted using cubic spline 150
interpolation. 151
3.2. Numerical model
152
The energy balance through the PV/PCM system is mod-153
elled as a system of 44 simultaneous differential equations. The 154
change in temperature in each layer is governed by 155
dTglass
dt =
1
Cglass
q
sw,f+qlw,f+qconv,f+
Gglass(Tcell−Tglass)
i
(12) dTcell
dt =
1
Ccell
h
Gcell(Talu1+Tglass−2Tcell)+
Aαcellτcell(1−αglass)I−Pout
i
(13) dTalu1
dt =
1
Calu
h
Galu(Tpcm1+Tcell−2Talu1)
i
(14)
Parameter Symbol Value
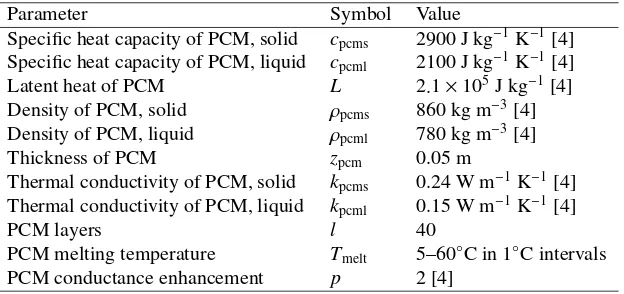
Specific heat capacity of PCM, solid cpcms 2900 J kg−1K−1[4]
Specific heat capacity of PCM, liquid cpcml 2100 J kg−1K−1[4]
Latent heat of PCM L 2.1×10⁵J kg−1[4]
Density of PCM, solid ρpcms 860 kg m−3[4]
Density of PCM, liquid ρpcml 780 kg m−3[4]
Thickness of PCM zpcm 0.05 m
Thermal conductivity of PCM, solid kpcms 0.24 W m−1K−1[4]
Thermal conductivity of PCM, liquid kpcml 0.15 W m−1K−1[4]
PCM layers l 40
PCM melting temperature Tmelt 5–60◦C in 1◦C intervals
[image:5.595.144.456.80.227.2]PCM conductance enhancement p 2 [4]
Table 2: Properties of the phase change material used in this study
dTpcm1
dt =
1 dH/dTpcm1
[Gpcm1(Tpcm2+Talu1−2Tpcm1)] (15)
dTpcmj
dt =
1 dH/dTpcmj
h
Gpcmj(Tpcm(j+1)+Tpcm(j−1)
−2Tpcmj)
i
, j=2, . . . ,39 (16)
dTpcm40
dt =
1 dH/dTpcm40
h
Gpcm40(Talu2+Tpcm39
−2Tpcm40)
i
(17) dTalu2
dt =
1
Calu
h
Galu(Tpcm40−Talu2)+qlw,b+qconv,b
i (18)
whereTiis the temperature of each layer, alu1 and alu2 refer to 156
the front and back aluminium sheets, andtis time. 157
The reference system differs from the PV/PCM system in thatTalu1in Eq. (13) becomesTalu, Eqs. (14)–(17) are omitted
and Eq. (18) is modified to become
dTalu2
dt =
1
Calu
G
alu(Tcell−Talu)+qlw,b+qconv,b. (19)
The change in nomenclature from alu2 to alu highlights the fact there is only one aluminium sheet in the reference system. The heat flows between the PV systems and the ambient are given by
qsw,f=AαglassI (20)
qlw,f=Aσ(ǫskyTsky4 −ǫglassTglass4 ) (21)
qconv,f=Ahair(Tair−Tglass) (22)
qlw,b=Aσ(ǫgroundTground4 −ǫaluTalu(2)4 ) (23)
qconv,b=Ahair(Tair−Talu(2)) (24)
Pout=AηI (25)
withIthe solar irradiance in W m−2andT
airthe ambient
tem-158
perature. It is assumed thatTground=Tair[21]. The sky
temper-159
ature is described by the relationship of Swinbank [22]: 160
Tsky =0.0552Tair1.5. (26)
For the windward (top) face of the PV panel, forced con-161
vection due to the wind will dominate free convection. The 162
empirical heat transfer coefficient of Loveday and Taki [23] is 163
used: 164
hair=8.91+2.00W (27)
which is valid for wind speedsW up to 15 m s−1. The cell is
165
assumed to be configured on an open mount and as such the 166
coefficient of convective transfer is assumed to be the same on 167
the reverse side of the panel. 168
The efficiency of the PV cellηis a function of ambient tem-169
perature and irradiance [24] such that 170
η=ηref1−β(Tcell−25)+γlog10(I/1000)
.
(28)
In Eq. (28),βis the decline in cell efficiency with respect to 171
temperature of 0.0045 K−1, andγ = 0.1 is the adjustment in 172
efficiency to account for performance decline in low light con-173
ditions. ηrefis a reference efficiency of 15.6% at a cell
temper-174
ature of 25◦C and an irradiance level of 1000 W m−2. Other
175
parameters relevant to the PV cell energy balance scheme used 176
in Eqs. (12)–(28) are given in Table 3. 177
The initial conditions for the temperature of each layer of 178
the PV cell were taken from the Nominal Operating Cell Tem-179
perature (NOCT) formula [26], which provides a good first ap-180
proximation to cell temperature: 181
Tcell=Tair+
TNOCT−20
800 I (29)
withTNOCT = 45◦C. The model was run from local midnight
182
in each location in order to give the model time to spin up with 183
no solar irradiance input, therefore except in polar summer the 184
initial condition for cell temperature is that it is equal to air 185
temperature. 186
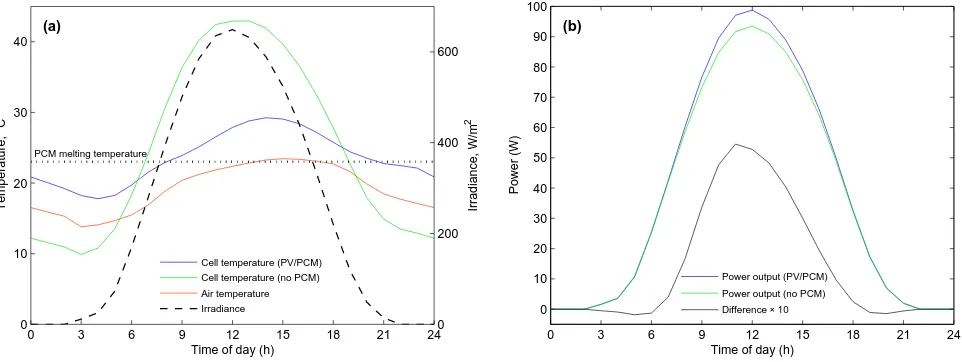
3.3. Cell temperature under PV/PCM model
187
The temperatures of a solar cell from both a PV/PCM sys-188
tem and a reference system are shown for an example location 189
in a Northern European summer in Fig. 2a. The addition of 190
the PCM layer causes a delay in temperature rise compared to 191
the reference cell before the PCM has commenced melting be-192
cause of the additional thermal mass in the system which ab-193
sorbs heat from the PV cell layer. When the PCM begins to 194
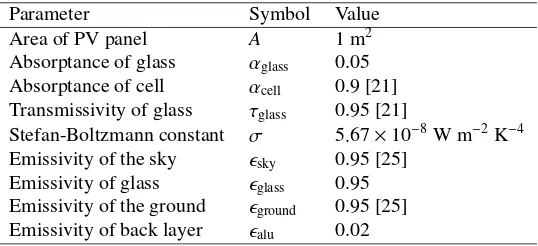
Parameter Symbol Value
Area of PV panel A 1 m2
Absorptance of glass αglass 0.05
Absorptance of cell αcell 0.9 [21]
Transmissivity of glass τglass 0.95 [21]
Stefan-Boltzmann constant σ 5.67×10⁻⁸W m−2K−4
Emissivity of the sky ǫsky 0.95 [25]
Emissivity of glass ǫglass 0.95
Emissivity of the ground ǫground 0.95 [25]
[image:6.595.164.433.80.203.2]Emissivity of back layer ǫalu 0.02
Table 3: Parameters used within this study to simulate the energy balance through the PV cell.
reach the melting temperature, thermal energy is absorbed by 195
the PCM as it starts to melt, which further slows down the rate 196
of temperature increase in the PV cell. Peak temperature in the 197
PV/PCM cell is reached later than peak temperature in the ref-198
erence cell. The larger thermal mass of the PV/PCM cell results 199
in it cooling more slowly than the reference cell after reaching 200
peak temperature, and as it approaches the phase change range 201
from above thermal energy is returned from the PCM to the so-202
lar cell causing the cell to remain warmer than the reference 203
cell. By the time of day that the PV/PCM cell is warmer than 204
the reference, irradiance levels are low and the PV panel gen-205
erates only a small fraction of its total daily electricity output. 206
This is expected, in line with previous outdoor experiments [5]. 207
The effect is displayed in Fig. 2b, where it is shown that the 208
gain in power from the PV/PCM cell compared to the reference 209
cell during the middle of the day more than offsets the marginal 210
negative contribution in the early morning and late afternoon 211
when irradiance levels are much lower than at midday. Through 212
the evening, the PV/PCM cell is significantly warmer than the 213
reference cell as the PCM layer continues to dispose of its heat. 214
4. Results of global simulation 215
Energy output was calculated for all land points on a 1.5◦ 216
×1.5◦grid excluding the Antarctic continent. The total annual 217
energy output at each grid point, in kWh, is given by 218
E= 365 12000
12
X
m=1 23
X
h=0
Ihmηhm. (30)
Irradiance and solar cell efficiency are sampled hourly, and the 219
sum runs over the hours of each typical dayhand months of the 220
yearm. The factor of 365/12 is to scale the one day per month 221
result to a full year and the additional factor of 1/1000 converts 222
from Wh to kWh. 223
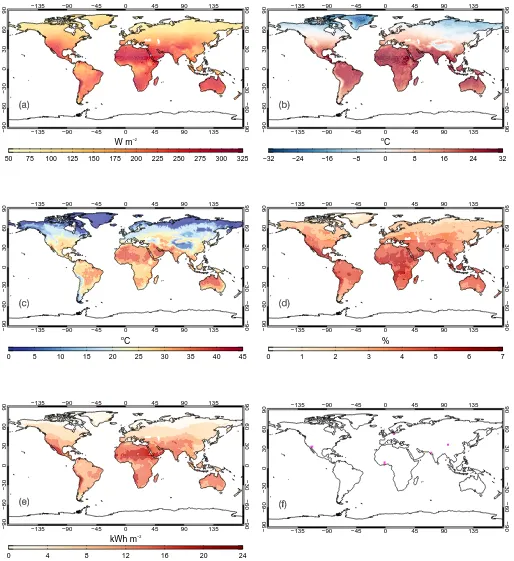
4.1. Annual increase in energy output
224
Figs. 3a and 3b show the insolation and annual average 225
temperature from the ERA reanalysis data. The power output 226
for each grid point was calculated both under the reference PV 227
panel and the PV/PCM system for PCM melting temperatures 228
varying between 0–50◦C in 1◦C intervals, and the PCM melting 229
temperature that produced the largest gain in energy output at 230
each grid point was found (Fig. 3c). The general trend is for re-231
gions that experience the highest ambient temperatures to bene-232
fit from the higher PCM melting temperatures, with the optimal 233
melting temperature in excess of 30◦C for much of Africa, the 234
Middle East, South Asia, Australia, and South America. There 235
are several notable high-insolation areas where low PCM melt-236
ing temperatures are favoured such as the region North East of 237
the Himalayas and in the mountain ranges on the West coast of 238
South America. Regions which are typically cool and do not 239
receive high irradiance levels show a preference for lower PCM 240
melting temperatures. 241
The largest relative improvements from PV/PCM systems 242
over non-PCM systems are located in Africa, the Middle East, 243
Central and South America, and the Indonesian archipelago 244
(Fig. 3d). An improvement in energy output of over 6% is seen 245
on the Western coast of Mexico and improvements of over 5% 246
are seen in many regions. These highly suitable locations for 247
PCM are all characterised by high ambient temperatures, ex-248
cept for on the West coast of South America. In all other parts of 249
the world, although the relative improvement tends to be lower, 250
there is still a positive increase in electrical energy output to be 251
gained from using a PCM with the optimal melting temperature 252
for the location. 253
The greatest absolute energy increase using a PCM is again 254
to be found in tropical regions and is mostly coincident with 255
the locations of relative improvement as shown in Fig. 3e, with 256
parts of the Sahara, Central America, Chile and the Arabian 257
peninsula showing an annual electrical output increase of over 258
20 kWh m−2.
259
4.2. Sensitivity of energy output increase to PCM melting
tem-260
perature
261
Locations that are geographically varied and where large 262
solar farms either currently exist or are planned to be built were 263
investigated further to determine sensitivity to PCM melting 264
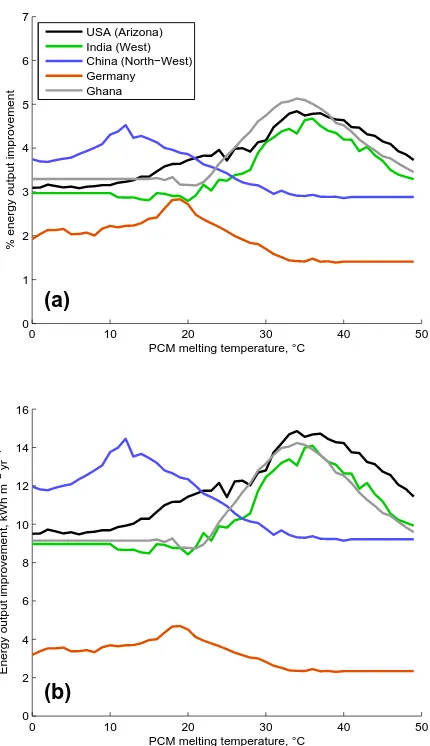
temperature. These locations are displayed in Table 4 and Fig. 265
3f. 266
The relative and absolute improvements in electrical output 267
using the PV/PCM cell compared to the reference is shown for 268
the full range of PCM melting temperatures in Fig. 5. At all 269
locations, the improvement in solar PV performance is peaked 270
around the optimal value, however, a PCM melting temperature 271
that is slightly above or below the optimal temperature will still 272
0 3 6 9 12 15 18 21 24 0
10 20 30 40
Temperature, °C
Time of day (h)
(a)
PCM melting temperature
0 200 400 600
Irradiance, W/m
2
Cell temperature (PV/PCM) Cell temperature (no PCM) Air temperature Irradiance
0 3 6 9 12 15 18 21 24
0 10 20 30 40 50 60 70 80 90 100
Time of day (h)
Power (W)
(b)
Power output (PV/PCM) Power output (no PCM) Difference × 10
Figure 2: (a) Temperatures of PV/PCM and reference cells. PV cell temperature with a PCM (blue) and without a PCM (green) for a northern hemisphere location in June. Also shown is air temperature (red) and horizontal solar irradiance (black dashes, right scale). The PCM melting temperature is 23◦C. (b) Power output from PV/PCM cell and reference cell. Also shown is the power output improvement of PV/PCM cell multiplied by a factor of 10 (black curve).
Name Country Location Size Reference
Agua Caliente USA 33.0◦N, 113.5◦W 250 MW [27]
Mesquite USA 33.3◦N, 112.9◦W 150 MW [28]
Charanka India 23.9◦N, 71.2◦E 214 MW [29]
Golmud China 36.4◦N, 95.3◦E 200 MW [30]
Neuhardenberg Germany 52.6◦N, 14.2◦E 145 MW [31]
[image:7.595.56.537.85.266.2]Nzema Ghana 5–11◦N, 0–3◦W 155 MW [32]
Table 4: Characteristics of large solar farms investigated. The precise location of Nzema is not known so the latitude/longitude grid that covers the whole of Ghana has been investigated. The two arrays in the USA are close enough together to be grouped in the same grid cell to the resolution of the model. See also Fig. 3f.
deliver most of the increase in performance available at the op-273
timal value. It can be seen in Fig. 5 that when a PCM melting 274
temperature that is significantly different from the optimal is 275
used, performance improvement does not decline further with 276
any additional excursion from optimal melting temperature and 277
is still positive. 278
5. Discussion 279
Overall, areas experiencing high levels of solar irradiance 280
appear to benefit most from PCM cooling. This follows from 281
Eqs. (12) and (13) in which a large solar irradiance input I
282
drives an increase in PV front glass and cell temperatures so ef-283
forts to mitigate these temperature rises should lead to increased 284
PV efficiency. The main effect of ambient temperature is to 285
determine the most beneficial PCM melting temperature; a hot 286
climate will require a high PCM melting temperature and a cool 287
climate favours a low PCM melting temperature. For areas with 288
comparable insolations, a cooler climate is still preferable with 289
PCM as the PCM helps to keep cell temperature nearer to the 290
ambient, and if the ambient temperature is lower the baseline 291
efficiency will be higher. 292
The greatest improvements in PV/PCM cell performance 293
are realised by choosing a PCM that fully melts over the course 294
of the day and fully resolidifies in the evening, making use of 295
the latent heat capacity of the phase change material. Follow-296
ing this, PCM melting temperatures that are too high or too low 297
do not produce the required effect, however, the addition of the 298
PCM as a thermal mass to the solar cell does slow down heating 299
and cooling of the solar cell to the effect that the PV/PCM cell 300
does not get as hot as the reference cell during peak solar hours. 301
It is shown in the variation ofTmeltin Fig. 5 that using a PCM
302
melting temperature that differs from the ideal temperature by 303
a few degrees also results in a significant improvement in PV 304
energy output performance where at least part of the latent heat 305
capacity of the PCM is used. 306
The results obtained in terms of relative improvement are 307
slightly lower than those found in the literature for an as-308
sessment on the efficiency improvement for outdoor tests on 309
PV/PCM systems, i.e. 6.8% in Pakistan and 3.8% in Ireland [7]. 310
However, as this is a global study where one PCM is used for a 311
full year of meteorological conditions, it is likely that there are 312
many times throughout the year that the PCM is non-optimal, 313
unlike in [7] where the experimental period was 2 weeks; in 314
these experiments, day-to-day conditions are likely to be more 315
W m−2
50 75 100 125 150 175 200 225 250 275 300 325
−135 −90 −45 0 45 90 135
−135 −90 −45 0 45 90 135
−90
−60
−30
0
30
60
90
−90
−60
−30
0
30
60
90
o
C
−32 −24 −16 −8 0 8 16 24 32
−135 −90 −45 0 45 90 135
−135 −90 −45 0 45 90 135
−90
−60
−30
0
30
60
90
−90
−60
−30
0
30
60
90
o
C
0 5 10 15 20 25 30 35 40 45
−135 −90 −45 0 45 90 135
−135 −90 −45 0 45 90 135
−90
−60
−30
0
30
60
90
−90
−60
−30
0
30
60
90
%
0 1 2 3 4 5 6 7
−135 −90 −45 0 45 90 135
−135 −90 −45 0 45 90 135
−90
−60
−30
0
30
60
90
−90
−60
−30
0
30
60
90
kWh m−2
0 4 8 12 16 20 24
−135 −90 −45 0 45 90 135
−135 −90 −45 0 45 90 135
−90
−60
−30
0
30
60
90
−90
−60
−30
0
30
60
90
−135 −90 −45 0 45 90 135
−135 −90 −45 0 45 90 135
−90
−60
−30
0
30
60
90
−90
−60
−30
0
30
60
90
Figure 3: (a) Daily-averaged horizontal insolation for the 12 month period July 2012–June 2013 from the ERA-Interim dataset. (b) Average near-surface air temperature for the July 2012–June 2013 period from ERA-Interim dataset. (c) PCM melting temperature that leads to the greatest increase in solar PV energy output in the PV/PCM system. (d) Increase in electrical output from using the PV/PCM system over the PV reference system with the PCM melting temperature equal to the ideal value from Fig. (c). (e) Total improvement in annual electrical output for a PV/PCM system over the PV reference with the PCM melting temperature equal to the ideal value in Fig. (c). (f) Locations used in the sensitivity analysis (section 4.2).
[image:8.595.42.556.104.665.2]J F M A M J J A S O N D 0
10 20 30 40
Month
Temperature, °C
(a)
0 100 200 300 400
Insolation, W/m
2
J F M A M J J A S O N D 0
10 20 30
Month
Temperature, °C
(b)
0 100 200 300
Insolation, W/m
2
J F M A M J J A S O N D −10
0 10 20 30
Month
Temperature, °C
(c)
0 100 200 300
Insolation, W/m
2
J F M A M J J A S O N D −10
0 10 20 30
Month
Temperature, °C
(d)
0 100 200 300
Insolation, W/m
2
J F M A M J J A S O N D 0
10 20 30
Month
Temperature, °C
(e)
0 100 200 300
Insolation, W/m
[image:9.595.323.538.87.460.2]2
Figure 4: Climate data for the locations analysed in section 4.2: (a) Arizona; (b) India; (c) China; (d) Germany; (e) Ghana. Bars indicate temperature (left scale), lines indicate irradiance (right scale).
similar and an optimal PCM should perform well across the du-316
ration of the experiment. The variability of climate is reflected 317
in the results of this study. Of the locations analysed in de-318
tail, Ghana experiences the smallest inter-seasonal variation in 319
temperature and irradiance levels (Fig. 4e). The uniformity of 320
year-round climate means that the annual most beneficial PCM 321
melting temperature is closer to ideal for many months the year 322
which may be why therelativeincrease in electricity output at 323
optimal PCM melting temperature is slightly higher for Ghana 324
than for Arizona, but in absolute terms Arizona produces a big-325
ger improvement. In Germany, where wintertime irradiance is 326
very low, the lowest relative PCM improvement is seen. PCMs 327
may therefore be of limited benefit in areas of low solar irradi-328
ance but a PCM that is optimised for summer conditions should 329
perform better than one optimised for the annual mean condi-330
tions in higher-latitude locations. 331
We perform an illustrative cost assessment to determine 332
whether PV/PCM systems would currently be commercially 333
viable. To implement 1 m−2 of PV/PCM would require an
334
additional material cost of AC244.31 (Table 5). Assuming a
335
0 10 20 30 40 50
0 1 2 3 4 5 6 7
% energy output improvement
PCM melting temperature, °C
(a)
USA (Arizona) India (West) China (North−West) Germany Ghana
0 10 20 30 40 50
0 2 4 6 8 10 12 14 16
Energy output improvement, kWh m
−2
yr
−1
PCM melting temperature, °C
(b)
Figure 5: The improvement in PV output as a function of PCM melting temperatureTmelt.
Commodity Unit cost Mass required Total cost
PCM AC4.93 kg−1 43 kg m−2 AC211.99 m−2
Aluminium AC1.60 kg−1 16.2 kg m−2 AC32.32 m−2
[image:9.595.41.287.87.425.2]Total AC244.31 m−2
Table 5: Example costs of materials required to include a 0.05m layer of PCM with aluminium casing. References [34] and [35].
25 year lifespan and typical EU-27 electricity retail costs of 336
AC0.1836 kWh−1 [33], a PV/PCM system would need to
gen-337
erate an additional 53.2 kWh of electricity per year for each 338
square metre over a PV-only system to overcome these addi-339
tional material costs. This is not currently satisfied by any loca-340
tion, however this figure would be highly dependent on actual 341
material costs and local energy prices. 342
6. Conclusions 343
PV/PCM systems can curb the rapid rise in PV cell temper-344
atures during the daytime and keep PV cell temperatures lower 345
during the peak solar hours of the day, improving solar cell ef-346
ficiency and electrical energy output. The input of solar irradi-347
ance causes the PV glass and cell to heat up during the daytime. 348
Heat is transferred from the PV cell to the PCM, which acts as 349
a heat sink as it melts, both delaying temperature rise in the PV 350
cell and keeping overall temperature rise lower than in a non-351
PCM cell. Heat energy is released back from the PCM layer to 352
the solar cell through the evening and overnight. 353
The benefits of PV/PCM systems at all land locations in 354
the world excluding Antarctica have been demonstrated. Us-355
ing a numerical finite difference model solving the heat transfer 356
equation, it is shown that energy output improvements over a 357
reference system with no PCM are everywhere positive and in 358
some locations in excess of 6% on an annualised basis, with 359
many regions of the world experiencing a potential total en-360
ergy gain of 23 kWh m−2based on a reference cell efficiency of
361
15.6%. The best results are seen where an ideal PCM melting 362
temperature for the location in question is used and the PCM 363
melts fully over the course of the day and resolidifies in the 364
evening. In this case the full latent heat content of the PCM 365
is used and the PCM layer acts as thermal mass with a high 366
effective heat capacity. PV/PCM systems provide the greatest 367
improvements in absolute and relative terms in Africa, South 368
Asia, Australia and South and Central America. These areas re-369
ceive high levels of irradiance and often experience high ambi-370
ent temperatures year-round. Many of these are areas where so-371
lar energy could greatly aid development by providing an abun-372
dant, reliable electricity source. It has been demonstrated that 373
single junction silicon PV/PCM systems are not currently cost-374
effective, but this may be possible for technologies such as con-375
centrating PV and multi-junction solar cells which reach higher 376
temperatures and electrical outputs. Furthermore, we did not 377
consider tracking systems in our paper, which most utility-scale 378
solar farms would implement. Based on this global overview, 379
more detailed regional models could be explored to further iso-380
late the conditions necessary for enhanced solar PV energy out-381
put using phase change materials. 382
Acknowledgements 383
This work was financially supported by the Engineering and 384
Physical Sciences Research Council through the University of 385
Leeds Doctoral Training Centre in Low Carbon Technologies. 386
References 387
[1] M. J. Huang, P. C. Eames, B. Norton, Thermal regulation of
building-388
integrated photovoltaics using phase change materials, International
Jour-389
nal of Heat and Mass Transfer 47 (12-13) (2004) 2715–2733.
390
[2] E. Skoplaki, J. A. Palyvos, On the temperature dependence of
photo-391
voltaic module electrical performance: A review of efficiency/power
cor-392
relations, Solar Energy 83 (5) (2009) 614–624.
393
[3] S. Krauter, Increased electrical yield via water flow over the front of
pho-394
tovoltaic panels, Solar Energy Materials and Solar Cells 82 (1-2) (2004)
395
131–137.
396
[4] C. S. Malvi, D. W. Dixon-Hardy, R. Crook, Energy balance model of
397
combined photovoltaic solar-thermal system incorporating phase change
398
material, Solar Energy 85 (7) (2011) 1440–1446.
399
[5] M. J. Huang, P. C. Eames, B. Norton, Phase change materials for limiting
400
temperature rise in building integrated photovoltaics, Solar Energy 80 (9)
401
(2006) 1121–1130.
402
[6] M. J. Huang, The effect of using two PCMs on the thermal regulation
403
performance of BIPV systems, Solar Energy Materials and Solar Cells
404
95 (3) (2011) 957–963.
405
[7] A. Hassan, Phase Change Materials for Thermal Regulation of
Build-406
ing Integrated Photovoltaics, Ph.D. thesis, Dublin Institute of Technology,
407
2010.
408
[8] S. Maiti, S. Banerjee, K. Vyas, P. Patel, P. K. Ghosh, Self regulation of
409
photovoltaic module temperature in V-trough using a metal-wax
compos-410
ite phase change matrix, Solar Energy 85 (9) (2011) 1805–1816.
411
[9] S. Armstrong, W. G. Hurley, A thermal model for photovoltaic
pan-412
els under varying atmospheric conditions, Applied Thermal Engineering
413
30 (11) (2010) 1488–1495.
414
[10] A. Hasan, S. McCormack, M. Huang, B. Norton, Evaluation of phase
415
change materials for thermal regulation enhancement of building
inte-416
grated photovoltaics, Solar Energy 84 (2010) 1601–1612.
417
[11] B. Zalba, J. M. Mar´ın, L. F. Cabeza, H. Mehling, Review on thermal
418
energy storage with phase change: materials, heat transfer analysis and
419
applications, Applied thermal engineering 23 (3) (2003) 251–283.
420
[12] A. Heinz, W. Streicher, Application of Phase Change Materials and PCM
421
slurries for thermal energy storage, in: Ecostock Conference, Pomona,
422
USA, 2006.
423
[13] P. Lamberg, R. Lehtiniemi, A. Henell, Numerical and experimental
in-424
vestigation of melting and freezing processes in phase change material
425
storage, International Journal of Thermal Sciences 43 (3) (2004) 277–
426
287.
427
[14] L. Fan, J. M. Khodadadi, Thermal conductivity enhancement of phase
428
change materials for thermal energy storage: A review, Renewable and
429
Sustainable Energy Reviews 15 (1) (2011) 24–46.
430
[15] R. Velraj, R. V. Seeniraj, B. Hafner, C. Faber, K. Schwarzer, Heat transfer
431
enhancement in a latent heat storage system, Solar Energy 65 (3) (1999)
432
171–180.
433
[16] O. Ottinger,¨ PCM/Graphitverbund-Produkte f¨ur
Hochleis-434
tungsw¨armespeicher, in: ZAE Symposium: W¨arme- und
435
K¨altespeicherung mit Phasenwechselmaterialien (PCM), 2004.
436
[17] M. Zukowski, Mathematical modeling and numerical simulation of a
437
short term thermal energy storage system using phase change material
438
for heating applications, Energy Conversion and Management 48 (2007)
439
155–165.
440
[18] P. W. Bridgman, A complete collection of thermodynamic formulas,
441
Physical Review 3 (1914) 273–281.
442
[19] European Centre for Medium-range Weather Forecasting, ERA Interim,
443
Synoptic Monthly Means, Full Resolution. Available from http://
444
data-portal.ecmwf.int/data/d/interim_full_mnth/. Last
ac-445
cessed 20 September 2013.
446
[20] D. Dee, S. Uppala, A. Simmons, P. Berrisford, P. Poli, S. Kobayashi,
447
U. Andrae, M. Balmaseda, G. Balsamo, P. Bauer, P. Bechtold, A. Beljaars,
448
L. van de Berg, J. Bidlot, N. Bormann, C. Delsol, R. Dragani, M. Fuentes,
449
A. Geer, L. Haimberger, S. Healy, H. Hersbach, E. H´olm, L. Isaksen,
450
P. Kållberg, M. K¨ohlera, M. Matricardi, A. McNally, B. Monge-Sanz,
451
J.-J. M. abd B.-K. Park, C. Peubey, P. de Rosnay, C. Tavolato, J.-N.
452
Th´epauta, F. Vitarta, The ERA-Interim reanalysis: configuration and
per-453
formance of the data assimilation system, Quarterly Journal of the Royal
454
Meteorological Society 137 (2011) 553–597.
455
[21] G. Notton, C. Cristofari, M. Mattei, P. Poggi, Modelling of a double-glass
456
photovoltaic module using finite differences, Applied Thermal
Engineer-457
ing 25 (17) (2005) 2854–2877.
458
[22] W. C. Swinbank, Long-wave radiation from clear skies, Quarterly journal
459
of the Royal Meterological Society 89 (1963) 339–348.
460
[23] D. L. Loveday, A. H. Taki, Convective heat transfer coefficients at a plane
461
surface on a full-scale building facade, International Journal of Heat and
462
Mass Transfer 39 (8) (1996) 1729–1742.
463
[24] D. L. Evans, Simplified method for predicting photovoltaic array output,
464
Solar Energy 27 (6) (1981) 555–560.
465
[25] A. D. Jones, C. P. Underwood, A thermal model for photovoltaic systems,
466
Solar Energy 70 (2001) 349–359.
467
[26] E. Lorenzo, Energy collected and delivered by PV modules, in: A. Luque,
468
S. Hegedus (Eds.), Handbook of photovoltaic science and engineering,
469
John Wiley and Sons, 905–970, 2003.
470
[27] First Solar, World’s Largest Operational Solar PV Project, Agua
471
Caliente, Achieves 250 Megawatts of Grid-Connected Power.
Avail-472
able from http://investor.firstsolar.com/releasedetail.
473
cfm?ReleaseID=706034. Accessed 4 March 2013.
474
[28] Energy Matters, Construction Of Mesquite Solar 1 Completed.
Avail-475
able fromhttp://www.energymatters.com.au/index.php?main_
476
page=news_article&article_id=3545. Accessed 4 March 2013.
477
[29] S. McMahon, Gujarat’s 214MW solar park named as Asia’s largest
478
single PV plant. Available from http://www.pv-tech.org/
479
news/gujarats_214mw_solar_park_named_as_asias_largest_
480
single_pv_plant.
481
[30] A. Cohen, Solar Farms. Available from http://www.
482
thehouseofsolar.com/solar-farms/. Accessed 4 March 2013.
483
[31] D. Lenardic, Large-scale photovoltaic power plants ranking 1–50.
Avail-484
able fromhttp://www.pvresources.com/PVPowerPlants/Top50.
485
aspx. Accessed 4 March 2013.
486
[32] C. Rhead, Africa’s largest solar PV plant.
Avail-487
able from http://www.blue-energyco.com/news/
488
africas-largest-solar-pv-plant/. Accessed 4 March 2013.
489
[33] European Commission, EU energy in figures – pocketbook 2012.
490
Available from http://ec.europa.eu/energy/publications/
491
doc/2012_energy_figures.pdf. Last accessed 20 February 2014.
492
[34] A. L´opez-Navarro, J. Biosca-Taronger, J. Corber´an, C. P. nalosa,
493
A. L´azaro, P. Dolado, J. Pay´a, Performance characterization of a PCM
494
storage tank, Applied Energy 119 (2014) 151–162.
495
[35] Alibaba, Aluminium sheet products. Available from http:
496
//www.alibaba.com/showroom/aluminum-sheet.html. Accessed
497
21 February 2014.
498
![Table 1: Heat transfer parameters of the PV panel, from references within [9]. ρ: material density (kg m−3), cp: specific heatcapacity (J kg−1 K−1), z: material thickness (m), k: thermal conductivity (W m−1 K−1).](https://thumb-us.123doks.com/thumbv2/123dok_us/7961908.198788/4.595.150.447.80.167/transfer-parameters-references-material-specic-heatcapacity-thickness-conductivity.webp)