This is a repository copy of The impact of diabetes on employment in Mexico. White Rose Research Online URL for this paper:
http://eprints.whiterose.ac.uk/136122/ Version: Published Version
Monograph:
Seutring, Till, Goryakib, Yevgeniy and Suhrcke, Marc Eckart
orcid.org/0000-0001-7263-8626 (2014) The impact of diabetes on employment in Mexico. Working Paper. CHE Research Paper . Centre for Health Economics, University of York , York, UK.
eprints@whiterose.ac.uk https://eprints.whiterose.ac.uk/
Reuse
Items deposited in White Rose Research Online are protected by copyright, with all rights reserved unless indicated otherwise. They may be downloaded and/or printed for private study, or other acts as permitted by national copyright laws. The publisher or other rights holders may allow further reproduction and re-use of the full text version. This is indicated by the licence information on the White Rose Research Online record for the item.
Takedown
If you consider content in White Rose Research Online to be in breach of UK law, please notify us by
The Impact of Diabetes on
Employment in Mexico
The impact of diabetes on employment in Mexico
1
Till Seuring 2
Yevgeniy Goryakin 3
Marc Suhrcke
1
Health Economics Group, Norwich Medical School, University of East Anglia, Norwich, UK
2
UKCRC Centre for Diet and Activity Research (CEDAR), Institute of Public Health, Cambridge, UK
3
Centre for Health Economics, University of York, UK
Background to series
CHE Discussion Papers (DPs) began publication in 1983 as a means of making current research material more widely available to health economists and other potential users. So as to speed up the dissemination process, papers were originally published by CHE and distributed by post to a worldwide readership.
The CHE Research Paper series takes over that function and provides access to current research output via web-based publication, although hard copy will continue to be available (but subject to charge).
Acknowledgements
We are grateful to the participants in the 2013 Economics of Disease conference (Darmstadt, Germany), participants in the Health Economics Group Seminar at the University of East Anglia and Marcello Morciano, Veronica Toffolutti, Pieter Serneels and Ruth Hancock for helpful comments.
Disclaimer
Papers published in the CHE Research Paper (RP) series are intended as a
contribution to current research. Work and ideas reported in RPs may not always represent the final position and as such may sometimes need to be treated as work in progress. The material and views expressed in RPs are solely those of the authors and should not be interpreted as representing the collective views of CHE research staff or their research funders.
Further copies
Copies of this paper are freely available to download from the CHE website
www.york.ac.uk/che/publications/ Access to downloaded material is provided on the understanding that it is intended for personal use. Copies of downloaded papers may be distributed to third-parties subject to the proviso that the CHE publication source is properly acknowledged and that such distribution is not subject to any payment.
Printed copies are available on request at a charge of £5.00 per copy. Please contact the CHE Publications Office, email che-pub@york.ac.uk, telephone 01904 321405 for further details.
Centre for Health Economics Alcuin College
University of York York, UK
www.york.ac.uk/che
Abstract
1
Introduction
Diabetes, similar to other conditions that have been coined ”diseases of affluence”, has traditionally been seen as mostly a problem of the developed, more affluent countries. Only in recent years the awareness has been growing of the sheer size of the problem in health terms (Yach et al., 2006; Hu, 2011). Mexico is one example of a middle-income country that has seen diabetes rates increase sharply over the last years, from about 7.5 percent in 2000 (Barquera et al., 2013) to 12.6 percent in 2013 (International Diabetes Federation, 2013). The high prevalence of diabetes in Mexico reflects an epidemiological transition from a disease pattern previously characterized by high mortality and infectious diseases to low-mortality rates and non-communicable diseases (NCDs) affecting predominantly adults (Stevens et al., 2008). This transition has likely been reinforced both by nutritional changes away from a traditional diet towards an energy dense, but nutritionally poor diet with an increasing amount of processed foods and sugars (Barquera et al., 2008; Basu et al., 2013), as well as what appears to be a particular genetic predisposition of many Mexicans to develop type 2 diabetes (Williams et al., 2014). While many of the high-income countries may be in a position to cope resource-wise with the health care consequences of diabetes, this will be less so the case for Mexico and other low- and middle-income countries (LMICs). The most recent ”cost-of-illness” estimates put the costs of diabetes to the Mexican society at more than US$778 million in 2010, with a large part of these costs being paid out-of-pocket (Arredondo and De Icaza, 2011). While the above includes some estimate of indirect costs, meant to capture the cost burden attributable to foregone productivity resulting from diabetes, there exists no rigorous, econometric assessment of the effect of diabetes on employment chances for Mexico as the research has thus far focused on high-income countries (Lin, 2011; Latif, 2009; Brown et al., 2005; Minor, 2011; Bastida and Pagán, 2002; Vijan et al., 2004; Zhang et al., 2009).
There are several reasons to expect a significant adverse effect of diabetes on employment chances in Mexico and that this effect might be stronger than in high-income countries. In Mexico type 2 diabetes is increasingly affecting people in their productive age, raising the possibility that a larger share of people with diabetes will have to cope with debilitating complications already relatively early in life (Barquera et al., 2013; Villalpando et al., 2010). Further, only a minority of Mexicans appears to successfully manage their diabetes condition, with as much as 70 percent of the people with diabetes having poor control over their disease (Villalpando et al., 2010). In addition, many Mexicans are working in the large informal economy1
, possibly limiting their access to quality health care and hence to appropriate treatment options. All these factors are likely to both increase the risk of developing debilitating diabetes complications as well as to reduce productivity as a result. Against this background, the aim of this study is to investigate how diabetes affects employment probabilities in a middle-income country such as Mexico. To the best of our knowledge this is the first such paper on Mexico and indeed on any low- or middle-income country (LMIC). We also investigate if the impact of diabetes on employment chances differs across age groups and — again for the first time in this field — wealth categories.
1
Since some earlier studies have found diabetes to be endogenous (Lin, 2011; Latif, 2009; Brown et al., 2005; Minor, 2011), there would be a risk of inconsistent estimates if this was ignored in our case. Endogeneity might arise due to reverse causality: employment status and a related lifestyle may also influence the odds of developing diabetes. A job with long office working hours might push a person’s diet or exercise pattern towards a more unhealthy and sedentary lifestyle due to reduced leisure time, increasing the per-son’s risk for diabetes. In addition, unobserved factors, such as personal traits, could simultaneously influence a person’s employment as well as his or her diabetes status. A less ambitious person could be less productive in a job, increasing the risk of being laid off, and he or she could simultaneously have only modest, if any, exercise goals or healthy eating habits, thereby increasing the chances of developing diabetes. In order to account for this possible endogeneity we use data from the second wave of the Mexican Family Life Survey (MxFLS) from 2005, which not only provides information on people’s diabetes status and socioeconomic background, but also on parental diabetes, enabling us to con-struct an instrumental variable similar to what has been used in the previous literature on high-income countries.2
The data also allows the extension of the analysis to test if the inclusion of information on parental education as an additional control variable affects the instrumental variable (IV) parameter estimates.
The remainder of the paper is structured as follows. The next section reviews the related literature this study builds on. Section 3 provides details about the used dataset and the econometric specification; and section 4 presents and discusses the empirical results. Section 5 concludes.
2
Literature review
The majority of the more recent studies on the labour market impact of diabetes tried to account for the possible endogeneity of diabetes using family history of diabetes as an instrument.
Brown et al. (2005) estimated the impact of the disease on employment in 1996–1997 in an older population of Mexican Americans in the US close to the Mexican border, using a recursive bivariate probit model. They found diabetes to be endogenous for women but not for men. The results of the IV estimation suggested no significant effect on women, indicating an overestimation of the effect for women when endogeneity was not accounted for. For men, the probit estimates indicated a significant adverse effect of about 7 percent. Latif (2009) estimated the effect of the disease on employment probabilities in Canada in 1998. Contrary to Brown et al. (2005), he found diabetes to be exogenous for females and endogenous for males; taking this into account he obtained a significant negative impact on the employment probabilities for women, but not for men. Because the simple probit model showed a significant negative effect for males, Latif concluded that not accounting for endogeneity resulted in an overestimation of the effect on male employment
2
chances. Minor (2011) investigated the effect of diabetes on female employment, among other outcomes, in the US in 2006. This particular study differed from earlier work in that it not only analysed the effects of diabetes in general, but also of type 1 and type 2 diabetes separately. The study found diabetes to be endogenous and underestimated if exogeneity was assumed. In the IV estimates, type 2 diabetes had a significant negative effect on female employment chances. For Taiwan, Lin (2011) found diabetes to be endogenous, with the IV results showing significant changes in the employment effect of diabetes. The impact was found to be significantly negative for men in the IV model indicating an underestimation in the standard probit model, where the diabetes coefficient was also significant but much smaller in size. For women, no significant effect was found in the IV estimation after the probit model had indicated a significant and negative impact of diabetes.
Accordingly, at least in some cases, there seems to be the risk of biased estimates of the impact of diabetes on employment, when exogeneity is assumed, with an a priori ambiguous bias. Hence, our decision in this study to also assess if diabetes is endogenous and how precisely taking account of endogeneity might affect the estimates.
3
Methodology
3.1
Dataset and descriptive statistics
The dataset used for the empirical analysis is the Mexican Family Life Survey (MxFLS). It is a nationally representative household survey which was conducted in 2002 and 2005. We use data from the second wave in 2005, which includes almost 40,000 individuals. Interviews were conducted with all household members aged 15 and above and information on a wide range of social, demographic, economic and health behaviours of the individuals and their families was collected (Rubalcava and Teruel, 2008). While there are more recent datasets available on Mexico, none of these provide as extensive information on parental characteristics as does the MxFLS, which includes information on parental diabetes and education status, even if parents were not alive anymore or were living in a non-surveyed household at the time of the survey. Diabetes is self-reported and 3.7 percent of males and 5.1 percent of females report a diagnosis by a doctor.3
Unfortunately we cannot — with
3
the data at hand — distinguish between the different types of diabetes. It can be assumed, however, that about 90 percent of the reported diagnoses are due to type 2 diabetes, which is by far the most common type of diabetes (Sicree et al., 2011). The sub-sample used for analysis is limited to the age group of 15 to 64 years, which represents the majority of the working population. To allow for heterogeneity in the coefficients across gender, the sample has been split to estimate the male and female groups separately.
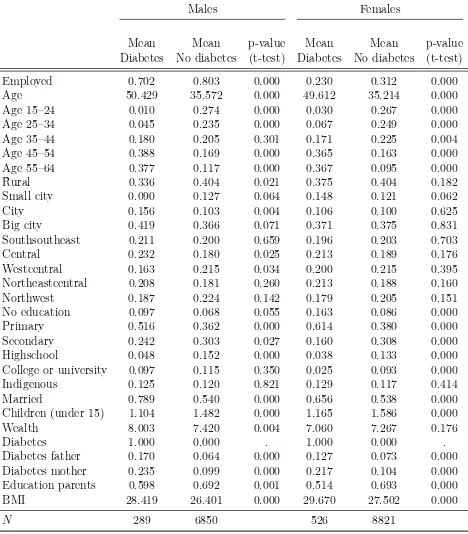
The descriptive statistics presented in Table I suggest that the groups of respondents with and without diabetes differ significantly in various aspects. Both males and females with diabetes have a lower employment rate than their counterparts. This would suggest that diabetes has a negative impact on the employment chances of both males and females with diabetes. However, since the groups with diabetes are also significantly older and differ in terms of education, this may be a spurious relationship. As a result, only a multivariate analysis will provide more reliable information on how diabetes truly affects employment probabilities.
3.2
Econometric specification
We first estimate a probit model with the following specification
Employedi =β0+β1Diabetesi +β2Xi+ui (1)
where diabetes is assumed to be exogenous. Employedi takes the value of 1 if person
i is employed and 0 if unemployed. Employment status is defined as having worked or carried out an activity that helped with the household expenses for at least ten hours over the last week. Diabetesi denotes the main independent variable of interest, taking
the value of 1 if individual i has reported a diagnosis of diabetes and 0 otherwise. Xi
contains various control variables. Dummy variables for age intervals are included to account for work experience as well as other effects of age on employment. Education is captured by dummy variables indicating if the highest level of schooling attained was either primary school, secondary school, high school, university or some other form of higher education with no education serving as the reference category, to control for the impact of education on employment and to account for the relationship between diabetes and education (Agardh et al., 2011). Since Mexico is a large and diverse country with regional socioeconomic differences as well as very poor rural and very developed urban areas, we also include regional dummies for five different Mexican regions4
and three dummy variables to capture the effects of living in a rural or urban environment5
, with rural as the reference category. Further, to control for labour market discrimination against and possible differences in genetic susceptibility to diabetes of indigenous populations (Yu
4
The region variables have been constructed after recommendations on the MxFLS-Homepage. South-southeastern Mexico: Oaxaca, Veracruz, Yucatan; Central Mexico: Federal District of Mexico, State of Mexico, Morelos, Puebla; Central northeast Mexico: Coahuila, Durango, Nuevo Leon; Central western Mexico: Guanajuato, Jalisco, Michoacan; Northwest Mexico: Baja California Sur, Sinaloa, Sonora.
5
Table I: Summary statistics for males and females with and without diabetes
Males Females
Mean Mean p-value Mean Mean p-value Diabetes No diabetes (t-test) Diabetes No diabetes (t-test)
Employed 0.702 0.803 0.000 0.230 0.312 0.000
Age 50.429 35.572 0.000 49.612 35.214 0.000
Age 15–24 0.010 0.274 0.000 0.030 0.267 0.000 Age 25–34 0.045 0.235 0.000 0.067 0.249 0.000 Age 35–44 0.180 0.205 0.301 0.171 0.225 0.004 Age 45–54 0.388 0.169 0.000 0.365 0.163 0.000 Age 55–64 0.377 0.117 0.000 0.367 0.095 0.000
Rural 0.336 0.404 0.021 0.375 0.404 0.182
Small city 0.090 0.127 0.064 0.148 0.121 0.062
City 0.156 0.103 0.004 0.106 0.100 0.625
Big city 0.419 0.366 0.071 0.371 0.375 0.831
Southsoutheast 0.211 0.200 0.659 0.196 0.203 0.703
Central 0.232 0.180 0.025 0.213 0.189 0.176
Westcentral 0.163 0.215 0.034 0.200 0.215 0.395 Northeastcentral 0.208 0.181 0.260 0.213 0.188 0.160 Northwest 0.187 0.224 0.142 0.179 0.205 0.151 No education 0.097 0.068 0.055 0.163 0.086 0.000
Primary 0.516 0.362 0.000 0.614 0.380 0.000
Secondary 0.242 0.303 0.027 0.160 0.308 0.000 Highschool 0.048 0.152 0.000 0.038 0.133 0.000 College or university 0.097 0.115 0.350 0.025 0.093 0.000 Indigenous 0.125 0.120 0.821 0.129 0.117 0.414
Married 0.789 0.540 0.000 0.656 0.538 0.000
Children (under 15) 1.104 1.482 0.000 1.165 1.586 0.000
Wealth 8.003 7.420 0.004 7.060 7.267 0.176
Diabetes 1.000 0.000 . 1.000 0.000 .
Diabetes father 0.170 0.064 0.000 0.127 0.073 0.000 Diabetes mother 0.235 0.099 0.000 0.217 0.104 0.000 Education parents 0.598 0.692 0.001 0.514 0.693 0.000
BMI 28.419 26.401 0.000 29.670 27.502 0.000
N 289 6850 526 8821
Observations reduced for BMI (diabetes (m): 248, no diabetes (m): 5646, diabetes (f): 427, no diabetes (f): 7831) and parental education (diabetes (m): 256, no diabetes (m): 6100, diabetes (f): 455, no diabetes (f): 7901).
chances; a household wealth indicator6
to proxy the effects of the socioeconomic status on employment and a variable capturing the number of children residing in the household below the age of 15, to control for their impact on employment chances and for the effect of childbearing and related gestational diabetes on the probabilities of developing type 2 diabetes (Bellamy et al., 2009). The error term is denoted as ui. We do not control
for the general health status and other diabetes related chronic diseases as they are likely determined by diabetes itself and, hence, could bias the estimates and compromise a causal interpretation of the effect of diabetes on employment (Angrist and Pischke, 2008).
As diabetes could be endogenous the probit model might deliver biased estimates. There-fore we employ an IV strategy, using a bivariate probit model to estimate the following two equations simultaneously:
Diabetesi =δ0+δ1Xi+δ2diabetesmotheri+δ3diabetesf atheri+ηi; (2)
Employedi =β0+β1Diabetesi+β2Xi+ui. (3)
In equation 2,Diabetesi is a dummy variable and is modelled as a function of the same
so-cioeconomic and demographic factorsXi as in equation 1 and of the instrumental dummy
variablesdiabetesmotheri anddiabetesf atheri, indicating if the father or the mother had
been diagnosed with diabetes. The error term is denoted asηi. Equation 3 is identical to
the probit specification (equation 1) and estimates the effect of diabetes on employment, now taking into account the possible endogeneity of diabetes. Diabetes is exogenous if the error terms of both equations are independent of each other (Cov(uiηi) = 0). If ui
and ηi are correlated, the estimation of equation 1 using a probit model will not provide
consistent estimates of the impact of diabetes on employment. In this case the simulta-neous estimation of both equations using the bivariate probit should be preferred. For the estimation of the bivariate probit model it is assumed that ui and ηi are distributed
randomly and bivariate normal. To test the assumption of normality, we use Murphey’s goodness-of-fit score test as suggested by Chiburis et al. (2012).7
We choose the bivariate probit model over the linear IV model to account for endogeneity, as there is evidence that it performs better if the sample is relatively small (<5,000) and — more important in our case — when treatment probabilities are low. In such cases the linear IV can produce uninformative estimates while the bivariate probit model has been shown to provide much more reasonable results (Chiburis et al., 2012). Because only 3.7 percent of males and 5.1 percent of females report a diagnosis of diabetes, treatment
6
To proxy for household wealth we constructed a simple measure based on a list of household assets, close to the approach used by Morris et al. (2000). It consists of owning a vehicle, owning a house or other real estate, owning another house, owning a washing machine, dryer, stove, refrigerator or furniture, owning any electric appliances, owning any domestic appliances, and if the household owns a bicycle. Each indicator for an asset was multiplied by its respective weight determined by the proportion of households in the survey that reported to possess the item, and then summed up for each household. Thus, items that were possessed relatively rarely (e.g. an additional house or a car) received more weight than more common items.
7
probabilities are indeed low in the given case, providing good justification for the use of the bivariate probit model.
In order to fulfil the conditions of a valid instrument, parental diabetes needs to impact the diabetes risk of the offspring while at the same time being unrelated to the offspring’s employment chances. It has been shown that there is a strong hereditary component of type 2 diabetes which predisposes the offspring of people with diabetes to develop the condition as well (Herder and Roden, 2011; The Interact Consortium, 2013). This is supported by the notion that genes seem to play a crucial role in explaining Mexico’s high diabetes prevalence according to a recent study by Williams et al. (2014). The authors identified a specific gene particularly prevalent in Mexican and other Latin American populations with native American ancestry, which is associated with a 20 percent increase in the risk of developing type 2 diabetes. Furthermore, research has shown that parental lifestyle factors, socioeconomic background as well as parental body mass index (BMI) can explain but a very small fraction of the increased risk of type 2 diabetes in the offspring, which is why we assume that the increased risk is mainly due to genetic factors unrelated to lifestyle (Herder and Roden, 2011; The Interact Consortium, 2013). This is supported by Hemminki et al. (2010), who find that adoptees whose biological parents had type 2 diabetes, had an increased risk of developing type 2 diabetes even though they were living in a different household, while if their adopted parents had the disease, they had no elevated risk.
Nonetheless, there might still be the chance that parental diabetes decreases the offspring’s employment chances. The additional financial burden of diabetes or an early death due to diabetes could have prevented the parents from investing in their children’s education the way they would have liked to or could have led to the child dropping out of school in order to support the family. However, controlling for education — and hence, human capital — should account for these effects if they exist. Therefore parental diabetes should be a valid instrument which predicts diabetes while not affecting employment probabilities through other unobserved pathways. To further improve instrument validity we also specify models accounting for the possibility that parental education simultaneously affects the parental diabetes status as well as their children’s employment chances, by including a dummy variable indicating if any of the parents had attained more than primary education. A possible limitation of our instrument is that parental diabetes might directly affect the offspring’s employment decision through other pathways than education. Conceivably, diabetes might deteriorate parental health in such a way that the offspring has to give up its own employment in order to care for its parents or is forced to take up work to financially provide for the parents. With the data at hand we are unable to account for this, but if this effect exists it should be picked up by the overidentification test.
4
Results
This section presents the estimation results using 1) a probit model model that assumes diabetes to be exogenous and 2) IV models with parental diabetes as an instrument for diabetes, to determine if diabetes is endogenous or if instead the results from the probit model can be used. We will further investigate if the inclusion of parental education has an effect on our IV estimates.
4.1
Probit results
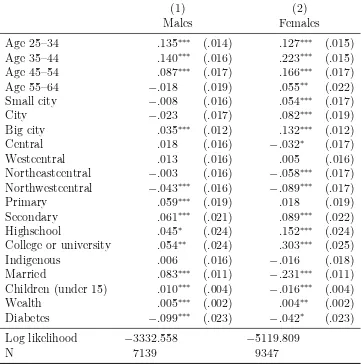
[image:14.612.135.496.298.662.2]Table II indicates that the effect of diabetes is negative for both sexes. For males, it reduces the probability of being employed by almost 10 percent (p<0.01). For females,
Table II: Impact of diabetes on employment probabilities (probit)
(1) (2)
Males Females
Age 25–34 .135∗∗∗ (.014) .127∗∗∗ (.015)
Age 35–44 .140∗∗∗ (.016) .223∗∗∗ (.015)
Age 45–54 .087∗∗∗ (.017) .166∗∗∗ (.017)
Age 55–64 −.018 (.019) .055∗∗ (.022)
Small city −.008 (.016) .054∗∗∗ (.017)
City −.023 (.017) .082∗∗∗ (.019)
Big city .035∗∗∗ (.012) .132∗∗∗ (.012)
Central .018 (.016) −.032∗ (.017)
Westcentral .013 (.016) .005 (.016) Northeastcentral −.003 (.016) −.058∗∗∗ (.017)
Northwestcentral −.043∗∗∗ (.016) −.089∗∗∗ (.017)
Primary .059∗∗∗ (.019) .018 (.019)
Secondary .061∗∗∗ (.021) .089∗∗∗ (.022)
Highschool .045∗ (.024) .152∗∗∗ (.024)
College or university .054∗∗ (.024) .303∗∗∗ (.025)
Indigenous .006 (.016) −.016 (.018)
Married .083∗∗∗ (.011)
−.231∗∗∗ (.011)
Children (under 15) .010∗∗∗ (.004)
−.016∗∗∗ (.004)
Wealth .005∗∗∗ (.002) .004∗∗ (.002)
Diabetes −.099∗∗∗ (.023) −.042∗ (.023)
Log likelihood −3332.558 −5119.809
N 7139 9347
Marginal effects; Robust standard errors in parentheses.
Reference categories for age groups, size of town, regions and education are Age 15–24, Rural, South Mexico and No education, respectively.
the effect is also negative but smaller, and shows a reduction in employment probabilities of about 4.2 percent (p<0.1).
The other covariates largely show the expected relationships. Employability increases with age and is highest for the 35–44 years age group. Especially for women, living in a more urban environment increases employment chances compared to women living in rural areas. Also, women seem to benefit substantially from higher education in terms of employment chances. For men the effects of education are also positive, though, not as marked as for women. Perhaps surprisingly, being part of an indigenous population does not affect employment probabilities, neither for males or females.
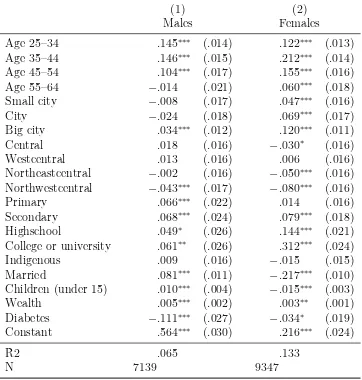
Due to the possibility of non-normally distributed errors and therefore biased estimates of the probit model, we additionally estimate the LPM. The results do, however, not change materially (see Table AI in the appendix).
Both the probit and the LPM results suggest a significant negative effect of diabetes on the employment probabilities of males and likely also females in Mexico. In light of the concern that diabetes could be endogenous the following section presents the results of the IV estimations.
4.2
IV results
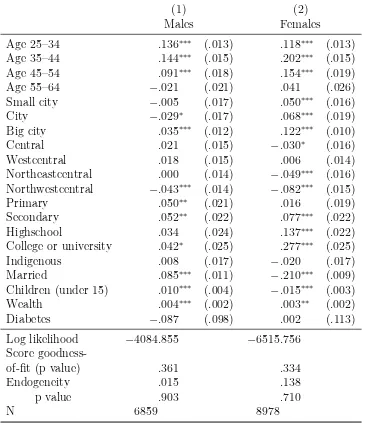
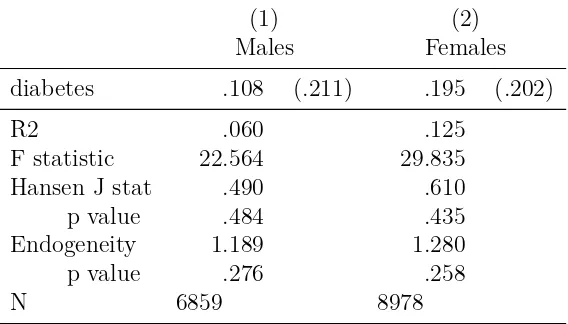
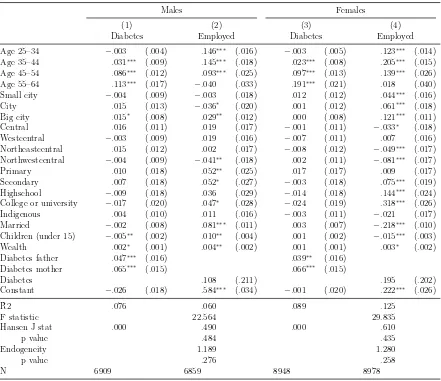
Using the bivariate probit model, the coefficient for males decreases somewhat but remains negative while for females it now is very close to zero. However, standard errors increase in both models and the results turn insignificant (see Table III). The likelihood-ratio test does not reject the null hypothesis of no correlation between the disturbance terms of equations 2 and 3 for males and females, suggesting exogeneity of diabetes. The test for normality of the error term does not reject normality for the male and the female model, increasing our confidence in the estimates. Nonetheless we consider the results of the linear IV model: the test statistics indicate sufficiently strong and valid instruments, as shown by the F statistic and Hansen J statistic for overidentification, respectively. The coefficients of the linear IV model are very different from the bivariate probit model, turning positive for males and females, but also very imprecise as indicated by the large standard errors (see Table IV). As mentioned before, Chiburis et al. (2012) show that the estimates of the linear IV model are likely to be imprecise when low treatment probabilities exist and can differ substantially from the bivariate probit model, which seems to be the case here.8 Since the linear IV models fail to reject exogeneity of diabetes as well, we are confident that the probit model provides unbiased and efficient estimates of the effect of diabetes on employment chances in Mexico and should therefore be used for inference.
8
Table III: Impact of diabetes on employment probabilities (bivariate probit)
(1) (2)
Males Females
Age 25–34 .136∗∗∗ (.013) .118∗∗∗ (.013)
Age 35–44 .144∗∗∗ (.015) .202∗∗∗ (.015)
Age 45–54 .091∗∗∗ (.018) .154∗∗∗ (.019)
Age 55–64 −.021 (.021) .041 (.026)
Small city −.005 (.017) .050∗∗∗ (.016)
City −.029∗ (.017) .068∗∗∗ (.019)
Big city .035∗∗∗ (.012) .122∗∗∗ (.010)
Central .021 (.015) −.030∗ (.016)
Westcentral .018 (.015) .006 (.014) Northeastcentral .000 (.014) −.049∗∗∗ (.016)
Northwestcentral −.043∗∗∗ (.014) −.082∗∗∗ (.015)
Primary .050∗∗ (.021) .016 (.019)
Secondary .052∗∗ (.022) .077∗∗∗ (.022)
Highschool .034 (.024) .137∗∗∗ (.022)
College or university .042∗ (.025) .277∗∗∗ (.025)
Indigenous .008 (.017) −.020 (.017)
Married .085∗∗∗ (.011)
−.210∗∗∗ (.009)
Children (under 15) .010∗∗∗ (.004)
−.015∗∗∗ (.003)
Wealth .004∗∗∗ (.002) .003∗∗ (.002)
Diabetes −.087 (.098) .002 (.113)
Log likelihood −4084.855 −6515.756
Score
goodness-of-fit (p value) .361 .334
Endogeneity .015 .138
p value .903 .710
N 6859 8978
Marginal effects; Robust standard errors in parentheses.
Reference categories for age groups, size of town, regions and education are Age 15–24, Rural, South Mexico and No education, respectively.
* p < 0.1, ** p < 0.05, *** p < 0.01
Table IV: Impact of diabetes on employment probabilities (linear IV)
(1) (2)
Males Females
diabetes .108 (.211) .195 (.202)
R2 .060 .125
F statistic 22.564 29.835 Hansen J stat .490 .610 p value .484 .435 Endogeneity 1.189 1.280 p value .276 .258
N 6859 8978
Robust standard errors in parentheses.
Intruments: diabetes of mother, diabetes of father Models include covariates as explained in section 3.2. ∗ p <0.1,∗∗ p <0.05,∗∗∗ p <0.01
4.3
Differences by age groups
When divided into an older and younger age group the negative effect of diabetes is mainly found in the older age group, for males and females alike (see Table V). The probability of being employed is reduced by 11 percent for men between 45 and 64 years at the one percent significance level, while there is no significant effect on younger men. For women, the employment probability is reduced by about 6 percent, with the effect being significant at the five percent significance level. Similar to men, there is no effect of diabetes on younger women. The LPMs show similar results (see Table AII in the appendix).
4.4
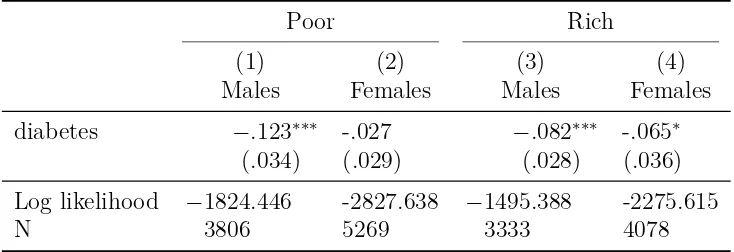
Differences by wealth
To explore the heterogeneity of the effect of diabetes on employment across different levels of wealth, we divide the sample into two wealth groups at the 50th
Table V: Impact of diabetes on employment probabilities by age group (probit)
15-44 45-64
(1) (2) (3) (4)
Males Females Males Females
diabetes −.066 -.003 −.111∗∗∗ -.053∗∗
(.045) (.042) (.028) (.025)
Log likelihood −2217.548 -3718.561 −1091.951 -1382.580
N 4958 6682 2181 2665
Marginal effects; Robust standard errors in parentheses. Models include covariates as explained in section 3.2. * p < 0.1, ** p < 0.05, *** p < 0.01
Table VI: Impact of diabetes on employment probabilities by wealth group (probit)
Poor Rich
(1) (2) (3) (4)
Males Females Males Females
diabetes −.123∗∗∗ -.027 −.082∗∗∗ -.065∗
(.034) (.029) (.028) (.036)
Log likelihood −1824.446 -2827.638 −1495.388 -2275.615
N 3806 5269 3333 4078
Marginal effects; Robust standard errors in parentheses. Models include covariates as explained in section 3.2. * p < 0.1, ** p < 0.05, *** p < 0.01
4.5
Robustness checks
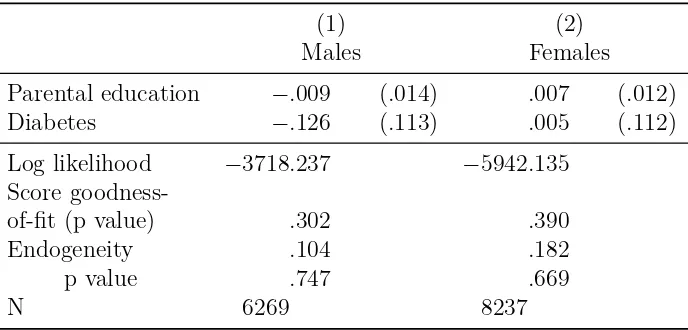
We further estimate the IV models including parental education as a control variable by using a dummy indicating if at least one of the parents has received more than primary education. As explained above, there could be the risk that the used instruments are not valid if they are correlated with an omitted variable such as parental education. The regression results, however, do not provide evidence for this hypothesis as we do not observe important changes in the qualitative interpretation compared to the models excluding parental education (see Tables CI and CII in the appendix) .
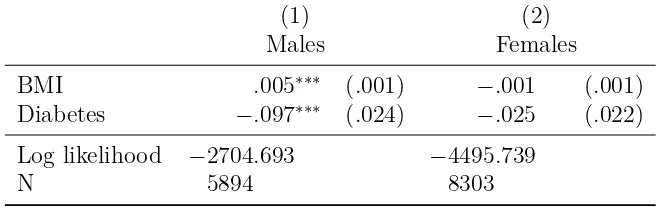
[image:18.612.128.495.345.471.2]diabetes, we estimate a model including BMI as one of the control variables (see Table CIII in the appendix). We find a higher BMI to be positively associated with male employment chances, possibly reflecting a form of reverse causality due to changes in lifestyle, stress or activity resulting from employment and higher income (Dinsa et al., 2012). For females, we find a small negative, but statistically insignificant relationship. Furthermore, only slight changes are observed in the diabetes coefficients, particularly for males. While for males diabetes remains highly significant, this is not the case for females. Because the sample is reduced by about 1000 observations for each gender due to missing BMI measurements, we test if the observed changes are due to the inclusion of BMI as an additional control or due to the reduction in sample size. The results show that the changes appear in the reduced sample regardless of the inclusion of BMI, indicating that BMI does not affect the diabetes coefficient itself.9
We therefore decided to exclude BMI from our preferred model.10
5
Conclusion
The contribution of this paper has been to analyse — for the first time for a LMIC — the impact of diabetes on employment in Mexico, taking into account the potential endogeneity in the relationship between diabetes and employment chances. The presented results add to the growing literature on the adverse economic effects of diabetes. They indicate that having diabetes substantially reduces the chances to work for men and likely also for women. Hence, diabetes may contribute to a reduction in the pool of the productive workforce available to the Mexican economy.
We also show that diabetes reduces employment chances particularly in older people, likely because in this age group people are more common to already have developed diabetes-related complications which limit their productivity and eventually force them into un-employment. Further, for men the effects of diabetes on employment chances seem to be particularly strong when they belong to the poorer half of the population. While there might be some self-selection into the poorer group by those who lost their job due to diabetes and as a result descended into the lower wealth group, this finding is indicative of potentially substantial adverse equity impacts.
In contrast to parts of the earlier literature diabetes was not found to be endogenous neither for males or females — independently of the inclusion of parental education — allowing the use of the more efficient probit model to arrive at a consistent estimate of the effect of diabetes on employment chances. Taking our results for the older age group and comparing them to those of Brown et al. (2005) for the US, whose sample of Mexican Americans 45 years and older might be the best suited for a meaningful comparison, our findings indicate a stronger negative impact of diabetes on males and particularly
9
Results available on request.
10
females residing in Mexico.11
This finding lends some support to our hypothesis that the adverse impact of diabetes on employment could be stronger in LMICs than in high-income countries.
A limitation of this study is the use of cross-sectional data, which does not allow for the use of fixed effects and hence for the control of unobserved time-invariant heterogeneity. Data spanning a longer time period of 10 to 15 years would be required to be able to observe changes in the diabetes and employment status which would allow the use of fixed effects. A further limitation is the somewhat old data from 2005 and the fact that the data only provided self-reported information on diabetes. The latter might have caused some attenuation bias in our estimated parameters, making them rather conservative (Lewbel, 2007). We nonetheless deliberately chose this particular data as it provided us with a sensible instrument in parental diabetes as well as an array of other socioeconomic information which — as far as we have been able to ascertain — is not provided by any other dataset in LMICs.
Looking ahead, it would evidently be worthwhile to investigate the effects of diabetes on employment in Mexico using more recent data. In light of the recently completed implementation of the public health insurance scheme called Seguro Popular — which increased its coverage from about 10 million people in 2005 to over 50 million in 2012 and now provides almost all previously uninsured Mexicans with access to healthcare (Knaul et al., 2012) — the results of this paper might be used as a baseline to judge its success in reducing the adverse effects of diabetes on employment. In addition, the reasons for the differences between males and females in the estimated effects remain a matter of speculation and more research is needed to explore the underlying pathways. This information would be valuable in the design of more effective measures to reduce the negative effects of diabetes for both males and females.
In conclusion, this paper shows that diabetes represents a large burden for people in Mexico and likely in other LMICs, not only due to the associated disease and medical cost burden but also because of its effect on employment chances. This is particularly a problem for the poor who are more adversely affected by diabetes than the more affluent. Accordingly, for a country like Mexico, which continues to be characterized by high poverty rates, the diabetes epidemic may impose an even larger economic and social burden than in high-income countries. To alleviate some of these negative effects of diabetes Seguro Popular may provide an opportunity to further improve the prevention and treatment of diabetes in the poor, especially if the health system adapts to the challenges presented by chronic diseases (Samb et al., 2010). Evidence of possible cost-effective interventions for secondary prevention in the context of Seguro Popular already exists (Salomon et al., 2012). There remains, however, an evidence gap on cost-effective strategies for the primary prevention of diabetes.
11
Appendix
[image:21.612.135.497.192.572.2]A
Linear probability models
Table AI: Impact of diabetes on employment probabilities (linear probability model)
(1) (2)
Males Females
Age 25–34 .145∗∗∗ (.014) .122∗∗∗ (.013)
Age 35–44 .146∗∗∗ (.015) .212∗∗∗ (.014)
Age 45–54 .104∗∗∗ (.017) .155∗∗∗ (.016)
Age 55–64 −.014 (.021) .060∗∗∗ (.018)
Small city −.008 (.017) .047∗∗∗ (.016)
City −.024 (.018) .069∗∗∗ (.017)
Big city .034∗∗∗ (.012) .120∗∗∗ (.011)
Central .018 (.016) −.030∗ (.016)
Westcentral .013 (.016) .006 (.016) Northeastcentral −.002 (.016) −.050∗∗∗ (.016)
Northwestcentral −.043∗∗∗ (.017) −.080∗∗∗ (.016)
Primary .066∗∗∗ (.022) .014 (.016)
Secondary .068∗∗∗ (.024) .079∗∗∗ (.018)
Highschool .049∗ (.026) .144∗∗∗ (.021)
College or university .061∗∗ (.026) .312∗∗∗ (.024)
Indigenous .009 (.016) −.015 (.015)
Married .081∗∗∗ (.011)
−.217∗∗∗ (.010)
Children (under 15) .010∗∗∗ (.004)
−.015∗∗∗ (.003)
Wealth .005∗∗∗ (.002) .003∗∗ (.001)
Diabetes −.111∗∗∗ (.027) −.034∗ (.019)
Constant .564∗∗∗ (.030) .216∗∗∗ (.024)
R2 .065 .133
N 7139 9347
Robust standard errors in parentheses.
Reference categories for age groups, size of town, regions and education are Age 15–24, Rural, South Mexico and No education, respectively.
Table AII: Impact of diabetes on employment probabilities by age group (linear probability model)
15-44 45-64
(1) (2) (3) (4)
Males Females Males Females
Diabetes −.060 (.045) −.004 (.037) −.124∗∗∗ (.033) −.048∗∗ (.022)
R2 .077 .138 .049 .115
N 4958 6682 2181 2665
Robust standard errors in parentheses.
Models include covariates as explained in section 3.2. ∗p <0.1,∗∗ p <0.05,∗∗∗ p <0.01
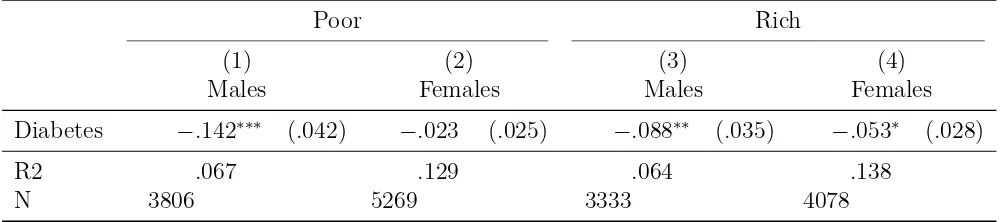
Table AIII: Impact of diabetes on employment probabilities by wealth group (linear prob-ability model)
Poor Rich
(1) (2) (3) (4)
Males Females Males Females
Diabetes −.142∗∗∗ (.042) −.023 (.025) −.088∗∗ (.035) −.053∗ (.028)
R2 .067 .129 .064 .138
N 3806 5269 3333 4078
Robust standard errors in parentheses.
[image:22.612.84.584.508.619.2]B
Linear IV estimates (1st and 2nd stage)
Table BI: Impact of diabetes on employment probabilities (linear IV, 1st and 2nd stage)
Males Females
(1) (2) (3) (4)
Diabetes Employed Diabetes Employed
Age 25–34 −.003 (.004) .146∗∗∗ (.016) −.003 (.005) .123∗∗∗ (.014)
Age 35–44 .031∗∗∗ (.009) .145∗∗∗ (.018) .023∗∗∗ (.008) .205∗∗∗ (.015)
Age 45–54 .086∗∗∗ (.012) .093∗∗∗ (.025) .097∗∗∗ (.013) .139∗∗∗ (.026)
Age 55–64 .113∗∗∗ (.017)
−.040 (.033) .191∗∗∗ (.021) .018 (.040)
Small city −.004 (.009) −.003 (.018) .012 (.012) .044∗∗∗ (.016)
City .015 (.013) −.036∗ (.020) .001 (.012) .061∗∗∗ (.018)
Big city .015∗ (.008) .029∗∗ (.012) .000 (.008) .121∗∗∗ (.011)
Central .016 (.011) .019 (.017) −.001 (.011) −.033∗ (.018)
Westcentral −.003 (.009) .019 (.016) −.007 (.011) .007 (.016)
Northeastcentral .015 (.012) .002 (.017) −.008 (.012) −.049∗∗∗ (.017)
Northwestcentral −.004 (.009) −.041∗∗ (.018) .002 (.011) −.081∗∗∗ (.017)
Primary .010 (.018) .052∗∗ (.025) .017 (.017) .009 (.017)
Secondary .007 (.018) .052∗ (.027)
−.003 (.018) .075∗∗∗ (.019)
Highschool −.009 (.018) .036 (.029) −.014 (.018) .144∗∗∗ (.024)
College or university −.017 (.020) .047∗ (.028) −.024 (.019) .318∗∗∗ (.026)
Indigenous .004 (.010) .011 (.016) −.003 (.011) −.021 (.017)
Married −.002 (.008) .081∗∗∗ (.011) .003 (.007) −.218∗∗∗ (.010)
Children (under 15) −.005∗∗ (.002) .010∗∗ (.004) .001 (.002) −.015∗∗∗ (.003)
Wealth .002∗ (.001) .004∗∗ (.002) .001 (.001) .003∗ (.002)
Diabetes father .047∗∗∗ (.016) .039∗∗ (.016)
Diabetes mother .065∗∗∗ (.015) .066∗∗∗ (.015)
Diabetes .108 (.211) .195 (.202)
Constant −.026 (.018) .584∗∗∗ (.034) −.001 (.020) .222∗∗∗ (.026)
R2 .076 .060 .089 .125
F statistic 22.564 29.835
Hansen J stat .000 .490 .000 .610
p value .484 .435
Endogeneity 1.189 1.280
p value .276 .258
N 6909 6859 8948 8978
Robust standard errors in parentheses.
Reference categories for age groups, size of town, regions and education are Age 15–24, Rural, South Mexico and No education, respectively.
C
Robustness checks
Table CI: Impact of diabetes on employment probabilities including parental education (bivariate probit)
(1) (2)
Males Females
Parental education −.009 (.014) .007 (.012)
Diabetes −.126 (.113) .005 (.112)
Log likelihood −3718.237 −5942.135
Score
goodness-of-fit (p value) .302 .390
Endogeneity .104 .182
p value .747 .669
N 6269 8237
Table CII: Impact of diabetes on employment probabilities including parental education (linear IV, 2nd stage)
(1) (2)
Males Females
Parental education −.013 (.014) .005 (.012)
Diabetes .093 (.237) .264 (.207)
R2 .069 .116
F statistic 19.553 27.891 Hansen J stat .390 .245
p value .532 .620
Endogeneity .794 2.100
p value .373 .147
N 6269 8237
Robust standard errors in parentheses.
[image:25.612.146.479.523.628.2]Models include covariates as explained in section 3.2. ∗ p <0.1,∗∗ p <0.05,∗∗∗ p <0.01
Table CIII: Impact of diabetes on employment probabilities including BMI (probit)
(1) (2)
Males Females
BMI .005∗∗∗ (.001)
−.001 (.001)
Diabetes −.097∗∗∗ (.024) −.025 (.022)
Log likelihood −2704.693 −4495.739
N 5894 8303
Marginal effects; Robust standard errors in parentheses.
References
Agardh, E., Allebeck, P., Hallqvist, J., Moradi, T., Sidorchuk, A., 2011. Type 2 diabetes incidence and socio-economic position: a systematic review and meta-analysis. Interna-tional journal of epidemiology 40 (3), 804–18.
Aguila, E., Diaz, C., Fu, M. M., Kapteyn, A., Pierson, A., 2011. Living longer in Mexico: Income security and health. RAND Corporation.
Angrist, J., Pischke, J., 2008. Mostly Harmless Econometrics: An Empiricist’s Companion. Princeton University Press.
Arredondo, A., De Icaza, E., 2011. The cost of diabetes in Latin America: evidence from Mexico. Value in health: the journal of the International Society for Pharmacoeconomics and Outcomes Research 14 (5 Suppl 1), S85–8.
Barquera, S., Campos-Nonato, I., Aguilar-Salinas, C., Lopez-Ridaura, R., Arredondo, A., Rivera-Dommarco, J., 2013. Diabetes in Mexico: cost and management of diabetes and its complications and challenges for health policy. Globalization and health 9 (1), 3.
Barquera, S., Hernandez-Barrera, L., Tolentino, M. L., Espinosa, J., Ng, S. W., Rivera, J. A., Popkin, B. M., 2008. Energy intake from beverages is increasing among Mexican adolescents and adults. The Journal of nutrition 138 (12), 2454–61.
Bastida, E., Pagán, J. A., 2002. The impact of diabetes on adult employment and earnings of Mexican Americans: findings from a community based study. Health economics 11 (5), 403–13.
Basu, S., Yoffe, P., Hills, N., Lustig, R. H., 2013. The relationship of sugar to population-level diabetes prevalence: an econometric analysis of repeated cross-sectional data. PloS one 8 (2), e57873.
Bellamy, L., Casas, J.-P., Hingorani, A. D., Williams, D., 2009. Type 2 diabetes mellitus after gestational diabetes: a systematic review and meta-analysis. Lancet 373 (9677), 1773–9.
Brown, H. S., Pagán, J. A., Bastida, E., 2005. The impact of diabetes on employment: genetic IVs in a bivariate probit. Health economics 14 (5), 537–44.
Chiburis, R. C., Das, J., Lokshin, M., 2012. A practical comparison of the bivariate probit and linear IV estimators. Economics Letters 117 (3), 762–766.
Hemminki, K., Li, X., Sundquist, K., Sundquist, J., 2010. Familial risks for type 2 diabetes in Sweden. Diabetes care 33 (2), 293–7.
Herder, C., Roden, M., 2011. Genetics of type 2 diabetes: pathophysiologic and clinical relevance. European journal of clinical investigation 41 (6), 679–92.
Hu, F. B., 2011. Globalization of diabetes: the role of diet, lifestyle, and genes. Diabetes care 34 (6), 1249–57.
International Diabetes Federation, 2013. Diabetes Atlas, 6th Edition. International Dia-betes Federation.
Knaul, F. M., González-Pier, E., Gómez-Dantés, O., García-Junco, D., Arreola-Ornelas, H., Barraza-Lloréns, M., Sandoval, R., Caballero, F., Hernández-Avila, M., Juan, M., Kershenobich, D., Nigenda, G., Ruelas, E., Sepúlveda, J., Tapia, R., Soberón, G., Cher-torivski, S., Frenk, J., 2012. The quest for universal health coverage: achieving social protection for all in Mexico. Lancet 380 (9849), 1259–79.
Latif, E., 2009. The impact of diabetes on employment in Canada. Health economics 18 (5), 577–89.
Lewbel, A., 2007. Estimation of Average Treatment Effects with Misclassification. Econo-metrica 75 (2), 537–551.
Lin, S., 2011. Estimating the impact of diabetes on employment in Taiwan. Economics Bulletin 31 (4), 3089–3102.
Minor, T., 2011. The effect of diabetes on female labor force decisions: new evidence from the National Health Interview Survey. Health economics 20 (12), 1468–86.
Morris, S. S., Carletto, C., Hoddinott, J., Christiaensen, L. J., May 2000. Validity of rapid estimates of household wealth and income for health surveys in rural Africa. Journal of epidemiology and community health 54 (5), 381–7.
Rubalcava, L., Teruel, G., 2008. User’s Guide for the Mexican Family Life Survey Second Wave.
Salomon, J. a., Carvalho, N., Gutierrez-Delgado, C., Orozco, R., Mancuso, A., Hogan, D. R., Lee, D., Murakami, Y., Sridharan, L., Medina-Mora, M. E., Gonzalez-Pier, E., 2012. Intervention strategies to reduce the burden of non-communicable diseases in Mexico: cost effectiveness analysis. BMJ 344, e355.
Samb, B., Desai, N., Nishtar, S., Mendis, S., Bekedam, H., Wright, A., Hsu, J., Martiniuk, A., Celletti, F., Patel, K., Adshead, F., McKee, M., Evans, T., Alwan, A., Etienne, C., 2010. Prevention and management of chronic disease: a litmus test for health-systems strengthening in low-income and middle-income countries. Lancet 376 (9754), 1785–97.
Stevens, G., Dias, R. H., Thomas, K. J. A., Rivera, J. A., Carvalho, N., Barquera, S., Hill, K., Ezzati, M., 2008. Characterizing the epidemiological transition in Mexico: national and subnational burden of diseases, injuries, and risk factors. PLoS medicine 5 (6), e125.
The Interact Consortium, 2013. The link between family history and risk of type 2 diabetes is not explained by anthropometric, lifestyle or genetic risk factors: the EPIC-InterAct study. Diabetologia 56 (1), 60–9.
Vijan, S., Hayward, R. A., Langa, K. M., 2004. The impact of diabetes on workforce participation: results from a national household sample. Health services research 39 (6 Pt 1), 1653–69.
Villalpando, S., de la Cruz, V., Rojas, R., Shamah-Levy, T., Avila, M. A., Gaona, B., Re-bollar, R., Hernández, L., 2010. Prevalence and distribution of type 2 diabetes mellitus in Mexican adult population: a probabilistic survey. Salud pública de México 52 Suppl 1 (1), S19–26.
Williams, A. L., Jacobs, S. B. R., Moreno-Macías, H., Huerta-Chagoya, A., Churchhouse, C., Márquez-Luna, C., García-Ortíz, H., Gómez-Vázquez, M. J., Burtt, N. P., Aguilar-Salinas, C. a., González-Villalpando, C., Florez, J. C., Orozco, L., Haiman, C. a., Tusié-Luna, T., Altshuler, D., 2014. Sequence variants in SLC16A11 are a common risk factor for type 2 diabetes in Mexico. Nature 506 (7486), 97–101.
Yach, D., Stuckler, D., Brownell, K. D., 2006. Epidemiologic and economic consequences of the global epidemics of obesity and diabetes. Nature medicine 12 (1), 62–6.
Yu, C. H. Y., Zinman, B., 2007. Type 2 diabetes and impaired glucose tolerance in abo-riginal populations: a global perspective. Diabetes research and clinical practice 78 (2), 159–70.