non alcoholic fatty liver disease
.
White Rose Research Online URL for this paper:
http://eprints.whiterose.ac.uk/81083/
Version: Published Version
Article:
Ahmed, A, Rabbitt, E, Brady, T et al. (10 more authors) (2012) A switch in hepatic cortisol
metabolism across the spectrum of non alcoholic fatty liver disease. PLoS ONE, 7 (2).
ARTN e29531. ISSN 1932-6203
https://doi.org/10.1371/journal.pone.0029531
eprints@whiterose.ac.uk
https://eprints.whiterose.ac.uk/
Reuse
Unless indicated otherwise, fulltext items are protected by copyright with all rights reserved. The copyright
exception in section 29 of the Copyright, Designs and Patents Act 1988 allows the making of a single copy
solely for the purpose of non-commercial research or private study within the limits of fair dealing. The
publisher or other rights-holder may allow further reproduction and re-use of this version - refer to the White
Rose Research Online record for this item. Where records identify the publisher as the copyright holder,
users can verify any specific terms of use on the publisher’s website.
Takedown
If you consider content in White Rose Research Online to be in breach of UK law, please notify us by
Spectrum of Non Alcoholic Fatty Liver Disease
Adeeba Ahmed1, Elizabeth Rabbitt1, Theresa Brady2, Claire Brown2, Peter Guest4, Iwona J. Bujalska1, Craig Doig1, Philip N. Newsome3, Stefan Hubscher5, Elwyn Elias3, David H. Adams3, Jeremy W. Tomlinson1, Paul M. Stewart1*
1Centre for Endocrinology, Diabetes and Metabolism, Institute of Biomedical Research, School of Clinical and Experimental Medicine, University of Birmingham, Birmingham, United Kingdom,2Wellcome Trust Clinical Research Facility, University Hospital Birmingham NHS Foundation Trust, Birmingham, United Kingdom,3Centre for Liver Research and NIHR Biomedical Research Unit in Liver Disease, University Hospital Birmingham NHS Foundation Trust and University of Birmingham, Birmingham, United Kingdom,4Radiology, University Hospital Birmingham NHS Foundation, Trust, Birmingham, United Kingdom,5Pathology, University Hospital Birmingham NHS Foundation Trust and University of Birmingham, Birmingham, United Kingdom
Abstract
Context: Non alcoholic fatty liver disease (NAFLD) is the hepatic manifestation of the metabolic syndrome. NAFLD represents a spectrum of liver disease ranging from reversible hepatic steatosis, to non alcoholic steato-hepatitis (NASH) and cirrhosis. The potential role of glucocorticoids (GC) in the pathogenesis of NAFLD is highlighted in patients with GC excess, Cushing’s syndrome, who develop central adiposity, insulin resistance and in 20% of cases, NAFLD. Although in most cases of NAFLD, circulating cortisol levels are normal, hepatic cortisol availability is controlled by enzymes that regenerate cortisol (F) from inactive cortisone (E) (11b-hydroxysteroid dehydrogenase type 1, 11b-HSD1), or inactivate cortisol through A-ring metabolism (5a- and 5b-reductase, 5aR and 5bR).
Objective and Methods: In vitro studies defined 11b-HSD1 expression in normal and NASH liver samples. We then characterised hepatic cortisol metabolism in 16 patients with histologically proven NAFLD compared to 32 obese controls using gas chromatographic analysis of 24 hour urine collection and plasma cortisol generation profile following oral cortisone.
Results:In patients with steatosis 5aR activity was increased, with a decrease in hepatic 11b-HSD1 activity. Total cortisol metabolites were increased in this group consistent with increased GC production rate. In contrast, in patients with NASH, 11b-HSD1 activity was increased both in comparison to patients with steatosis, and controls. Endorsing these findings, 11b -HSD1 mRNA and immunostaining was markedly increased in NASH patients in peri septal hepatocytes and within CD68 positive macrophages within inflamed cirrhotic septa.
Conclusion:Patients with hepatic steatosis have increased clearance and decreased hepatic regeneration of cortisol and we propose that this may represent a protective mechanism to decrease local GC availability to preserve hepatic metabolic phenotype. With progression to NASH, increased 11b-HSD1 activity and consequent cortisol regeneration may serve to limit hepatic inflammation.
Citation:Ahmed A, Rabbitt E, Brady T, Brown C, Guest P, et al. (2012) A Switch in Hepatic Cortisol Metabolism across the Spectrum of Non Alcoholic Fatty Liver Disease. PLoS ONE 7(2): e29531. doi:10.1371/journal.pone.0029531
Editor:Jean-Marc A. Lobaccaro, Clermont Universite´, France
ReceivedMay 17, 2011;AcceptedNovember 30, 2011;PublishedFebruary 20, 2012
Copyright:ß2012 Ahmed et al. This is an open-access article distributed under the terms of the Creative Commons Attribution License, which permits
unrestricted use, distribution, and reproduction in any medium, provided the original author and source are credited.
Funding:This study was supported by grants from the Wellcome Trust (Programme Grant reference number is 082809/Z/07/Z) (to P.M.S.) Medical Research Council G84/6638 (to A.A.). The funders had no role in the study design, data collection and analysis, decision to publish, or preparation of the manuscript.
Competing Interests:The authors have declared that no competing interests exist. * E-mail: p.m.stewart@bham.ac.uk
Introduction
Non-Alcoholic Fatty Liver Disease (NAFLD) is the hepatic manifestation of the metabolic syndrome and is now acknowl-edged to be the commonest liver problem of the western world, and the leading cause of cryptogenic cirrhosis. NAFLD represents a spectrum of liver disease ranging from simple and reversible hepatic steatosis, to non alcoholic steato-hepatitis (NASH) where there is evidence of inflammation culminating in cirrhosis with liver failure, and hepatocellular carcinoma. It is rapidly becoming the leading indication for liver transplantation. Critically, the
histological diagnosis at presentation predicts prognosis in these patients. Those with simple fatty liver at presentation only have a 2% risk of progressing to end stage cirrhosis in a 20 year period. However when there is evidence of steatohepatitis or fibrosis, the risk of developing cirrhosis is up to 50% in a 2 year period [1]. The pathogenesis of NAFLD is poorly understood but several factors are thought to be important, including insulin resistance, obesity and type 2 diabetes; 90% of patients with NAFLD cirrhosis having obesity and/or diabetes mellitus.
obesity, insulin resistance and impaired glucose tolerance). Indeed, 20% of patients with Cushing’s syndrome have NAFLD [2], and there are a number of reports that implicate pharmacological glucocorticoid (GC) excess in hepatic triglyceride accumulation [3,4]. Glucocorticoids promote steatosis by directly stimulating hepatic de novo lipogenesis and free fatty acid (FFA) utilization [5– 7], and by promoting lipolysis within omental fat, resulting in increased portal FFA delivery to the liver [8]. Cushing’s syndrome is rare and the vast majority of patients with NAFLD have normal circulating cortisol levels. However, local GC concentrations within key metabolic target tissues are controlled at the pre-receptor level through a series of enzymes; 11b-hydroxysteroid dehydrogenase type 1 (11b-HSD1), interconverting hormonally inactive cortisone (E) to active cortisol (F) and, 5a and 5b
reductases (5aR and 5bR) which inactivate cortisol to the dihydro and subsequently tetrahydro metabolites (THF or 5aTHF). Our previous work has shown that in simple obesity, there is a reduction in the generation of serum cortisol from dexamethasone-suppressed values after the administration of oral cortisone reflecting decreased hepatic 11b-HSD1 activity [9]. This comes at a time of interest in the concept of selective 11b-HSD1 inhibition as a novel therapy for patients with the metabolic syndrome – inhibition of hepatic and adipose cortisol regeneration resulting in reduced gluconeogenesis and adipogenesis respectively [10–12].
A number of cross sectional studies have reported the association of NAFLD with chronic, subclinical general activation of the hypothalamo-pituitary-adrenal (HPA) axis in humans [13– 15]. None of these studies however have undertaken a detailed analysis of hepatic pre receptor cortisol metabolism in patients with NAFLD. We propose that dysregulation of hepatic GC metabolism may be critical in the pathogenesis and/or progression of NAFLD with increased regeneration (11b-HSD1) or decreased clearance (5a-reductase) contributing to the hepatic phenotype. We have therefore performed a detailed characterisation (in vivo
andex vivo) of GC metabolism in patients with NAFLD compared
with obese controls.
Materials and Methods
Human Subjects
Clinical studies were carried out on 16 patients recruited from the multidisciplinary NAFLD clinic at University Hospital Birmingham, with chronically elevated liver enzymes and evidence of hepatic steatosis on ultrasound. The diagnosis of NAFLD was made on histological analysis of clinically indicated biopsies after exclusion of other possible etiological factors (alcohol intake of .20 g/day, viral and autoimmune hepatitis and hepatototoxic drugs). 8 patients had hepatic steatosis and 8 had steatohepatitis. Renal function was normal and none were taking any drugs known to interfere with the HPA axis (glucocorticoids, anticon-vulsants, estrogen treatment). Five patients had well controlled type 2 diabetes (2 steatosis patients on low dose metformin, 3 NASH patients – 2 on low dose metformin and one diet controlled). Patients on metformin had stopped medication for 2 days before participating in the study.
32 healthy obese control volunteers (BMI.30 kg/m2) were recruited by local advertisements. All had normal liver function biochemistry (AST,cGT, ALT, ALP and bilirubin).
Separate from the clinical study participants, liver samples were obtained from the liver tissue archive at the Centre for Liver Research, University of Birmingham and were used for in vitro
gene and protein expression studies. These were all snap frozen samples that had been collected during the previous 24 month
period, and stored at 280uC. All diagnoses were verified by histological analysis (NASH n = 5, normal transplant donor liver n = 5).
Clinical Studies
Ethics Statement: The study and protocol received local ethics committee (Solihull research ethics committee) approval and written informed consent was obtained from all participants.
Patients were admitted to the research facility in the fasted state. Resting blood pressure (mmHg) and anthropometric measure-ments were taken (waist and hip circumference, BMI (kg/m2), and sagittal height (cm)). Venous blood samples were taken for fasting serum free fatty acids, liver function tests and other baseline biochemical blood measurements as per standard laboratory procedures.
Patients underwent body composition analysis using dual-energy X-ray absorptiometry (DXA) with a total body scanner (QDR 45OO; Hologic, Bedford, MA). Coefficients of variation (CVs) for multiple scans were,3%. Subcutaneous and visceral abdominal fat distribution was measured using a single 10 mm slice of computed tomography (CT) at the L3 vertebral level and analysed using commercial software (MeVis PULMO 3D 3.11, MeVIS Research GmbH, Bremen, Germany). A three dimen-sional analysis was carried out on the scan from which the fat area was calculated by dividing the volume results by the scan thickness. Total fat area and visceral fat area regions of interest (ROIs) were delineated by manually tracing a contour of each region. Fat pixels and therefore fat area were identified with threshold attenuation values between 250 to 2250 hounsfield units as described previously [16]. The subcutaneous fat area was calculated by subtracting the visceral from total fat area. Data was expressed as 1) total, subcutaneous and visceral fat area, 2) the ratio of visceral to total fat (% visceral fat), 3) the ratio of visceral to subcutaneous fat (V:S ratio). Patients also returned a 24 hour urine collection for steroid metabolite analysis.
On a second day of investigation, patients took 1 mg of dexamethasone orally at 2300h to suppress endogenous cortisol production, and attended the Clinical Research Facility at 0800h the following morning. After baseline 0900h measurements of cortisol and adrenocorticotropic hormone, a further 0.5 mg of dexamethasone and cortisone acetate (25 mg) were given orally. Serum cortisol concentrations were then measured at 20-min intervals for 240 min as previously reported [17].
Biochemical analysis
Blood count, urea, creatinine and electrolytes, cholesterol, triglycerides, liver chemistry, and glucose were measured using standard laboratory methods (Roche Modular system; Roche, Lewes, U.K.). Plasma FFA were analysed on a COBAS BIO semiautomatic analyser (La Roche, Basel, Switzerland) using a NEFA-C Kit (Alpha Laboratories, UK).
Serum cortisol was assayed using a coat-a-count radioimmuno-assay (Diagnostic Products, Los Angeles, CA) as per the manufacturer’s guidelines. The ‘cortisol’ area under the curve generated following cortisone acetate administration was used as an index of hepatic 11b-HSD1 activity as previously described [17].
urinary free F/E (UFF/UFE) ratio, reflecting 11b-HSD2 activity is normal. The 5aTHF/THF was used as a marker of 5a-reductase activity with a high ratio in the setting of increased absolute levels of urinary 5a-THF indicating increased activity.
Real Time PCR
11b-HSD1, Glucocorticoid receptora(GRa), and 5a-reductase 2 (SRD5A2) hepatic mRNA levels were measured by real-time PCR using an ABI 7500 system (Perkin-Elmer, Biosystems, Warrington, UK). PCR was performed in 25ml reactions on
96-well plates. Reactions contained TaqMan universal PCR master mix (Applied Biosystems, Warrington, Cheshire, UK), 900 nmol primers, 100–200 nmol TaqMan probe and 25–50 ng cDNA. All reactions were multiplexed with primers specific for 18S rRNA (provided as a preoptimized mix; Perkin-Elmer, Beaconsfield, Bucks, UK) as an internal reference. All target gene probes were labelled with the fluorescent label FAM, and the 18S probe with the fluorescent label VIC. Reactions were as follows: 50uC for 2 min, 95uC for 10 min, and then 40 cycles of 95uC for 15 s and 60uC for 1 min. Data were analysed according to the manufac-turer’s guidelines and were obtained as Ct values (the cycle number at which logarithmic PCR plots cross a calculated threshold line) and used to determine dCt values (dCt = Ct of the target gene minus Ct of the internal reference, 18S). Probes and primers for all genes were provided by ‘assay on demand’ (Applied Biosystems). Arbitrary units were used with the transformation [AU = 1000*22dCt] to express results obtained.
Immunohistochemistry and Immunofluorescence Five micron thick acetone fixed frozen liver sections with severe NASH and normal donor livers were cut onto coated glass slides. The slides were treated with methanol-hydrogen peroxide 0.1% to block endogenous peroxidase activity for 20 minutes. After washing in phosphate buffered saline (PBS) sections were incubated in 20% normal donkey serum for 30 minutes and then with polyclonal antibody to 11b-HSD1 [20] at a dilution of 1 in 100 in 10% donkey serum for 45 minutes. Secondary antibody, donkey antisheep IgG perox-idase conjugate (1:200), was added to sections for 30 min. Slides were developed using 3,39-diaminobenzidine and were counter-stained with Mayer’s hematoxylin. Immunofluorescence was carried out to detect co-localisation of 11b-HSD1 with the CD68 macrophage marker (purified mouse anti human CD68, BD Pharmingen). 11b-HSD1 primary antibodies were as described above. Alexa Fluor 488 donkey anti sheep IgG and Alexa Flour 546 rabbit anti mouse IgG were used at a dilution of 1:100 and slides were covered in foil for the remainder of the procedure. Slides were mounted in VectaShield hard set mounting medium with DAPI (Vector Labs).
Preparation of Liver Microsomes
Human liver microsomes were prepared from 4 human normal livers and 5 livers with NASH livers by differential centrifugation techniques as described previously [21]. Microsomal fractions were resuspended in a buffer containing 20 mm NaCl, 1 mm MgCl2, 100 mm KCl, 20 mm Mops, pH 7.2, and were snap-frozen under liquid nitrogen. Microsomal protein concentration was determined using the Bio-Rad protein assay with bovine serum albumin as a standard as per the manufacturer’s instructions (Bio-Rad). The integrity of the microsomal mem-branes was assessed by using the mannose-6-phosphatase assay [22], which showed a latency greater than 95% in all preparations.
Immunoblotting
[image:4.612.318.557.315.658.2]SDS-PAGE was performed by the method of Laemmli [23] with 10mg of liver microsomal protein on 11% acrylamide minigels using a Bio-Rad Mini-PROTEAN II apparatus (Bio-Rad). Following electrophoresis, proteins were transferred to Immobilon-P membrane (Millipore Corp., Bedford, MA). Non-specific protein binding was blocked by incubating membranes in 20% nonfat milk, 0.1% Tween 20 in phosphate-buffered saline at 25uC for 1 h. Membranes were then incubated with an in-house raised polyclonal antibody to human 11b-HSD1 at a dilution of 1:1000 for 12 h at 4uC. Following 3610-min washes in phosphate-buffered saline, 0.1% Tween 20, membranes were incubated with secondary antibody (goat anti-sheep IgG peroxidase-conjugate) at a dilution of 1:25,000 for 1 h at room temperature. Bound peroxidase-conjugated IgG was visualized using ECL detection kit (Amersham Biosciences, Buckinghamshire, UK) by exposing membranes to x-ray film (Kodak, France). Membranes were reprobed with anti-beta Actin antibody [mAbcam 8226] (HRP) as a loading Control at 1:20,000.
Table 1.Baseline clinical characteristics of patients with hepatic steatosis, NASH and controls.
Variable
Control
subjects Steatosis NASH
n 32 8 8
age (years) 4762.0 3763.0f 54
62.0
BMI kg/m2 32.4
60.9 37.163.1 36.561.8
waist:hip ratio 0.960.01d 0.96
60.1 1.060.03
sag height (cm) 23.360.6d 22
61f 27.9
61.2
%Fat, 37.461.2a 29.762.8 36.162.5
% visceral fat 37.665.4 43.364.4 51.464.8
V:S ratio 0.660.1 0.8360.2 1.1760.2
Creat (mmol/L) 8963 9664 8964
Total cholesterol (mmol/L) 6.861.4 5.360.7 5.260.4
HDL cholesterol (mmol/L) 1.460.1 1.160.1 1.360.1
Triglycerides (mmol/L) 1.360.1bc 2.5
60.4 2.160.4
ALT (iu/L) 2462bd 93
623 62613
ALP (u/L) 16667 170612 204630
AST (iU/L) 2260.9bd 40
66 5168
cGT (iu/L) 2262bd 68
621 119648
fasting FFA (mmol/L) 328617 431664 413636
fasting glucose (mmol/L) 4.760.1d 4.8
60.2e 6.5
60.7
Systolic blood pressure (mmHg) 13464 13362 13565
Diastolic blood pressure (mmHg) 7663 7765 7963
Cortisol post dex suppression (nmol/L)
2665 1263 2665
Fasting insulin (mU/L) 9.761.8d 1665.1 2767.7
HOMA-IR 2.2160.5d 2.6
61.0 7.462.6
Data are presented as means6SE.
,Whole body fat measured by DXA. CT measured visceral and subcutaneous fat.
acontrols vs steatosis p ,0.05, bcontrols vs steatosis p
,0.01, controls vs NASH p,0.05, dcontrols vs NASH p,0.01,
esteatosis vs NASH p,0.05, fsteatosis vs NASH p
Statistical Analysis
Data are presented as means6 SE unless otherwise stated. Area under the curve (AUC) analysis was performed using the trapezoidal method. For comparison of single variables between
control, steatosis and steatohepatitis groups, one way analysis of variance (ANOVA) was used to identify variables with differences between groups and t tests were used (Mann
[image:5.612.58.448.116.686.2]Whitney test was used where data were not normally
Figure 1. 24 hour urine steroid metabolite analysis from patients with steatosis and steatohepatitis compared with obese controls. (A): 5a-reductase activity as depicted by the urinary 5aTHF/THF ratio (mean6SEM). (B): total 24 Urine 5a-reduced metabolites (mean6SEM) (Andros: androsterone). (C): total 24 hr Urine F metabolites (mean6SEM).
distributed). Analysis was performed using SPSS Statistics 17.0 software.
Results
Clinical and biochemical characteristics of participants We characterised the metabolic phenotype and hepatic cortisol metabolism in patients with histologically proven NAFLD compared to healthy obese control. Compared with the control group, waist:hip ratios and sagittal height were significantly higher in the NASH group. While % visceral fat was also highest in the NASH group this did not achieve significance. Liver transaminases were similar in both steatosis and NASH group and significantly higher than controls. Insulin resistance using the HOMA-IR model was highest in the NASH group. Baseline clinical and biochemical characteristics of both groups are presented in Table 1.
Urinary steroid metabolite analysis
24 h urinary steroid metabolite analysis by GC/MS demon-strated increased cortisol clearance with higher 5aR (reflected by urine 5aTHF/THF and An/Et ratios) in patients with hepatic steatosis only, Figure 1A. 5a-, and not 5b-reduced metabolites were increased in the steatosis group, Figure 1B. Absolute values are presented in Table 2.
In addition, total urine cortisol metabolites were significantly increased in patients with steatosis consistent with increased glucocorticoid production rate, Table 2, Figure 1C. The urinary THF+5aTHF/THE ratio was lower in the steatosis group and elevated in the steatohepatitis group but this did not reach statistical significance. However the cortols/cortolones ratio,
[image:6.612.62.298.426.671.2]which also reflects 11b-HSD1 activity, was significantly reduced in the steatosis group, Table 2, Figure 2A. Importantly the urine UFF/UFE ratio was similar between groups indicating that there was no difference in extrahepatic 11b-HSD2 activity, Table 2.
Cortisol Generation Profiles
Endorsing the urinary steroid metabolite data, cortisol gener-ation from oral cortisone was decreased in patients with steatosis compared with controls. In contrast, patients with steatohepatitis had significantly increased cortisol generation consistent with increased hepatic 11b-HSD 1 activity compared with controls and patients with steatosis, Figure 2B.
11b-HSD1 expression studies
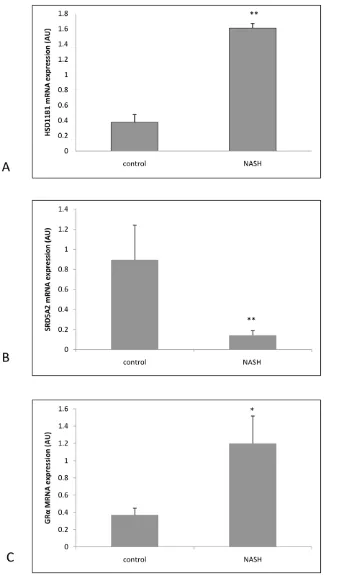
Supporting the above data, 11b-HSD1 mRNA expression in explant livers with NASH was significantly higher compared with normal controls (dCT NASH 9.6560.29 vs 11.9660.29, p,0.01 NASH vs control), Figure 3A. SRD5A2 mRNA expression was significantly decreased in NASH (dCT NASH 13.360.01 vs 1060.01, p,0.01 NASH vs control), Figure 3B and GRamRNA expression was significantly increased in NASH (dCT NASH 10.460.3 vs 11.760.3, p,0.05 NASH vs control), Figure 3C).
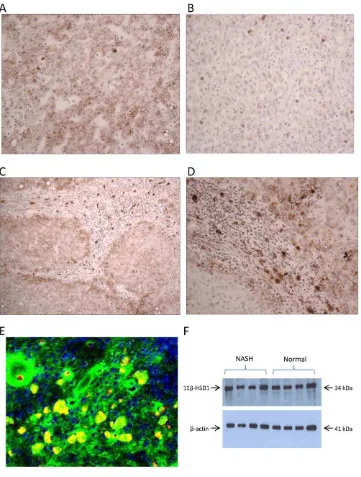
These results were further supported at the protein level by immunohistochemistry; protein expression for 11b-HSD1was increased in NASH livers compared with normals. Specifically, intense staining was seen in hepatocytes in periseptal areas. There was also intense staining in inflammatory cells within cirrhotic nodules with morphology in keeping with macrophages. Immu-nofluorescence studies confirmed these cells as CD68 positive cells co-localising with 11b-HSD1 Figure 4 A–E. Immunoblotting for 11b-HSD1 of microsomal preparations of livers from patients with NASH compared with normals did not show any significant difference in expression, Figure 4F. This represents a discrepancy between protein immunoblotting and mRNA expression in the same samples. However the histological appearance of the NASH samples provides some clues to the possible explanation for this. When comparing protein expression by immunoblotting permg of liver microsomal protein, the overall 11b-HSD1 protein expres-sion may be similar between normal and diseased groups because the immunoblotting technique does not acknowledge localized changes in expression.
Discussion
We have defined hepatic glucocorticoid metabolism in patients with the full spectrum of NAFLD. In the early stages of NAFLD, characterized by hepatic steatosis alone, hepatic cortisol clearance predominates, driven by increased 5aR activity, and decreased cortisol generation from 11b-HSD1 with a consequent activation of the HPA axis and adrenal glucocorticoid production. With disease progression and worsening inflammation and liver injury, there is induction of hepatic 11b-HSD1 expression and activity that increase hepatic glucocorticoid levels, with hepatic glucocor-ticoid exposure maximized by increased expression of GRa and decreased expression and activity of 5a-reductase. In steatohepa-titis 11b-HSD1 expression is specifically intense in CD68 positive macrophages, and may imply a role in response to chronic inflammation. Collectively these results provide a key insight into the pathophysiology of the NAFLD disease spectrum, with a switch from inactivation to activation of hepatic glucocorticoid levels as patients move from steatosis to NASH, Figure 5.
The first suggestion of a role of 11b-HSD1 in NAFLD came with the observation that transgenic mice over expressing
Table 2.Urinary steroid metabolites and ratios in patients with steatosis, NASH and control patients.
Steroid (mg/24 h) controls steatosis NASH
n 32 8 8
Cortisol 7167 7868 112620a
Cortisone 120611 127620 162639
THE 34266346 56266554 34476326c
THF 16246169 19736199 17596231
5a-THF 13246178 25006417a 1429
6300
a-cortol 316627 379642 496690a
b-cortol 457636 5336102 515697
a-cortolone 13036111 18996206a 1789
6256
b-cortolone 621657 8346112 641691
Total F metabolites 92666857 1394961075a 10351
6984d
Ratios
F/E 0.6160.03 0.6560.06 0.746012
(THF+5aTHF)/THE 0.8960.04 0.8160.06 0.9660.13
cortols/cortolones 0.4360.02 0.3360.02a 0.42
60.04
5aTHF/THF 0.8460.07 1.3160.22a 0.93
60.3
An/ET 1.1160.10 1.9960.31b 1.55
60.6
Mean absolute values are shown (mg/24 h)+/2SEM. aP
,0.05 vs controls, bP
,0.01 vs controls, cP,0.05 vs steatosis,
dP,0.01 vs steatosis. (An: Androsterone, Et: Etiochoanolone, THE: tetrahydrocostione, THF: tetrahydrocortisol).
11b-HSD1 in adipose tissue develop the full phenotype of the metabolic syndrome including hepatic steatosis. Conversely recombinant mice with global deletion of 11b-HSD1 are protected from many of these features including hepatic steatosis [24,25]. Transgenic mice overexpressing the 11b-HSD1 gene selectively in the liver under the transcriptional control of the human apoE gene, exhibit fatty liver (but not steatohepatitis) with increased hepatic triglyceride accumulation and impaired hepatic lipid clearance [26]. Furthermore, selective 11b-HSD1 inhibition reduced hepatic triglyceride concentration by nearly 30% and increased in vivo hepatic fat oxidation and expression of related genes in rats fed an obesogenic diet [27].
We postulate that the increase in hepatic cortisol clearance by 5a-reductases, and decreased 11b-HSD1 driven hepatic cortisol generation in hepatic steatosis is a protective mechanism to preserve hepatic metabolic phenotype by limiting hepatic cortisol exposure and glucocorticoid induced deleterious effects. These include ongoing hepatic lipogenesis, and gluconeogenesis with increased glucose output which worsen hepatic and peripheral
insulin resistance. Indeed, recent work from our group has shown a reduction in 5a-reductase activity with weight loss in otherwise healthy obese subjects [28]. Women with polycystic ovarian syndrome who are characterized by a susceptibility to the metabolic syndrome also have increased 5a-reductase activity and adrenocortical drive [29]. Both these groups of patients have an increased propensity to develop NAFLD. Our data support previously published findings of a subtle activation of the HPA axis in patients with NAFLD, [13,14]. This may be secondary to the increased clearance of hepatic glucocorticoid by the 5a-reductase enzymes or reduction in11b-HSD1as shown in our steatosis patients. Supportivein-vitrodata with gene and protein expression
studies from steatotic human liver samples would be a valuable extension for this work as such tissue becomes available.
[image:7.612.61.425.56.474.2]In contrast, there is a clear drive to increase hepatic glucocorticoid availability in steatohepatitis due to altered regulation at multiple levels. These include reduced A ring reductase mediated glucocorticoid clearance, increased glucocor-ticoid receptor expression and increased 11b-HSD1 activity and Figure 2. 11b-HSD1 activity assessed by:(A) 24 hr urine cortols/cortolones and 5aTHF+THF/THE ratios (mean6SEM) in patients with steatosis and steatohepatitis compared with controls. (B) Hepatic cortisol generation measured by cortisol generation profiles (mean AUC6SEM) in patients with steatosis and steatohepatitis compared with controls.
expression. 11b-HSD1 protein expression in NASH is increased throughout the liver compared with controls. Increased GRa
expression (which is expressed homogenously throughout the liver
[image:8.612.58.399.58.633.2]parenchyma in all hepatocytes without any specific zonal distribution, [30]) would further maximize immediate effects of increased hepatic glucocorticoid production. BMI data of Figure 3. Real time PCR mRNA expression data on whole liver samples from 5 normal patients and 5 NASH patients (expressed as arbitrary units±SEM) for (A)HSD11B1 (11b-HSD 1), (B)SRD5A2 (5a-reductase 2), (C)GRa.** p,0.01 NASH vs controls; * p,0.05 NASH vs controls.
individuals from which the donor liver (normal control) samples were obtained were not known, and it is possible that the BMI of this group was lower than the obese control group used in the clinical study. However, our previous work has shown that in simple obesity, there is a reduction in the generation of serum cortisol from dexamethasone-suppressed values after the admin-istration of oral cortisone reflecting decreased hepatic 11b-HSD1 activity [9]. Hence it may be expected that hepatic 11b-HSD1 gene expression in simple obesity is also reduced compared with non obese normal livers. Furthermore, in NASH livers 11b-HSD1 expression was specifically increased in hepatocytes in periseptal areas and in CD68 positive macrophages within inflamed cirrhotic
[image:9.612.61.422.59.536.2]septa. 11b-HSD1 expression was most intense in CD68 positive macrophages, even more than in hepatocytes; collectively these results would indicate a specific role for 11b-HSD1 glucocorticoid production in the inflammatory process that occurs in NASH. Previous studies have shown macrophage expression of 11b-HSD1 in the context of distinct disease models of acute inflammation notably murine studies where macrophage 11b-HSD1 activity rapidly increases during the development of acute peritonitis [31]. Our human study in NASH has shown for the first time that macrophage 11b-HSD1 expression is specifically intense in a chronic inflammatory process. These results clearly lead to a number of exciting possibilities with respect to the role of Figure 4. Hepatic 11b-HSD 1 immunoreactivity in patients with severe NASH compared to normal controls.There was generally increased staining for 11b-HSD1 throughout the liver parenchyma in (A) NASH samples compared with (B) Normal liver620. (C) and (D) Increased
staining at the limiting plate in peri-septal areas and strongly staining specific cells within the inflammatory infiltrate in NASH610(C) and620(D) (E)
Confocal microscopy on severe NASH cryosections. Green - 11b-HSD1, red – CD68 IgG macrophage marker, yellow – colocalisation of 11b-HSD1 and CD68 positive macrophages. (F) Western blot analysis of human liver microsomes from normal and NASH livers.
11b-HSD1 in steatohepatitis. With relevance to the inflammatory response it would be important to discern the phenotype of the response of these macrophages. Previous studies have shown that macrophage 11b-HSD1 expression is stimulated by IL-4 and IL-3 cytokines, both examples of Th2 cytokines that promote anti inflammatory responses. In the peritonitis model referred to above, macrophage 11b-HSD1 expression was important in the induction of phagocytosis of apoptotic neutrophils [31]. However, treatment of a murine macrophage cell line with 11b-HSD1 inhibitors was able to reduce the proinflammatory cytokine response following lipopolysaccharide treatment [32]. Macrophage 11b-HSD1 me-diated glucocorticoid production may therefore be a central mechanism to fine tune the phenotype of the inflammatory response. This may be to limit injury in chronic inflammation, and promote pro resolution mechanisms particularly in acute inflam-mation. The role of the differential activation of Type 1 (pro-inflammatory), and Type 2 (anti-inflammatory) macrophages in determining the outcome of liver inflammation has only recently been appreciated [33]. Increased hepatocyte 11b-HSD1 expres-sion, particularly in periseptal areas would further directly expose inflamed septa to glucocorticoids. However overall increased hepatic glucocorticoid would also promote hepatic lipogenesis and hence be expected to worsen hepatic steatosis. Studies on other tissues, including synovium from patients with rheumatoid arthritis [34], human and rodent colitis [35], aortic smooth muscle cells [36], and granulosa cells in the inflammatory response to ovulation [37], all show a consistent picture of induction of cell specific 11b -HSD1 gene expression in response to pro inflammatory cytokines, TNFaand IL-1bbeing the most commonly implicated [38]. The molecular mechanism by which 11b-HSD1 is induced in response
to cytokines is not entirely clear, but key transcription factors of the C/EBP family play a crucial role [39,40].
Simple hepatic steatosis is a relatively benign entity in the NAFLD disease spectrum with only a 2% risk of developing progressive disease in a twenty year period. However, the presence of fibrosis or inflammation at diagnosis is associated with a risk of developing NASH cirrhosis of up to 50% in a two year period [1]. The factors implicated in the crucial switch between simple steatosis and NASH are not entirely clear. Increased liver fat is pivotal to inflammation in NAFLD, and thus the increased supply of free fatty acids to the liver, associated with adipose tissue insulin resistance and obesity is a key factor in the development of hepatic inflammation in NAFLD. Our data show increased fasting serum FFA in patients with NAFLD compared with controls although this not achieve significance as in previously described studies. Adipose tissue insulin resistance may occur in obesity in part through the infiltration of macrophages which release pro inflammatory cytokines such as TNFa, IL-6 and IL1b[41]. Once FFA are taken up by the liver, as well as being oxidized and stored as triglyceride, they activate the transcription factor NFkB, a key regulator of gene transcription of proinflammatory cytokines, adhesion molecules, and chemokines [42]. What results is a cycle of hepatic injury and inflammation. The cytokines released from hepatocytes, in particular TNFa activate classic inflammatory cells, as well as Kupffer cells which generate more cytokines, further contributing to hepatic oxidative stress by promoting FFA oxidation, which enhances the hepatic injury that occurs by cytokine driven hepatocyte apoptosis and necrosis [43].
[image:10.612.63.420.57.376.2]C infection and in some cases is associated with steatohepatitis. Our in vivo studies showed increased hepatic glucocorticoid generation in patients with alcoholic liver disease [44] suggesting that 11b-HSD1 may be increased in steatohepatitis regardless of the underlying cause. Longitudinal studies investigating the role of hepatic 11b-HSD1 in disease progression and outcome of hepatic steatosis would provide valuable data.
This work has defined hepatic glucocorticoid metabolism in progressive NAFLD, which can be summarized into two distinct phases of altered regulation of hepatic cortisol metabolism; increased hepatic cortisol clearance in steatosis, and increased hepatic cortisol regeneration in NASH. Failure to regulate in this way may worsen the phenotype of liver disease i.e. drive hepatic steatosis or unchecked progressive hepatic inflammation. This is an exciting area of investigation that clearly warrants further study but may impact upon the role of selective 11b-HSD1 inhibitors in the treatment of patients with the Metabolic Syndrome. 11b -HSD1 inhibition may be favorable in treating hepatic steatosis by
limiting hepatic lipid deposition, but paradoxically may worsen an inflammatory response in the presence of NASH. Hence the therapeutic benefit of 11b-HSD1 inhibition may critically depend on the histological stage of NAFLD.
Acknowledgments
We thank Sue Hughes and Beverley Hughes for their excellent technical support, the nursing staff at the Wellcome Trust Clinical Research Facility, and all the volunteers who participated in the clinical study.
Author Contributions
Conceived and designed the experiments: AA PMS. Performed the experiments: AA TB CB ER IB CD. Analyzed the data: AA SH JWT PMS ER. Contributed reagents/materials/analysis tools: AA PG PMS DA. Wrote the paper: AA. Helped with recruiting subjects with NAFLD for the clinical study: EE PNN.
References
1. de Alwis NM, Day CP (2008) Non-alcoholic fatty liver disease: the mist gradually clears. J Hepatol 48 Suppl 1: S104–S112.
2. Rockall AG, Sohaib SA, Evans D, Kaltsas G, Isidori AM, et al. (2003) Hepatic steatosis in Cushing’s syndrome: a radiological assessment using computed tomography. Eur J Endocrinol 149: 543–548.
3. Dourakis SP, Sevastianos VA, Kaliopi P (2002) Acute severe steatohepatitis related to prednisolone therapy. Am J Gastroenterol 97: 1074–1075. 4. Nanki T, Koike R, Miyasaka N (1999) Subacute severe steatohepatitis during
prednisolone therapy for systemic lupus erythematosis. Am J Gastroenterol 94: 3379.
5. Hellerstein MK (1999) De novo lipogenesis in humans: metabolic and regulatory aspects. Eur J Clin Nutr 53 Suppl 1: S53–S65.
6. Norrheim L, Sorensen H, Gautvik K, Bremer J, Spydevold O (1990) Synergistic actions of tetradecylthioacetic acid (TTA) and dexamethasone on induction of the peroxisomal beta-oxidation and on growth inhibition of Morris hepatoma cells. Both effects are counteracted by insulin. Biochim Biophys Acta 1051: 319–323.
7. Dolinsky VW, Douglas DN, Lehner R, Vance DE (2004) Regulation of the enzymes of hepatic microsomal triacylglycerol lipolysis and re-esterification by the glucocorticoid dexamethasone. Biochem J 378: 967–974.
8. Baxter JD, Forsham PH (1972) Tissue effects of glucocorticoids. Am J Med 53: 573–589.
9. Stewart PM, Boulton A, Kumar S, Clark PM, Shackleton CH (1999) Cortisol metabolism in human obesity: impaired cortisoneRcortisol conversion in subjects with central adiposity. J Clin Endocrinol Metab 84: 1022–1027. 10. Bujalska IJ, Gathercole LL, Tomlinson JW, Darimont C, Ermolieff J, et al.
(2008) A novel selective 11beta-hydroxysteroid dehydrogenase type 1 inhibitor prevents human adipogenesis. J Endocrinol 197: 297–307.
11. Rosenstock J, Banarer S, Fonseca VA, Inzucchi SE, Sun W, et al. (2010) The 11-beta-hydroxysteroid dehydrogenase type 1 inhibitor INCB13739 improves hyperglycemia in patients with type 2 diabetes inadequately controlled by metformin monotherapy. Diabetes Care 33: 1516–1522.
12. Tomlinson JW, Stewart PM (2005) Mechanisms of disease: Selective inhibition of 11beta-hydroxysteroid dehydrogenase type 1 as a novel treatment for the metabolic syndrome. Nat Clin Pract Endocrinol Metab 1: 92–99.
13. Konopelska S, Kienitz T, Hughes B, Pirlich M, Bauditz J, et al. (2009) Hepatic 11beta-HSD1 mRNA expression in fatty liver and nonalcoholic steatohepatitis. Clin Endocrinol (Oxf) 70: 554–560.
14. Targher G, Bertolini L, Rodella S, Zoppini G, Zenari L, et al. (2006) Associations between liver histology and cortisol secretion in subjects with nonalcoholic fatty liver disease. Clin Endocrinol (Oxf) 64: 337–341. 15. Westerbacka J, Yki-Jarvinen H, Vehkavaara S, Hakkinen AM, Andrew R, et al.
(2003) Body fat distribution and cortisol metabolism in healthy men: enhanced 5beta-reductase and lower cortisol/cortisone metabolite ratios in men with fatty liver. J Clin Endocrinol Metab 88: 4924–4931.
16. Borkan GA, Gerzof SG, Robbins AH, Hults DE, Silbert CK, et al. (1982) Assessment of abdominal fat content by computed tomography. Am J Clin Nutr 36: 172–177.
17. Stewart PM, Wallace AM, Atherden SM, Shearing CH, Edwards CR (1990) Mineralocorticoid activity of carbenoxolone: contrasting effects of carbenox-olone and liquorice on 11 beta-hydroxysteroid dehydrogenase activity in man. Clin Sci (Lond) 78: 49–54.
18. Palermo M, Shackleton CH, Mantero F, Stewart PM (1996) Urinary free cortisone and the assessment of 11 beta-hydroxysteroid dehydrogenase activity in man. Clin Endocrinol (Oxf) 45: 605–611.
19. Shackleton CH (1993) Mass spectrometry in the diagnosis of steroid-related disorders and in hypertension research. J Steroid Biochem Mol Biol 45: 127–140.
20. Ricketts ML, Verhaeg JM, Bujalska I, Howie AJ, Rainey WE, et al. (1998) Immunohistochemical localization of type 1 11beta-hydroxysteroid dehydroge-nase in human tissues. J Clin Endocrinol Metab 83: 1325–1335.
21. Lavery GG, Walker EA, Draper N, Jeyasuria P, Marcos J, et al. (2006) Hexose-6-phosphate dehydrogenase knock-out mice lack 11 beta-hydroxysteroid dehydro-genase type 1-mediated glucocorticoid generation. J Biol Chem 281: 6546–6551. 22. Burchell A, Hume R, Burchell B (1988) A new microtechnique for the analysis of the human hepatic microsomal glucose-6-phosphatase system. Clin Chim Acta 173: 183–191.
23. Laemmli UK (1970) Cleavage of structural proteins during the assembly of the head of bacteriophage T4. Nature 227: 680–685.
24. Masuzaki H, Paterson J, Shinyama H, Morton NM, Mullins JJ, et al. (2001) A transgenic model of visceral obesity and the metabolic syndrome. Science 294: 2166–2170.
25. Morton NM, Holmes MC, Fievet C, Staels B, Tailleux A, et al. (2001) Improved lipid and lipoprotein profile, hepatic insulin sensitivity, and glucose tolerance in 11beta-hydroxysteroid dehydrogenase type 1 null mice. J Biol Chem 276: 41293–41300.
26. Paterson JM, Morton NM, Fievet C, Kenyon CJ, Holmes MC, et al. (2004) Metabolic syndrome without obesity: Hepatic overexpression of 11beta-hydroxysteroid dehydrogenase type 1 in transgenic mice. Proc Natl Acad Sci U S A 101: 7088–7093.
27. Berthiaume M, Laplante M, Festuccia WT, Berger JP, Thieringer R, et al. (2009) Preliminary report: pharmacologic 11beta-hydroxysteroid dehydrogenase type 1 inhibition increases hepatic fat oxidation in vivo and expression of related genes in rats fed an obesogenic diet. Metabolism. S0026-0495(09)00292-3. 28. Tomlinson JW, Finney J, Hughes BA, Hughes SV, Stewart PM (2008) Reduced
glucocorticoid production rate, decreased 5alpha-reductase activity, and adipose tissue insulin sensitization after weight loss. Diabetes 57: 1536–1543. 29. Vassiliadi DA, Barber TM, Hughes BA, McCarthy MI, Wass JA, et al. (2009)
Increased 5{alpha}-reductase activity and adrenocortical drive in women with polycystic ovary syndrome. J Clin Endocrinol Metab 94(9): 3558–3566. 30. Antakly T, Eisen HJ (1984) Immunocytochemical localization of glucocorticoid
receptor in target cells. Endocrinology 115: 1984–1989.
31. Gilmour JS, Coutinho AE, Cailhier JF, Man TY, Clay M, et al. (2006) Local amplification of glucocorticoids by 11 beta-hydroxysteroid dehydrogenase type 1 promotes macrophage phagocytosis of apoptotic leukocytes. J Immunol 176: 7605–7611.
32. Ishii T, Masuzaki H, Tanaka T, Arai N, Yasue S, et al. (2007) Augmentation of 11beta-hydroxysteroid dehydrogenase type 1 in LPS-activated J774.1 macro-phages–role of 11beta-HSD1 in pro-inflammatory properties in macrophages. FEBS Lett 581: 349–354.
33. Heydtmann M (2009) Macrophages in hepatitis B and hepatitis C virus infections. J Virol 83: 2796–2802.
34. Hardy R, Rabbitt EH, Filer A, Emery P, Hewison M, et al. (2008) Local and systemic glucocorticoid metabolism in inflammatory arthritis. Ann Rheum Dis 67: 1204–1210.
35. Zbankova S, Bryndova J, Leden P, Kment M, Svec A, et al. (2007) 11beta-hydroxysteroid dehydrogenase 1 and 2 expression in colon from patients with ulcerative colitis. J Gastroenterol Hepatol 22: 1019–1023.
37. Rae MT, Niven D, Ross A, Forster T, Lathe R, et al. (2004) Steroid signalling in human ovarian surface epithelial cells: the response to interleukin-1alpha determined by microarray analysis. J Endocrinol 183: 19–28.
38. Cooper MS, Bujalska I, Rabbitt E, Walker EA, Bland R, et al. (2001) Modulation of 11beta-hydroxysteroid dehydrogenase isozymes by proinflamma-tory cytokines in osteoblasts: an autocrine switch from glucocorticoid inactivation to activation. J Bone Miner Res 16: 1037–1044.
39. Chapman KE, Coutinho AE, Gray M, Gilmour JS, Savill JS, et al. (2009) The role and regulation of 11beta-hydroxysteroid dehydrogenase type 1 in the inflammatory response. Mol Cell Endocrinol 301: 123–131.
40. Williams LJ, Lyons V, MacLeod I, Rajan V, Darlington GJ, et al. (2000) C/EBP regulates hepatic transcription of 11beta -hydroxysteroid dehydrogenase type 1. A novel mechanism for cross-talk between the C/EBP and glucocorticoid signaling pathways. J Biol Chem 275: 30232–30239.
41. Weisberg SP, McCann D, Desai M, Rosenbaum M, Leibel RL, et al. (2003) Obesity is associated with macrophage accumulation in adipose tissue. J Clin Invest 112: 1796–1808.
42. Feldstein AE, Werneburg NW, Canbay A, Guicciardi ME, Bronk SF, et al. (2004) Free fatty acids promote hepatic lipotoxicity by stimulating TNF-alpha expression via a lysosomal pathway. Hepatology 40: 185–194.
43. Cai D, Yuan M, Frantz DF, Melendez PA, Hansen L, et al. (2005) Local and systemic insulin resistance resulting from hepatic activation of IKK-beta and NF-kappaB. Nat Med 11: 183–190.