The e-Learning Assessment Landscape
David E. Millard, Christopher Bailey, Hugh C. Davis, Lester Gilbert, Yvonne Howard, Gary Wills
School of Electronics and Computer Science
University of Southampton, UK
{dem, cpb, hcd, lg3, ymh, gbw}@ecs.soton.ac.uk
Abstract
Assessment is one of the more established areas of e-learning. However, it cannot be described as mature due to the disparate nature of the tools and standards available. As part of our efforts within the FREMA project to create a reference model for assessment we have produced a domain in the shape of a database of resources developed by the community. As a way of presenting and navigating that definition we have also developed concept maps that describe the domain and place the resources in context. In this paper we present the process concept map, describe the method of its creation, its purpose and validation, and also an initial analysis of the resources behind the map in an effort to map the e-Learning Assessment landscape and show where most development effort has been spent.
1. Introduction
Assessment is an important, well-established and popular area for e-learning [6, 1, 2]. In this paper we draw a distinction between e-Assessment (which we would define as assessment performed on a machine) and the broader notion of e-Learning Assessment (which we define as the process of assessment, facilitated by a machine). The area of e-Learning Assessment includes not only runtime assessment systems, but also planning, quality, analysis, grading and feedback tools. When this broad view is taken the domain appears established but not mature, as there is little agreement on standards or interoperability at the software level. Despite significant efforts by the community many of the most popular software systems are monolithic and standards are still evolving.
One promising way in which things should improve is through the adoption of Service-Oriented Architectures (SOAs). Services are highly independent software
components that share common interface standards. However, for services to be effective they need to be part of a system of services, working together for some common goal. Service frameworks are architectures made up of services, but they cannot be too prescriptive, as services are supposed to be loosely coupled. Service reference models are descriptions of how services should interact within a given domain, but reference models do not specify how individual services should be implemented, merely what their responsibilities are within a framework [7].
The FREMA1 (Framework Reference Model for Assessment) project aims to define a reference model for the domain of e-learning assessment [4]. A crucial part of this work is to create a domain definition, this is a database of projects, software, and standards in the assessment domain that can act as an evidence portfolio to demonstrate that the reference model covers the parts of the domain that the community values.
In FREMA the domain definition is delivered as an ontologically modeled database. To aid users in navigation we have added a concept map navigation tool that links concepts to resources in the database [5]. Users can navigate using the concept map and then drill down to the projects, software and standards linked to any given concept These concept maps also help to give an overview of the domain, not only in terms of how the domain is conceptually constructed, but also because a count of the number of relationships behind each concept provides a simple map of the development effort within the domain.
In effect the maps present a conceptual landscape of the domain and the analysis show the contours of community effort.
1
In this paper we describe one of our concept maps (based on the processes of assessment) and present an initial analysis of the software lying beneath the map. We believe that this analysis shows that while assessment is an established area, the full assessment cycle has not been adequately addressed.
2. Concept Maps
The FREMA concept maps evolved over a period of several months through a serious of consultation exercises. We visited a number of community events within the UK and interviewed a number of practitioners in an effort to extract common terms and perspectives. These informed an initial, informal set of terms and relationships, which we then took back to the community for validation.
Our first attempt was too complex to be universally understood and tended to prescribe a conceptual understanding from a fixed viewpoint. Our intention is to allow community members to construct perspectives from their own mental models or to define a new perspective to explore areas of the domain landscape currently unfamiliar to them. We therefore separated the terms into entities and processes so that we could more finely tune them and to make them neutral of any constructed bias. We refer to the entity version as the Noun Map, and the processes version as the Verb Map.
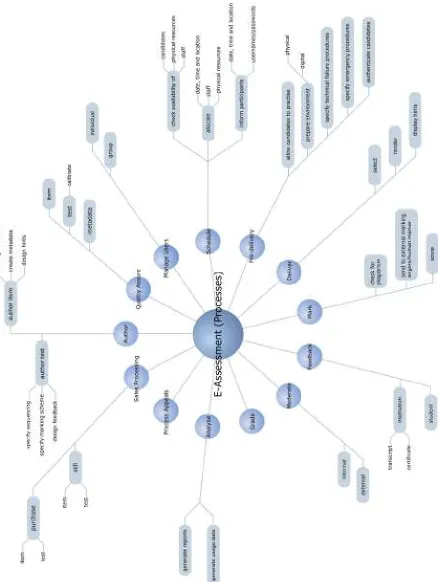
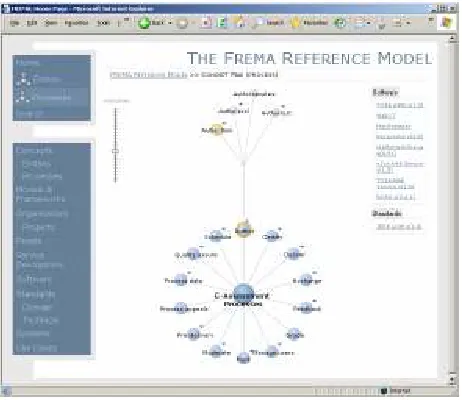
The FREMA Verb Map of the Assessment Domain (Figure 1) shows all the activities that seem to be important in e-learning assessment according to the members of the e-learning community. There is an implicit clockwise order to the map that follows a typical view of how summative assessment might be done. It starts with authoring at the top, and runs through delivery, marking, feedback and analysis. The map also covers formative assessment, although some of the concepts will not be appropriate. It was not our intention to be prescriptive about the form of assessment, but rather to capture the superset of concepts in one model. Since revising the concept maps we have implemented them as the front end to the FREMA reference model. We have developed a visual, interactive tool to allow users to navigate through the concept maps to locate and reveal the underlying resources. From the central concept, second and third level concepts are successively revealed or concealed to allow users to focus their exploration. Figure 2 shows how a user might locate resources about authoring question items in the FREMA reference model. Starting from the Verb map they have navigated
[image:3.612.318.549.177.377.2]from the author process to authoring an item. Clicking to reveal the underlying resources, they would see a list of software applications and standards on the right hand side, any of which could be selected to show a page of information about the resource. These techniques allow users to orient their searches from mental models constructed from their own visualization of the domain, unconstrained by a pre-authored view.
Figure 2: Searching for resources on authoring items in the FREMA reference model
In addition to seeking informal feedback from the community through our dissemination activities, we conducted a formal evaluation of the usefulness of the concept maps as tools for navigation and discovery. In this we worked with the (CETIS) Assessment Special Interest Group (SIG) a self-selecting group which includes early adopters, developers and representatives of standards bodies which closely reflects the actors identified in our requirements analysis for the reference model. More than 20 experts joined us in our formal evaluation which took the form of role based enactment of scenarios. We chose three typical user roles as personas [3]: Early adopter, Developer, and Planner. We asked our evaluators to select a persona closest to their own and enact that role. For example:
Will, Technical Developer:
providing or developing e-assessment applications, tools, and services to end-users.
Typical questions for Will were:
• Where are the gaps or opportunities in provision where you might develop new or innovative applications for e-assessment?
• What applications, tool, services, or infrastructure might you inter-operate with in the development of such new or innovative applications?
Our evaluators recorded their activities in structured questionnaires. We wanted to find out if they could find appropriate information to complete their task, whether the concept maps supported navigation, orientation and the finding of resources, and whether the model related to their understanding of assessment.
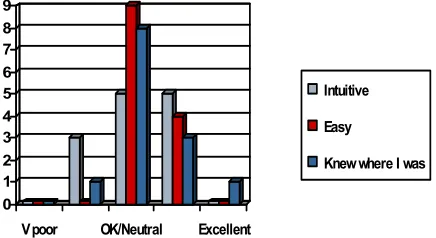
0 1 2 3 4 5 6 7 8 9
V poor OK/Neutral Excellent
Intuitive
Easy
[image:4.612.320.539.123.677.2]Knew where I was
Figure 3: Evaluator's navigation experience
0 2 4 6 8 10 12 14
Standards Services Projects Organisations
[image:4.612.75.293.308.427.2]Could find… Expected to find…
Figure 4: Evaluator’s perception of content
Figures 3 and 4 show two analyses of data collected from the evaluation. Figure 3 indicates that most of the evaluators found that the reference model web site was intuitively easy to navigate, and they could orient themselves. When asked about their experience of using the concept maps, nearly three quarters rated them between ‘OK’ and excellent as a means of navigation. Figure 4 reflects not the usability of the
web site, but the quantity of resources found within the domain. The evaluation of this is more mixed: expectations of finding resources were higher than the actual content located.
Author 2
Author item 8
Author pool 6
Author template 0
Author test 13
Certify 0
Certificate 0
E-portfolio 0
Grade book 2
Transcript 1
Deliver 11
Render item 3
Render support content 1
Select item 0
Exchange 1
Obtain pool 2
Provide pool 4
Feedback 2
Item 5
Test 3
Grade 3
Manage users 3
Group 1
Individual 2
Mark 3
Assign marking task 3 Assign partial credit 0 Check response for plagiarism 3
Generate score 6
Peer mark 0
Moderate 1
External 0
Internal 1
Pre-delivery 0
Allow candidates to practice 1 Authenticate candidates 3 Prepare environment 0 Specify emergency procedures 0 Specify tech failure procedures 0
Process appeals 0
Process data 0
Generate reports 4
Generate usage data 1
Quality assure 1
Reliability 1
Technical 2
Validity 1
Schedule 1
Allocate 3
Check availability 1
Inform participants 3
[image:4.612.78.291.459.581.2]29
3
15
7
10
3
6
15
2
4
0
5
5
8
0 5 10 15 20 25 30 35
Author
Certify
Deliver
Exchange
Feedback
Grade
Manage users
Mark
Moderate
Pre-delivery
Process appeals
Process data
Quality assure
[image:5.612.75.294.72.319.2]Schedule
Figure 6: Contour of Development Effort
3. Analysis of the Domain
The concept maps and their attached resources can also be used to quantitively analyze the domain. Figure 5 shows a table of the level 1 and 2 concepts within the Verb concept map and a count of the number of software resources attached to each. We would not claim that these figures are complete, although our validation process shows that the database has an acceptable level of coverage and accuracy to community experts. However, the figures are indicative effort within the domain.
Figure 6 presents these values as a contour across the assessment process (summed according to parent concepts). From this contour it can be seen that most software tools deal with the earlier parts of assessment, in particular Authoring and Delivery. Feedback and
Marking are also well supported. It is the administration, management and quality processes that have received less attention. For example while 15 software items are concerned with marking, only 2 are involved with moderation, and there are none that deal with the appeals process.
These valleys in the landscape are important as they connect the more visible (and demonstrably more popular) peaks. We would suggest that one of the reasons that the assessment domain feels so disconnected is that there is little effort within these
valleys, and thus technical difficulty in connecting each peak of the assessment process to the next. The valleys also represent areas that are valued by institutions, such as quality processes. The fact that these are less well supported might also be a reason for lack of practical take-up of assessment tools.
4. Conclusions
In this paper we have presented our process-based concept map of the e-Learning Assessment domain. We have described the methods by which we constructed and validated the map, have shown how it can be used to navigate a database of domain resources, and also how it can be used to analyse the domain, in particular to create a conceptual landscape against which development effort can be plotted.
We are currently in the final stages of populating the FREMA database with resources, in particular assessment use cases and service profiles that support them. Once these have been added, and the relationships between the resources created, it should not only be possible to completely navigate the domain using the concept maps, but also to perform a more complete analysis, that compares the software landscape with standards development and community interest (organizations and projects). It is our hope that such an analysis will paint a more complete picture of the domain, and help guide future developments.
9. References
[1] Bull J., and McKenna C., Blueprint for Computer Assisted Assessment: Routledge Falmer, 2004.
[2] Conole, G. and Warburton, B. "A review of computerassisted assessment," ALT-J, Research in Learning Technology, vol. 13, pp. 17-31, 2005.
[3] Cooper, A. and Reimann, R. About Face 2.0: The Essentials of Interaction Design: John Wiley & Sons, 2003. [4] Davies, W. M., Howard, Y., Millard, D. E., Davis, H. C. and Sclater, N. (2005) Aggregating Assessment Tools in a Service Oriented Architecture. In Proceedings of 9th International CAA Conference, Loughborough.
[5] Millard, D., Howard, Y., Bailey, C., Davis, H., Gilbert, L., Jeyes, S., Price, J., Sclater, N., Sherratt, R., Tulloch, I., Wills, G. and Young, R. (2005) Mapping the e-Learning Assessment Domain: Concept Maps for Orientation and Navigation. Proceedings of e-Learn 2005,Vancouver, Canada [6] Sclater N., Howie K. (2003) User requirements of the ‘‘ultimate’’ online assessment engine, Computers & Education 40 (2003) 285–306