Cinzia Alcidi is Senior Research Fellow and Head of the Economic Policy Unit, Paolo D’Imperio is Associate Researcher and Gilles Thirion is Researcher at CEPS.
Acknowledgements A large part of this paper has been made possible by the preparatory work done in the framework of the FIRSTRUN project.
CEPS Working Documents give an indication of work being conducted within CEPS’ research programmes and aim to stimulate reactions from other experts in the field. The opinions expressed in this document are the sole responsibility of the authors and do not necessarily represent the official position of CEPS.
978-94-6138-602-1
Available for free downloading from the CEPS website (www.ceps.eu) © CEPS 2017
Risk-sharing and Consumption-smoothing
Patterns in the US and the euro area
:
A comprehensive comparison
Cinzia Alcidi, Paolo D’Imperio and Gilles Thirion
No 2017/04, May 2017
Abstract
1. Introduction ... 1
2. International risk-sharing and consumption-smoothing ... 3
2.1 Stylised facts on the US and euro area ... 4
3. Comparing risk-sharing in the US and the EMU ... 9
3.1 Main results: US vs EA ... 11
3.2 Euro area internal dynamics ... 14
3.3 US International long-term patterns in risk-sharing and consumption-smoothing ... 15
4. Transitory and persistent shocks ... 17
4.1 Comparing the persistence of shocks in the US and the euro area ... 21
4.2 International risk-sharing, OCA theory and the shocks in the EA ... 23
5. Concluding remarks ... 24
References ... 26
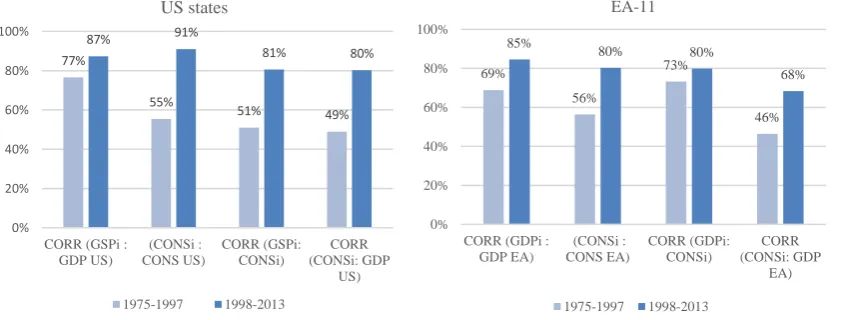
List of Figures Figure 1. (Real per capita) Consumption and GDP correlations, US (LHS panel) and euro area (RHS panel), periods 1975-1997 and 1998-2013 ... 6
Figure 2. Cross-section dispersion in GDP growth (panel a) and consumption growth (panel b): EA11 vs. US states (1998-2013) ... 8
Figure 3. Real per capita consumption and GDP correlations between domestic and euro area growth rates, EA member states, 1998-2013 ... 8
Figure 4. Income and consumption-smoothing US vs. EA-11, ... 12
Figure 5. US- EA comparison per sub-periods (comparable data), 1998-2013 ... 13
Figure 6. Income and consumption-smoothing in EA core versus periphery (US-like aggregation) ... 15
Figure 7. Channels of inter-state risk-sharing and consumption-smoothing 5-year rolling windows, 1965-2013 ... 16
Figure 8. Income and consumption-smoothing at different differencing interval, from 1 and up to 5 years, euro area and US (1998-2013) ... 18
Figure 9. Income and consumption-smoothing, transitory and persistent shocks to GSP, US (1998-2013) ... 20
Figure 10. US: (weighted) average duration of shocks, by state (1965-2013) ... 21
Figure 11. Euro area: shocks’ average duration (1990-2014) ... 22
1
Risk-sharing and Consumption-smoothing
Patterns in the US and the Euro Area:
A comprehensive comparison
Cinzia Alcidi,
*Paolo D’Imperio and Gilles Thirion
CEPS Working Document No 2017/04, May 2017
1. Introduction
In recent years, and in particular after the sovereign debt crisis, the idea of international risk-sharing as a tool to increase the resilience of the monetary union to asymmetric shocks has become part of the debate on the reform of E(M)U governance.
International risk-sharing is a notion that has been developed in the macroeconomic literature independently from the context of monetary unions and is linked to international financial integration (e.g. Obstfeld & Rogoff, 1996). Economic theory has long recognised the potential benefits of open capital markets, both in the direction of promoting growth and smoothing the time profile of consumption and investment, but also of diversifying idiosyncratic
country-specific risks.1
In the 1990s, the experiment of European monetary integration inspired a considerable body of empirical research on international risk-sharing (e.g. Sorensen & Yosha, 1998). However, interest in the concept has only gained significant prominence among policy-makers following the euro area crisis. The recent focus on international risk-sharing marks a shift in the thinking about the functioning of EMU, departing from the optimum currency area (OCA) theory, which
represented the theoretical framework of reference during the construction of EMU.2
While the OCA theory has evolved significantly over the years, after the seminal work of Mundell (1961), the linkages between and the consistency of principles across the OCA theory and international risk-sharing theory have been rarely investigated. Policy prescriptions based on the different formulations of the OCA theories tend to support measures aiming to increase the flexibility of prices (and wages) and the mobility of factors of production in order to absorb the impact of asymmetric shocks through market mechanisms. From this viewpoint, other than structural reforms, both financial and commercial cross-country market integration is seen as
beneficial3 to the extent that it contributes to higher cross-country synchronisation of business
* I am indebted to Andrea Fracasso, Daniel Gros and Niels Thygesen for insightful discussions and comments.
1 Still, despite the continuing process of financial integration and globalisation, it is unclear whether such benefits are
fully exploited in actual practice.
2 In the end, the idea of building a framework for nominal convergence (Maastricht criteria) was preferred to the
prescription of the OCA theory, which was more strongly oriented towards real convergence.
cycles. Under these circumstances, the cost of giving up national sovereignty over monetary policy in favour of a common policy is thus reduced.
In risk-sharing theory, which formalises how disconnecting domestic consumption dynamics from domestic income is beneficial when a country is hit by an asymmetric shock, a certain degree of heterogeneity across business cycles does not pose a risk, but rather is potentially an asset, as it increases the room for international diversification (Imbs & Mauro, 2007). From a theoretical point of view, asset portfolio diversification (to hedge against adverse states of nature) allows a country to diversify income sources across-borders, which in principle is only feasible when output growth rates across countries display different dynamics. In order to reap these benefits, financial integration is usually considered a necessary condition for increasing the completeness of markets (expanding the set of available assets per state of the economy).
This implies that both the OCA theory and the international risk-sharing theory prescribe market integration for their functioning but for different, and even opposite, purposes. While becoming an ‘OCA’ implies further flexibility for a better synchronisation of business cycles, the risk-sharing approach focuses on the cross-country synchronisation of consumption, taking differences in output growth as an opportunity for diversification.
The increasing attention paid to the concept of risk-sharing has been driven by a desire to understand the drivers of the (more) successful experience of existing federations, in particular the US, in the face of the financial crisis. In this respect, the limited capacity of EMU to face shocks is often attributed to the low level of market-based risk-sharing. In this sense, the euro area appears to contrast with the high degree of private risk-sharing in the US. Evidence of such feature of the US economy is found in an influential paper by Asdrubali et al. (1996), who argue that over 60% of shocks to a US state are smoothed through market mechanisms. However, economic literature focusing on alternative approaches, for instance Del Negro (2007), reaches the conclusion that that inter-state risk-sharing may be significantly more limited.
Beyond methodological considerations, one fundamental problem is that an accurate measurement of inter-state private risk-sharing is made difficult by the limited availability of data, namely bilateral cross-country income flows. This implies that the measurement of private risk-sharing in the end has to rely on approximations, which may entail measurement errors, or which embed different mechanisms to absorb the impact of shocks.
Against this background, this paper seeks to provide a comprehensive comparison of risk-sharing (and consumption-smoothing) patterns in the US and the euro area, focusing on the
role of markets.4
As a first step, it presents stylised facts, in the vein of Del Negro (2007), to provide evidence of the ‘broad’ degree of international risk-sharing based on the comparison of consumption and output correlations patterns within the US and euro area over time. It then uses the framework of Adsrubali et al. (1996) to analyse and compare different channels for risk-sharing and
consumption-smoothing. In order to do this, we first review some measurement and data issues relevant for measuring international risk-sharing and, above all, for the correct comparison between the two regions.
The results stemming from the two parts are then compared. The objective is not to reconcile the findings of the two different methodologies, but rather to investigate changes over time and compare patterns across the two regions.
Lastly, we attempt to explain the differences between the two regions by looking into whether the different capacities to absorb shocks, and international risk-sharing in particular, can be related to the persistence of shocks.
The rest of the paper is structured as follows. Section 2 reviews key findings of the literature on how the impact of shocks can be smoothed through different channels in the US and Europe, and presents a few stylised facts about international risk-sharing. In section 3, we offer an appraisal of the different channels of income and consumption-smoothing in the US and the EA, using fully comparable data. Section 4 attempts to explain the main differences, based on features of the euro area and on differences in the persistence of shocks. Section 5 concludes.
2. International risk-sharing and consumption-smoothing
In macroeconomics, the international risk-sharing framework is based on the assumption that
country-specific shocks5 cannot be avoided, but their effects can be distributed over other
countries (spatial or cross-country risk-sharing) to reduce their impact on domestic consumption. The literature focusing on the performance of federations in terms of absorbing the impact of asymmetric shocks considers not only mechanisms for spatial risk-sharing (income-smoothing) but also intertemporal risk-sharing or, as it usually called consumption-smoothing. The latter refers to the possibility to smooth the impact of shocks on consumption (and welfare) also over time, by intertemporal choices about savings and consumption, through access to domestic and international credit markets.
In the context of a pool of countries, like the euro area or a fully-fledged federation like the US, cross-country risk-sharing is provided at a private level by the international ownership of assets
and international wage transfers,6 usually called international factor income, as well at the fiscal
level (if it exists), by cross-country transfers of fiscal resources, for instance from a federal budget. Consumption-smoothing, instead, is determined by intertemporal choices in spending and saving of both the private sector (households and corporations) and the (national) government.
5 Or the asymmetric effect of common shocks. We are not able to distinguish the two cases.
6 It should be noted that in this context, ‘international’ refers to cross-state transfers within the US federation. Similarly,
The most widely used framework to measure the different channels (i.e. international factor income, transfers and savings) through which the impact of an output shock is absorbed is the one formulated by Asdrubali et al. (1996) and refined in Sorensen & Yosha (1998), and this is based on a (GDP) variance decomposition approach.
The key finding of Asdrubali et al. (1996), who analysed US data between 1963 and 1990, is that 39% of the shocks to the per capita gross product of individual states in the US is smoothed on average through transactions on capital markets, 23% through consumption-smoothing, a small part (13%) by the federal tax-transfer and grant system and 25% of shocks is not smoothed.
This suggests that although perfect insurance is not achieved, there is considerable risk-sharing among US states. These results are broadly confirmed by more recent data, as shown in the next section.
Sorensen & Yosha (1998) analyse risk-sharing patterns among EU member states (and also OECD countries) between 1966 and 1990, and show that less than 50% of the shock is smoothed, well below the 75% of the US, and find that this is achieved through corporate
savings and budget deficits,7 not through capital markets.
The work of Furceri & Zzdienicka (2013), which analyses risk-sharing patterns for 15 euro area member states between 1979 and 2010, confirms that factor income flows do not contribute to smooth income across countries in the euro area and that risk-sharing mechanisms are particularly ineffective during financial crises. Since factor income flows, which form the most important component of income smoothing, are driven by capital markets integration, the finding seems to suggest that European capital markets are less integrated than US capital
markets and that this has remained a fact even after the creation of the single currency.8
Against this background, we start our analysis from the theory on international risk-sharing and try to establish some stylised facts about it, drawing on US and the euro area data over several decades.
2.1 Stylised facts on the US and the euro area
International risk-sharing is grounded on the idea that access to international financial markets leads to international diversification of country risks by allowing for a diversification of portfolio opportunities. An optimal portfolio allocation implies that consumption in one country is only affected by symmetric risks, which are not insurable through diversification. As a result, the correlation in (the growth rate of) consumption across the countries of the pool considered –
7 Interestingly, as the authors note, this needs no actual international flow of funds as it can happen simply through
changes in domestic savings without international borrowing or lending.
the US or the EA in our case – should be high, while the correlation between domestic consumption and domestic output should be low.
In a more sophisticated fashion, the degree of risk-sharing can be assessed based on the
following two inequalities of correlations:9
𝑐𝑜𝑟(𝐺𝐷𝑃𝑖, 𝐺𝐷𝑃𝑤) < 𝑐𝑜𝑟(𝐶𝑂𝑁𝑆𝑖, 𝐶𝑂𝑁𝑆𝑤) (1)
𝑐𝑜𝑟(𝐶𝑂𝑁𝑆𝑖, 𝐺𝐷𝑃𝑖) < 𝑐𝑜𝑟(𝐶𝑂𝑁𝑆𝑖, 𝐺𝐷𝑃𝑤) (2)
Where CONS and GDP indicate growth rates of consumption and output, respectively, and the
subscript i stands for domestic (state or member state) and w for the pool of countries (either
US or EA), respectively.
Inequality (1) implies that correlations in GDP (between each US state and the whole US and between each EA member state and the whole EA) should be lower than correlations in consumption (between each same state, or member state, and the respective region). This inequality is based on the idea that additional flows of international income (associated with non-nationals and non-residents and hence not captured by GDP) affects consumption and disconnects it from domestic GDP. Under the hypothesis of complete markets, one should
expect 𝑐𝑜𝑟(𝑐𝑖, 𝑐𝑤) = 1.
Inequality (2) implies that the correlations between domestic consumption and domestic output should be lower than correlations between domestic consumption and output in the rest of the region. Likewise for inequality (1), this is the case in the presence of international income insurance through large cross-country factor income flows and international transfers, which are captured by the income but not by the national GDP.
The figures below show the four correlations involved in the two inequalities above over two different time samples (to account for the break associated with the introduction of the single currency in Europe and with sample data revisions in the US), both for the US and the euro area.
Overall it is quite interesting to note that, at first sight, the difference between the US and EA is not as dramatic as one might imagine based on the common understanding that risk-sharing in the US is much larger than in the euro area, and this seems to be the case both before and after 1998. Below we consider the figures in detail.
The first condition for international risk-sharing – as defined in inequality (1) – is that the consumption correlation coefficients must be higher than GDP correlation coefficients (comparison between the first and second set of bars in the two figures). In the period 1998-2013, the consumption correlation among US states is about 0.9 (not far from 1, which would be consistent with full risk-sharing) and is higher than in the EA countries (0.8) and higher than GDP correlations (91% against 87%). This was not the case in the years 1975-1997, and it is still
9 Correlation is defined, as usual, as a ratio of covariance of the product of standard deviations and it ranges between
not the case in the EA (80% against 85%). This result implies no meaningful risk-sharing over that period. In both regions, consumption correlations have substantially increased since 1998 (bars are higher for the more recent sample) and in the US overtook correlations in GSP (gross state product), hinting at risk-sharing. This finding seems to be consistent with the idea that financial liberalisation, which took place from the 1990s onwards at global scale, led to greater financial integration and increased the completeness of markets and hence diversification opportunities. In the euro area the process of financial integration, which was driven and reinforced by the creation of the single currency, seems (we are not claiming causality) to have led to an increased correlation in consumption across member states.
Figure 1. (Real per capita) Consumption and GDP correlations, US (LHS panel) and euro area (RHS panel), 1975-1997 and 1998-2013
Note: EA-11 = Austria, Belgium, France, Germany, the Netherlands, Finland, Italy, Portugal, Spain, Ireland and Greece. The bars depict cross-country average correlation coefficients, calculated over the periods 1975-1997 and 1998-2013. Reported correlation coefficients are respectively between domestic (i.e. state or member state) and US/EA output growth; domestic and US/EA consumption growth; domestic consumption and domestic output growth; domestic consumption growth and US/EA output growth.
Source: Authors’ formulation.
Backus et al. (1992),10 Baxter (1995), Stockman & Tesar (1995) and Sorensen & Yosha (1998) all
investigated risk-sharing, focusing on the comparison between cross-country GDP and consumption correlations until the 1990s, and find that consumption correlations were lower than output correlations, which is similar to what the light bars in Figure 1 indicate. This finding was usually interpreted as evidence against full risk-sharing, but Sorensen & Yosha (1998) point out that it is more than that. While the lack of full risk-sharing is consistent with consumption correlations lower than 1, the lack of risk-sharing cannot explain consumption correlations that are smaller than output correlations. This is a well-documented international consumption correlation puzzle in the literature. Stockman & Tesar (1995) advance the hypothesis that low consumption correlation is consistent with risk-sharing when countries face taste shocks. If this
10 They are the first to introduce the so-called ‘quantity anomaly’, the evidence that de-trended consumption is less
correlated cross-country than output.
77%
55%
51% 49%
87% 91%
81% 80%
0% 20% 40% 60% 80% 100%
CORR (GSPi : GDP US)
(CONSi : CONS US)
CORR (GSPi: CONSi)
CORR (CONSi: GDP
US) US states
1975-1997 1998-2013
69%
56%
73%
46% 85%
80% 80%
68%
0% 20% 40% 60% 80% 100%
CORR (GDPi : GDP EA)
(CONSi : CONS EA)
CORR (GDPi: CONSi)
CORR (CONSi: GDP
EA) EA-11
[image:8.595.80.503.286.446.2]hypothesis is true, such shocks are still important in the euro area, while their role in the US
has decreased over time.11
Del Negro (2002) argues that the problem is not necessarily shocks in preferences, but one of measurement and contends that interstate risk-sharing in the US is lower than reported in Asdrubali et al. (1996) because of a measurement error in the output when using such approach.
Inequality (2), which posits that the correlation between domestic consumption and domestic GDP should be lower than correlation between domestic consumption and the output of the whole region (comparison of the third and fourth sets of bars in Figure 1) is never satisfied, for any region in any time period.
Overall, the above findings suggest poor evidence of international risk-sharing before 1997, in line with previous literature, and a change after that; indeed correlation in cross-country consumption becomes higher than output after 1998. In the US international risk-sharing is not full but higher than in the euro area, where the key condition is not satisfied.
The two panels in Figure 2 compare the patterns (in growth rates) of output and consumption dispersion for the US and the euro area. Unlike correlation, cross-sectional dispersion measures the distance from the average and gives a sense of heterogeneity within the region. In practice, high correlation could coexist with high dispersion, which would capture differences in the magnitude of growth rates.
A shown, consumption dispersion in the US is very stable and lower than in the euro area, especially after 2008. In the euro area, dispersion in consumption seems to mimic GDP dispersion and its increase is likely to be related to the different way the crisis played out across euro area member states. This implies that in the US, GSP growth rate differences are higher
than consumption growth rate differences,12 which may suggest that mechanisms are in place
that allow for consumption to be less sensitive to swings in GSP. This is usually taken as evidence to support international risk-sharing (see Del Negro, 2002). The same is not true for the euro area, which tends to display a lower degree of dispersion in GDP compared to the US but a higher degree of heterogeneity in consumption.
11 This could also explain why consumption correlation increases while the fraction of smoothed shocks in the US, as
estimated in the next section, is constant over time. Indeed, the Asdrubali et al. (1996) methodology is immune to taste shocks (see Sorensen & Yosha, 1998, p. 231)
Figure 2. Cross-section dispersion in GDP growth (panel a) and consumption growth (panel b): EA11 vs. US states (1998-2013)
Note: The dispersion in output and consumption growth rates (real per capita) is measured as the respective standard deviation among EA and US countries.
Source: Authors’ computations based on OECD national account for EA countries, and Bureau of Economic Analysis (BEA), US Department of Commerce.
In sum, the correlation approach suggests that after 1998 there seems to be evidence of inter-state risk-sharing in the US, while this is not the case in the euro area.
[image:10.595.77.533.518.709.2]Figure 3 moves away from the US-EA comparison and sheds light on the risk-sharing differences across euro area member states, by displaying the four correlations in inequalities (1) and (2) by country. The data suggest that the aggregate picture (averages) as shown in Figure 1 hides substantial cross-country differences.
Figure 3. Real per capita consumption and GDP correlations between domestic and euro area growth rates, EA member states, 1998-2013
Note: Correlation coefficients are calculated over the period 1998-2013 for each country. Reported coefficients are respectively between domestic and EA GDP growth; domestic and EA consumption growth; domestic consumption and domestic output growth; domestic consumption growth and EA output growth.
Source: Authors’ computations based on OECD national account data. 0.00 0.01 0.02 0.03 0.04 0.05 1 9 9 9 2 0 0 0 2 0 0 1 2 0 0 2 2 0 0 3 2 0 0 4 2 0 0 5 2 0 0 6 2 0 0 7 2 0 0 8 2 0 0 9 2 0 1 0 2 0 1 1 2 0 1 2 2 0 1 3 GDP 0 0.01 0.02 0.03 0.04 0.05 1 9 9 8 1 9 9 9 2 0 0 0 2 0 0 1 2 0 0 2 2 0 0 3 2 0 0 4 2 0 0 5 2 0 0 6 2 0 0 7 2 0 0 8 2 0 0 9 2 0 1 0 2 0 1 1 2 0 1 2 2 0 1 3 Consumption EA-11 US 0 0.2 0.4 0.6 0.8 1
Austria Belgium Finland France Germany Greece Ireland Italy Netherlands Portugal Spain
The special feature of Germany is patent. Consumption seems to follow very peculiar dynamics, completely disconnected from domestic GDP and consumption in the rest of the area. Austria also displays similar features. Such disconnection seems to suggest that Germany and Austria are able insulate their consumption patterns from GDP fluctuations, but this is not the result of risk-sharing with other euro area member states. It could be either the result of risk-sharing at international level (outside the EA) or consumption-smoothing through domestic savings and/or absorption. Interestingly, few countries satisfy the condition that output correlation is lower than consumption correlation (comparison of the first and second bar for each country), as predicted by the risk-sharing theory; these are Greece, Ireland, Italy, Portugal and Spain. This is the ‘usual’ group of peripheral euro area countries, which received large capital inflows during the early years of monetary union, grew at high rates and, above all, were able to substantially increase their consumption. Since 2010, they have been hit hard by the crisis and their GDP growth fell more than in the rest of the euro area. Yet, the very high level (on average over the 16 years) of consumption correlation (in Spain and Italy it is close to 1) suggests that some mechanisms work in the direction of disconnecting GDP dynamics for consumption dynamics. Other than the usual intertemporal (savings and fiscal policy) and market mechanisms, the ECB interventions in support of banks and the emergency support facilities (EFSF and others) may have played a role.
3. Comparing risk-sharing in the US and the EMU
Against the prima facie evidence of limited risk-sharing in the euro area and a lower degree of risk-sharing than in the US, this section enriches the analysis by following the standard framework used in the literature, as initiated by Asdrubali et al. (1996), to measure risk-sharing in response to GDP shocks. This consists of applying a variance decomposition of shocks to GDP in order to quantify the share of smoothing achieved via the various channels. It is based on national accounting and the starting point is the disaggregation of member states’ GDP (GSP for the US states) into: national income (NI), net national disposable income (NNDI) and total consumption (C+G). From these aggregates, we identify the following channels through which GDP shocks are smoothed:
GDP-NI =international income transfers (factor income flows)
NI-NNDI = net international taxes and transfers
NNDI-(C+G) = total (private and public) net savings
We then consider the following identity:
(1) 𝐺𝐷𝑃𝑖 =
𝐺𝐷𝑃𝑖
𝑁𝐼𝑖
𝑁𝑖𝑖
𝑁𝑁𝐷𝐼𝑖
𝑁𝑁𝐷𝐼𝑖
(𝐶 + 𝐺)𝑖∗ (𝐶 + 𝐺)𝑖
the international factor income), international transfers, net total savings and consumption
being the last one.13
Before focusing on the outcome of the regression estimates, we first look into the features of the data to ensure full comparability between the US and the euro area.
The dataset for the US states is built following Asdrubali et al. (1996). Detailed information on the construction of the time series is available in their seminal paper and the description of the main elements are summarised in Box 1. As already mentioned in Sorensen & Yosha (1998), US and euro area data are not readily comparable, because of the different degree of richness of data at the level of euro area member states and US states. US states’ data are poorer; in particular, GNI does not exist at the level of each state. The problem is overcome by building a
database14 starting from information on income, taxes, contributions and transfers at personal
level, which is then used to derive the state income (SI). The latter is taken as a proxy for GNI. By contrast, for the euro area countries, GNI comes directly from national accounts and data are much more detailed, including at the sectoral level.
One crucial implication of the US approach in building states’ statistics is that the difference between GSP and SI in the US includes not only international factor income but also net savings from the corporate sector (mostly retained earnings), which in the euro area statistics is part of the total net savings (often called the credit channel) and not accounted for in the difference between GDP and GNI. The latter is factor income, in a ‘proper’ sense.
As a consequence, without adjusting the data, the comparison of the different channels between the US and the EA will be biased. The so-called capital market channel (in broad sense, the factor income) is over-estimated in the US relative to the EA and, in the EA, the net savings (or credit) channel is overestimated relative to the US (provided that corporate savings contribute positively to consumption-smoothing).
Box 1. Understanding US data
US data are available for the period 1963-2013; they are state-level, yearly, real and per-capita.
Gross State Product (GSP) is the ‘value added’ of the industries at the state level.
State Income (SI) is composed of personal income15 (income received by persons from all sources),
federal and state (and local) non-personal taxes (and contributions), and interest on state and local funds, minus public direct transfers. At the national level, State Income roughly corresponds to Gross National Income (GNI).
13 The detailed derivation of the equations and steps of the estimates can be found in Alcidi & Thirion (2016).
14 We are grateful to B. Sorensen for providing us with information about the time series used in the original estimates. 15 Personal income is the sum of wages, salaries, supplements to wages and salaries, proprietor’s income with inventory
Disposable State Income (DSI)
Disposable state income is composed of state income plus federal aid to state and local governments, plus federal transfers to individuals (unemployment benefit), minus federal personal and non-personal taxes.
Net Federal Transfers to States
Net federal transfers to states are defined as the sum of federal aid to state governments, federal transfers to individuals (unemployment benefits and other transfers to individuals), minus federal personal and non-personal taxes (direct, social security and indirect).
State16 Government Net Savings
State Government net savings is the difference between government disposable income and government final consumption or the difference between current revenues and current expenditures. Government disposable income is the sum of (state non-personal) taxes, federal aid to states and other revenues, minus direct transfers to individual and state consumption.
State Consumption
State consumption is defined as the sum of private and public (state and local governments) consumption. Private consumption by state is only available since 1997; as in Asdrubali et al. (1996), to obtain the previous years we rescale the total retail sales by the ratio of aggregate US private consumption to aggregate US retail sales.
Lastly, capital depreciation, which is usually estimated as a separate channel for the EA, cannot be isolated at the level of US states and is included in the capital market channel. This is a fixed proportion of the capital stock, so it tends to be highly pro-cyclical (hence, it tends to reduce risk-sharing) and is not very informative, but can be quite large.
3.1 Main results: US vs. EA
Against this background, we begin by presenting the estimates of the channels for shock absorption as usually presented when comparing the US and the euro area (figure 4, LHS), and then the estimates based on adjusted data which yield comparable estimates for the US and euro area (figure 4, RHS).
We start by showing the main results for the period 1998-2013, and then provide a breakdown to account for the effect of the different stages of financial crisis. This time period was chosen because in the euro area the separation of retained corporate savings from household savings is not available before 1996, and US data exhibit a structural break due to a methodological
change in the collection of GSP and consumption data in 1997.17 In order to obtain a so-called
‘capital market’ variable comparable to the US, we add corporate savings and the capital
16 Including local governments.
17 Gross state product (GSP), issued by the US Bureau of Economic Analysis (BEA), changed from SIC industry definitions
depreciation18 to the international factor income. Conversely, corporate savings are removed
from net savings in the EA. While this allows for an accurate comparison of the respective channels, it is important to note that the amount of income-smoothing provided by capital markets does not necessarily fully consist of cross-border components (i.e. corporate savings do not involve cross-border income-smoothing).
[image:14.595.80.518.308.510.2]In the case of the euro area we consider only 11 member states, namely the current members with the exception of the new member states (namely the Baltic states, Slovakia and Slovenia), because data are not available for most years, and Luxembourg, Malta and Cyprus, which are very small and atypical.
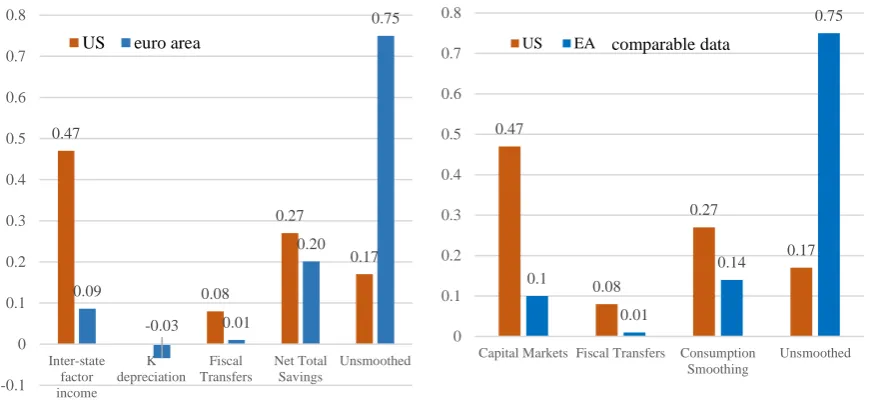
Figure 4. Income and consumption-smoothing in the US vs. EA-11
No-adjustment in data (left panel) Fully comparable data (right panel), 1998-2013
Source: Authors’ computations based on US Bureau of Economic Analysis and OECD national account data.
The US results (Figure 4) are in line with the findings from the literature presented above, although the time period is different and covers only the most recent years. Compared to the results of Asdrubali et al. (1996), the absorption of shocks through capital markets and consumption-smoothing (essentially personal savings and state-level fiscal policy) has remained unchanged compared to 1963-1990. At the same time, the role of federal transfers has slightly decreased in recent years (8% compared to 13% in the original study of Asdrubali et al. (1996)).The results for the EA (no adjustment) also confirm previous findings from the literature (eg. Furceri & Zdzienicka, 2013). They validate a very limited role of capital markets, a dominant role of savings and a large (as much as three times as in the US) share of the impact of shocks not smoothed.
18 Capital depreciation cannot be isolated in the US data.
0.47
0.08
0.27
0.17
0.09
-0.03 0.01
0.20
0.75
-0.1 0 0.1 0.2 0.3 0.4 0.5 0.6 0.7 0.8
Inter-state factor income
K depreciation
Fiscal Transfers
Net Total Savings
Unsmoothed
US euro area
0.47
0.08
0.27
0.17 0.1
0.01
0.14
0.75
0 0.1 0.2 0.3 0.4 0.5 0.6 0.7 0.8
Capital Markets Fiscal Transfers Consumption Smoothing
Unsmoothed
The results shown in the right panel of Figure 4 are those with comparable data for the euro area. Findings (Figure 4, RHS) indicate that while coefficient estimates are slightly affected, the overall message emerging from previous findings does not change substantially. The so-called capital market channel plays a large role in the US while it is very limited in the EA. Hence, accounting for the new aggregation does not seem to be crucial, at least on average. However, given that the 16 years we considered have been characterised by large cyclical swings and a profound crisis, time averages may hide large differences. We therefore break down the time sample into sub-periods and assess whether the results still hold.
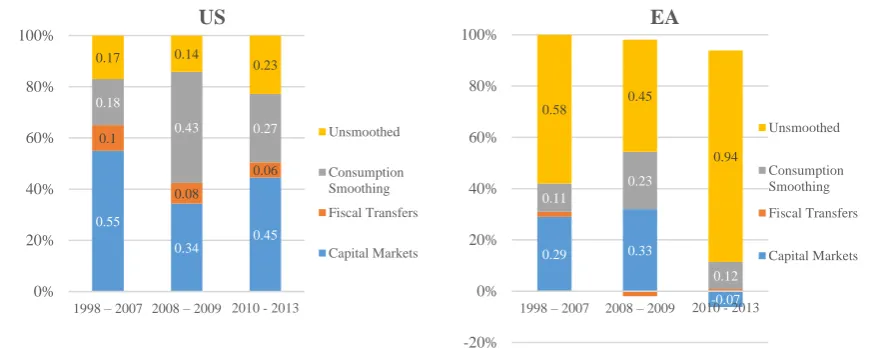
Figure 5. US-EA comparison by sub-periods (comparable data), 1998-2013
Note: 2008-09 are very special years, with the collapse of Lehman Brothers and then the coordinated fiscal stimulus.
Source: Authors’ computation.
In section 5, we present a time breakdown of the empirical results presented on the left panel of figure 4 with adjusted euro area data. Breaking up the sample into sub-periods (see Figure 5, left panel), we find that US fiscal transfer absorption capacity, as provided by the federal budget, is overall limited and even has fallen during 2010-2013, suggesting that the US fiscal stimulus did not focus on smoothing asymmetric shocks. Yet, in the US the unsmoothed part of the shock remains small, although it slightly increased in recent years – which may partially be a direct reflection of the relatively low absorption through inter-state transfers during – but much less than in the EA.
Interestingly, capital markets and consumption-smoothing (driven by personal savings) exhibit the largest variability; the role of capital markets appears to have declined since the eruption of the financial crisis, while that of savings has increased (with a dramatic increase during the peak of the crisis), but their sum has almost remained constant over time (see section 3.2 for more details on the US). Despite its significant decline in 2008-2009, the capital markets channel has recovered in 2010-2013, and remains the most powerful way to absorb shocks.
In the euro area, still under the new aggregation, capital markets seem to perform significantly better in 1998-2009 than what we had found on average. This is true at least in the first two
0.55
0.34
0.45
0.1
0.08
0.06
0.18
0.43 0.27
0.17 0.14
0.23
0% 20% 40% 60% 80% 100%
1998 – 2007 2008 – 2009 2010 - 2013
US
Unsmoothed
Consumption Smoothing
Fiscal Transfers
Capital Markets 0.29 0.33
-0.07 0.11
0.23
0.12
0.58
0.45
0.94
-20% 0% 20% 40% 60% 80% 100%
1998 – 2007 2008 – 2009 2010 - 2013
EA
Unsmoothed
Consumption Smoothing
Fiscal Transfers
sub-periods. Although one would ideally compare the respective role of corporate saving in the US with the EA, the finding that using comparable estimates leads to a much smaller (yet significant) discrepancy between the US and the EA is a crucial result of this study. On the one hand, it qualifies the gap between both regions during ‘normal times’. On the other hand, it points to the importance of well-functioning capital market integration during a prolonged crisis.
After 2010, the so-called capital market channel collapses and de-smooth the impact of the shocks in the EA (figure 5, RHS). This can be explained by several factors. First, in the new aggregation of data the capital market channel includes capital depreciation, which appears to
be relatively large, up to 10 percentage points, and highly pro-cyclical.19 Second, according to
the finding from Sorensen & Yosha (1998), corporate savings account for half of the smoothing in the EA. However, as shown in Alcidi et al. (2017), the smoothing role of corporate savings collapsed during the 2010-2013 period. This is in line with the evidence that savings are
sensitive to the cycle and tend to not work properly when negative shocks hit.20 The weak
performance of the comparable measure of capital market in the euro area thus seems to explain why incorporating corporate savings into capital market smoothing did not affect the results significantly. As argued by Asdrubali et al. (1996), this is compounded with the fact that larger shocks weigh more heavily on the coefficient estimates, which means that the low amount of smoothing during the crisis has a relatively larger impact on the overall coefficient estimate.
In the euro area, net savings (excluding corporate savings) have provided relatively limited shock absorption and even less over the last sub-period (2010-2013), which was marked by a collapse of consumption smoothing through government budgets (Alcidi and Thirion, 2007). To some extent, the growing unsmoothed part can be understood as the result of savings’ inefficiency in the face of persistent or permanent shocks.
In order to shed light on this point, we first look into specific dynamics of two euro area country groups, the core and the periphery; and second, we try to appreciate the potentially different role of the nature of shocks in the US and in the EA.
3.2 Euro area internal dynamics
As in Alcidi & Thirion (2016), we start by clustering euro area countries into two groups, core and periphery, where core includes Austria, Belgium, France, Germany, the Netherlands and Finland while periphery includes Italy, Portugal, Spain, Ireland and Greece and then compare the performance of the different channels.
19 It is such by definition, given that it is computed as a fixed percentage of fixed capital formation, which by its nature
is highly pro-cyclical.
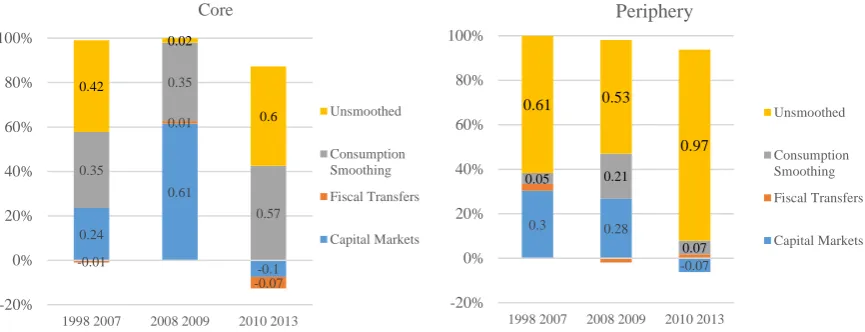
Figure 6. Income and consumption-smoothing in EA core versus periphery (US-like aggregation)
Note: The channels are measured according to the US aggregation, and hence corporate savings are accounted in the capital markets channel. This explains why results do not exactly match the findings of Alcidi & Thirion (2016).
Source: Authors’ computation.
The two charts in Figure 6 show that capital markets and consumption-smoothing exhibit a high volatility over time and great variance across the two country groups, especially after 2007 (except transfers, which always have a zero smoothing property). In particular, the unsmoothed part of the shock is systematically higher in the periphery than in the core. However, it is only in the latest years of the sample that this went well above the 60% found in the literature, mostly due to the lack of any smoothing coming either from savings or factor income. The higher resilience to shocks in the core countries after 2007 is fully explained by savings in the corporate sector (especially in the 2008-09 period) and then personal and public savings (after
2010).21
The charts above also suggest that the results for the euro area as a whole are largely driven by dynamics in the periphery, where the capacity to absorb shocks has been always lower.
3.3 US international long-term patterns in risk-sharing and consumption-smoothing
In this sub-section we focus on the US and look at how risk-sharing and consumption-smoothing patterns have evolved over almost 50 years, between 1965 and 2013, using full data availability. Using the same methodology as before, based on Asdrubali et al. (1996), we identify the effectiveness of different channels in smoothing the impact of shocks and illustrate them using five-year rolling windows.
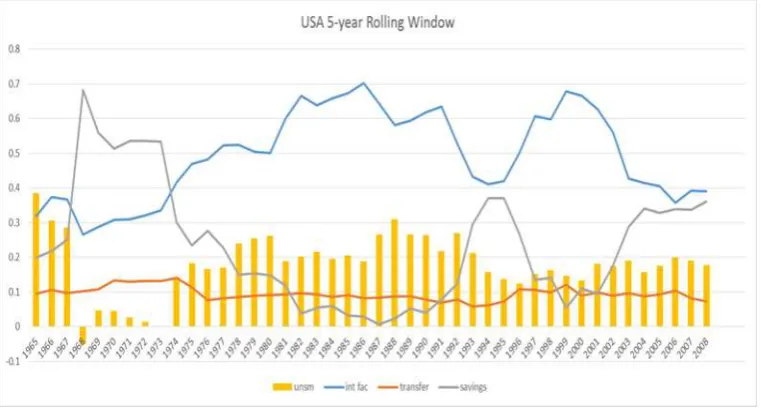
As shown in Figure 7, the share of GSP shocks that remains unsmoothed has lingered below 30% for almost the 50 years considered and slightly declined, on average, from over 20% before 1993, to below 20% in the following period. The degree of income shock-smoothing through
21 See Alcidi et al. (2017) for a detailed analysis of the behaviour of net savings.
0.24
0.61
-0.1 -0.01
0.01
-0.07 0.35
0.35
0.57
0.42
0.02
0.6
-20% 0% 20% 40% 60% 80% 100%
1998 2007 2008 2009 2010 2013 Core
Unsmoothed
Consumption Smoothing
Fiscal Transfers
Capital Markets
0.3 0.28
-0.07
0.05 0.21
0.07
0.61 0.53
0.97
-20% 0% 20% 40% 60% 80% 100%
1998 2007 2008 2009 2010 2013
Periphery
Unsmoothed
Consumption Smoothing
Fiscal Transfers
factor income (the blue line) has increased dramatically until the 1990s and then moved, following large cyclical swings. At the same time, the smoothing via net savings was on a declining trend until the early 1990s; after that it started to increase with an inverse u-shape pattern during the 1990s, and then grew again. Such an increase in the use of credit markets for risk-sharing purposes may have arisen from the increase in access to borrowing during the 2000s. In parallel, the amount of income shocks smoothed via international capital markets has fallen for more than a decade (since mid-2000s). As argued above, the Lehman crisis may have hit the functioning of the international market channel. It is not yet possible to assess whether this is a temporary or a long-lasting phenomenon. Interestingly, from the picture it emerges that international factor income mirrors the savings channel and their sum remains almost constant over time, at least since the mid-1970s.
[image:18.595.106.487.402.606.2]To better understand the interaction between these two channels, we run a Granger causality test, to test the hypothesis that the functioning of capital markets affects the net savings. In other words, we want to test whether changes in the capacity to smooth shocks through the capital markets leads (in the Granger sense) to changes in the consumption-smoothing through savings and borrowing.
Figure 7. Channels of inter-state risk-sharing and consumption-smoothing 5-year rolling windows, 1965-2013
Note: 1965 refers to period 1965-1970 and 2008 to 2008-13.
Source: Authors’ formulation22.
The formulation of this hypothesis is based on the findings of Asdrubali & Kim (2004),23 who
analyse the interaction between international risk-sharing (fiscal or through capital markets) and inter-temporal consumption-smoothing (through net savings) channels in the US. They find
22the values of the unsmoothed part for the years 1968-1973 rolling windows are not significantly different from zero
23 They use a panel VAR, so a different framework, to assess the interaction between risk-sharing and
that international capital markets and (federal) fiscal risk-sharing channels tend to be complementary and crowd out (or reduce) the consumption-smoothing through savings. The explanation put forward by Asdrubali & Kim (2004) is that capital markets and fiscal transfers are ex-ante insurance mechanisms; they exist as a tool to deal with potential future shocks. On
the other hand, consumption-smoothing is an ex-post mechanism, which eventually is triggered
after the shocks have occurred and only when the other (ex-ante) channels are not able to fully
absorb the initial shock. If this hypothesis is true, we should find that the capital market leads the credit market channel and reject a causality going from consumption-smoothing to the factor income.
The results of the Granger causality test24 confirm the hypothesis that the amount of
consumption-smoothing is determined by the absorption capacity of the capital markets, while the causality in the other direction is always rejected. An important implication of this is that if income smoothing through international capital markets is weak and net savings, especially private savings, are affected by the cycle and the persistence of the shocks in times of long negative shock, the impact of GDP shocks tend to translate more widely on consumption. In the next section we focus on the issue of the persistence of shocks.
4. Transitory and persistent shocks
We now look at whether the different capacity to absorb shocks between the US and the euro area can be explained, at least partially, by the different nature of shocks or structural features of shocks.
Following the permanent income theory, if a negative shock is persistent or permanent, personal savings are not effective in smoothing consumption. Moreover, credit institutions tend to reduce their credit supply in the face of long-lasting shocks. For the same reason, governments may have only limited capacity to access credit markets to borrow. This implies that in regions like the euro area, where savings seem to play an important role in reducing the impact of shocks, negative persistent shocks are unlikely to be smoothed effectively. By contrast, given its nature, international risk-sharing through capital markets should be ‘immune’ to persistent shocks, as far as shocks are uncorrelated across countries. This would put the US in a better position than the euro area in the face of long, negative shocks.
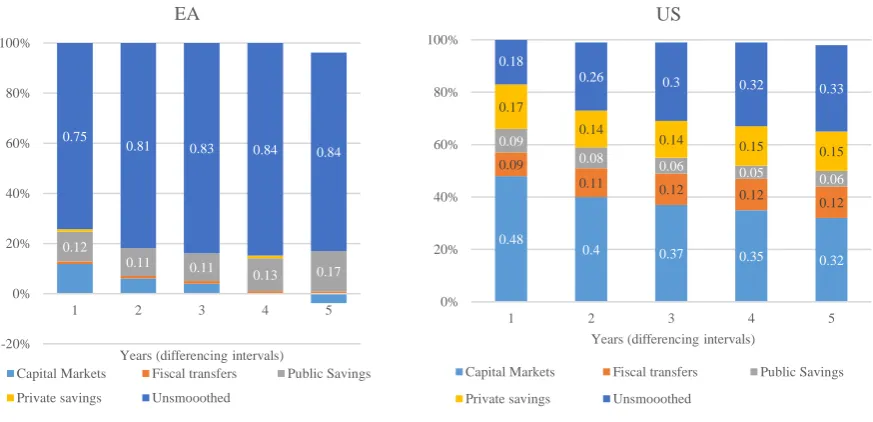
Figure 8. Income and consumption-smoothing at different differencing intervals, from 1 and up to 5 years, euro area and US (1998-2013)
Note: The channels are measured according to the US aggregation; hence corporate savings and capital depreciation are in the capital markets.
Source: Authors’ formulation.
In order to take these considerations into account, we consider the patterns of risk-sharing among euro area countries and US states at one and five-year intervals. This should give us a sense of what happens to the effectiveness of channels when the shock lasts not one year but five years. For the purpose of having better insight into the different categories of net savings, we split governments’ budgets from personal/households savings. On the one hand, the results can help to empirically assess whether the (close to) 50% capital market income smoothing among US states (shown in Figure 4) is driven mostly by factor income flows rather than by corporate savings patterns, as argued earlier. In the Asdrubali et al. (1996) framework, the capital markets channel in the US remains stable (actually increasing) when considering longer differential intervals. In that context, the conclusion was that corporate savings did not play a great role, because corporations do not smooth distributed profits at the three-year horizon and above, and hence the core absorption capacity had to come from the international factor income. Our results, as shown in Figure 9, show that the role of capital markets declines when considering longer time intervals, and that at the three-year and above horizon, it falls by about one-quarter, suggesting that something has changed compared to the period before 1990.
The picture is much bleaker in the euro area, where capital markets’ capacity to absorb the impact of a shock is not only reduced when the differencing interval lengthens, it disappears after four years. In fact, this is in line with previous findings whereby private market risk-sharing was very limited and corporate savings (included in the same channel), which provide some absorption capacity, are unable to respond to long-lasting shocks. In the euro area, the only resilient channel is net government savings, which is nothing but fiscal policy at the level of the
0.12
0.11 0.11
0.13 0.17 0.75
0.81 0.83 0.84 0.84
-20% 0% 20% 40% 60% 80% 100%
1 2 3 4 5
Years (differencing intervals)
EA
Capital Markets Fiscal transfers Public Savings
Private savings Unsmooothed
0.48
0.4 0.37 0.35
0.32
0.09
0.11 0.12
0.12
0.12
0.09
0.08
0.06 0.05
0.06
0.17
0.14
0.14 0.15
0.15
0.18
0.26 0.3
0.32 0.33
0% 20% 40% 60% 80% 100%
1 2 3 4 5
Years (differencing intervals)
US
Capital Markets Fiscal transfers Public Savings
member states.25 This is also in line with previous findings, whereby consumption-smoothing
among OECD countries is not driven by personal savings, but rather by national government savings, and the role of the latter tends to increase at longer time intervals as government spending becomes effective with a lag (see Asdrubali et al., 1996).
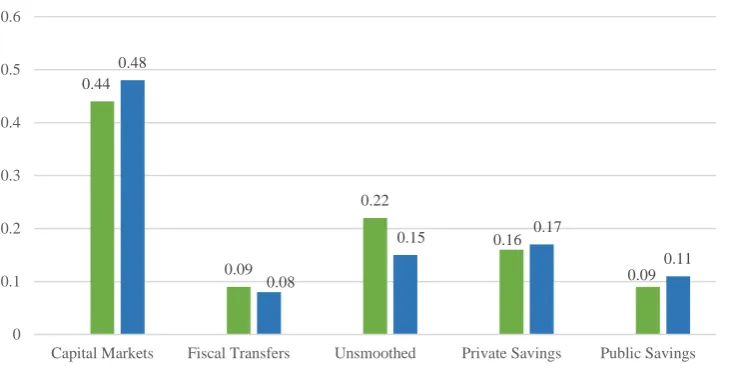
As some of the results for the US seem to contradict previous findings, we try to isolate the response to transitory from permanent shocks using a different methodology. For this purpose, rather than looking at longer differencing intervals, we analyse the pattern of income and consumption-smoothing for states facing persistent shocks and states facing transitory shocks. As a measure of the persistence of fluctuations, we use the one proposed by Campbell &
Mankiw (1987).26, 27 As in Asdrubali et al. (1996), in order to keep the number of parameters
reasonably low, we estimate an autoregressive model with three lags. We then split our sample into two groups: states with highly persistent shocks to GDP growth, namely the top third, and the rest. In doing so we find that over the period considered, the inertia coefficient of the GDP
series is 1.45 for the high persistence group and 0.83 for the low persistence group.28 Once the
country groups are identified, we again measure the performance of the different channels for risk-sharing. Figure 9 records the results and these are in line with those yielded from the previous methodology, and as shown in Figure 8. The role of capital markets is higher for transitory shocks, while the contribution of personal savings does not significantly decline, moving from transitory to persistent shocks. Lastly, previous findings relative to the role of federal transfers and state budgetary policy (public savings) remain valid.
25 See Alcidi & Thirion (2017) for an in-depth analysis on the effectiveness of this channel.
26 This measure is based on the coefficients of an autoregressive process for the US states’ GSP. The measure is equal to
1
(1−∑𝑝1=1𝜌𝑖) where the 𝜌𝑖are the p coefficients of the AR(p) process ∆𝐺𝑆𝑃𝑡= 𝜇 + ∑ 𝜌𝑖∆𝐺𝑆𝑃𝑡−𝑖 𝑝
1=1
27 Unfortunately, the exercise can only be done for the US, as the number of observations for the euro area is too low
(because of the number of countries) to be relevant.
28 Interestingly, in Asdrubali et al. (1996), where the period considered was 1965-1990, the average persistence
Figure 9. Income and consumption-smoothing, transitory and persistent shocks to GSP, US (1998-2013)
Source: Authors’ formulation.
How can the drop in capital market channels and the resilience in personal savings be explained? It is difficult to find accounts supported by empirical evidence, but here we advance two hypotheses based on the narrative. The first hypothesis is that the role played by corporate savings (included in the capital market channel) increased after the 1990s and resulted in a smaller part of the shock that is absorbed when the length of the interval increases. However, this hypothesis is not consistent with other findings. As illustrated by the estimates in Figure 4, which measure transitory shocks, the capital market channel as a whole has declined over time by about 9 percentage points, with an even larger fall in 2008 and 2009. For transitory shocks, it is impossible to differentiate the role of savings from international factor income. The second hypothesis is that the financial crisis that followed the collapse of Lehman Brothers in 2008 was a shock to the capital market channel. The global financial crisis was a negative systemic shock, which has affected the functioning of the capital market channel (consistent with Figure 6 and the 2008-09 trough) by reducing international diversification opportunities and drastically increasing risk aversion. These factors may have broken the absorption capacity of international private transfers and the effect may have been even more visible in the face of lasting shocks.
Another interesting aspect of the US results is the surprising resilience in the shock-absorption capacity of personal savings. This also emerged from Figure 9. Their consumption-smoothing capacity usually falls when the length of the shock increases. This fact has theoretical foundations (permanent income theory) and is usually supported by evidence. However, it does not seem to be the case in this context. How can this be explained? It should be remembered that during the financial crisis, the losses, especially those linked to the bursting of the housing bubble and the subprime mortgages crisis, have been absorbed through measures that are not directly identifiable in the national accounting decomposition as federal intervention, but they may well have indirectly resulted in an effect on net savings, safeguarding them. Examples of
0.44
0.09
0.22
0.16
0.09 0.48
0.08
0.15 0.17
0.11
0 0.1 0.2 0.3 0.4 0.5 0.6
Capital Markets Fiscal Transfers Unsmoothed Private Savings Public Savings
these are the interventions of the Federal Deposit Insurance Corporation (FDIC) – to protect deposits – as well as the action plan to avoid the default of the two federal mortgage
institutions.29
The findings about federal transfers, and in particular its growing absorption capacity when differencing interval increases, is in line with previous findings for the US. It also is interesting to note that when accounting for the breakdown of the net savings to isolate the role of the states’ savings, the sum of state channels and the federal transfer’s channels is constant over the different time intervals.
4.1 Comparing the persistence of shocks in the US and the euro area
To overcome data limitations in the econometric analysis and to get a sense of the differences in the persistence of the shocks between the US and the euro area, we calculate the average duration of shocks (positive and negative) for each US state and each euro area member state, over the period 1990-2013. Similar to the econometric technique used earlier, we defined a shock as a deviation from the (weighted) average (GDP growth rate) across the region and consider the number of consecutive years above or below such average.
As will be shown below, the comparison points to a longer duration of shocks in the euro area relative to the US, but also larger cross-country differences. Overall, this evidence is consistent with the previous finding that in the euro area the capacity of savings to smooth shocks is lower than in the US.
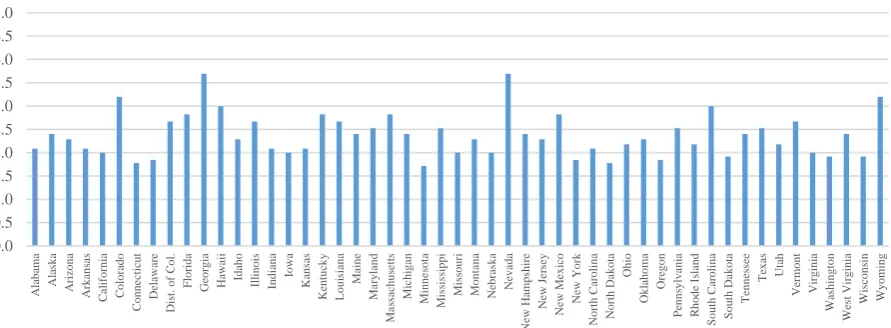
[image:23.595.76.522.518.682.2]In the case of the US (Figure 10), the average duration goes from just below 2 to about 3.5 years, and more than 30 of the 52 states have an average duration of around 2 years.
Figure 10. US: (weighted) average duration of shocks, by state (1965-2013)
Note: We consider the 1965-2013 period, even though it does not correspond to the period considered for the euro area because the break in the data in 1997 would require that we cannot take a period 1990-2013.
Source: Authors’ formulation based on OECD data.
29 In the fall of 2008, the US Treasury placed into conservatorship the government-sponsored enterprises (GSE) Fannie
Mae and Freddie Mac, and the Federal Reserve started the purchase of their debt, to avoid the default.
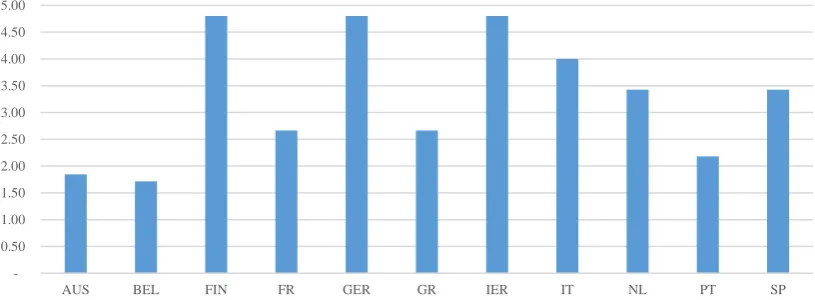
In the case of the euro area (Figure 11), the average persistence of shocks can vary substantially across countries, from less than two years to almost five years.
[image:24.595.96.504.244.394.2]It should be noted that this measure of persistence says nothing about the size or the sign of the deviation from the average; in other words the persistence could also be associated with very small deviations, positive or negative, from the average. Therefore our indicator of the persistence of shocks should rather be read as the length of a fictitious business cycle (based on the average growth rate of the region rather than the potential output of each country).
Figure 11. Euro area: shocks’ average duration (1990-2014)
Source: Authors’ compilation based on OECD data.
Figure 12 complements the information on the persistence with the number of years with negative and positive shocks. Some countries have been persistently below or above the average. Finland, Portugal and Ireland, on the one hand, and Italy, on the other, are the extreme cases. Over the 25 years considered, for 17 years (70% shown in the chart) Italy has been below the euro-area average, while for Finland, Portugal and Ireland the opposite is true, 19 years above the average. Even though Italy has always been very close to the average euro-area
growth rate, the result hints at structural differences, at least vis-á-vis Finland and Ireland,
[image:24.595.177.417.604.740.2]where the growth rates have been much higher than average.
Figure 12. Euro area: portion of negative shocks (1990-2014)
Source: Authors’ compilation based on OECD data.
0.50 1.00 1.50 2.00 2.50 3.00 3.50 4.00 4.50 5.00
AUS BEL FIN FR GER GR IER IT NL PT SP
0% 10% 20% 30% 40% 50% 60% 70% 80% 90%
From a risk-sharing perspective, differences across countries in the form of negative correlations foster diversification and hence are positive. By contrast, too limited changes in the sign of the shocks may hint at structural differences associated with systematic
under-performance or over-under-performance relative to the average. This implies that the shock structure
might also hinder risk-sharing because of investors’ decisions. A fund manager would probably avoid investing in a country that is constantly below the average, even for risk diversification purposes. Combined with still-high home-bias, this helps to explain the limited role of capital markets in the euro area.
4.2 International risk-sharing, OCA theory and the shocks in the EA
As explained in the introduction, the international risk-sharing view of monetary union departs from the OCA theory (at least its original formulation) and also from the Maastricht framework, which did not explicitly embed the issue of the synchronisation of business cycles or the role of financial integration. However, these contributions to the literature are somewhat united in the instrumental role that financial integration is expected to play in these theoretical predictions.
The literature investigating whether the introduction of the single currency boosted financial integration and contributed to increasing business cycle correlations or international risk-sharing is difficult to compare and the overall results do not always go in the same direction. On the one hand, Kalemli-Ozcan et al. (2010) show that the channels for risk-sharing evolved after the creation of EMU. In particular, they find that risk-sharing through factor income flows and capital gains was close to zero prior to the introduction of the euro in 1999, but has since increased to 6% for each channel. Kalemli-Ozcan et al. (2008) find that increased holdings of foreign assets and banking integration in the EMU have spurred risk-sharing, “improving ex-post the optimality of the EMU.” By contrast, estimates by Demyank et al. (2007) point to a decrease in the overall international credit smoothing in the five years following EMU, compared to the five previous years.
On the other hand, De Grauwe & Yi (2016) find that the synchronisation of the business cycle has increased over time since the start of EMU, but so has the difference in the amplitude of the cycle across countries. Likewise, Belke et al. (2016) find that, since the late 1990s, in the euro area a strong common cycle is associated with large differences in cyclical positions, even if national cycles are strongly correlated.
Deeper financial integration in the context of the EMU project has always been perceived as a good achievement, despite a lack of clear understanding of its specific benefits for the monetary union. Financial integration is usually considered a necessary condition for increasing completeness of markets, and hence for international risk-sharing, as well for increasing the synchronisation of business cycles, as the OCA theory confirms. In reality, it is not a sufficient condition for any of them and the stylised facts and empirical evidence shown in this paper, in line with other recent empirical literature, seem to suggest that the benefits of a higher degree of completeness of markets and increased synchronisation did not materialise.
The correlations illustrated in section 2 suggest very poor cross-country international risk-sharing in the euro area, if any at all, even though some improvement occurred after 1998, and this is in line with the empirical findings about the very limited capacity of international capital markets to absorb the impact of shocks. The evidence of high and heterogeneous persistence of the shocks, combined with the evidence of systematic under- and over-performance of certain member states, helps explain the limited international risk-sharing. It also suggests that while the correlation of cycles may have increased over time, there are structural cross-country differences. This feature is not desirable from an OCA theory perspective because it does not make monetary policy more effective, nor does it from the point of view of risk-sharing because it is likely that this kind of heterogeneity does not allow for good hedging.
5. Concluding remarks
The evidence presented in this paper attempts to shed light on the capacity of the euro area to smooth the impact of shocks over time and relative to the US, and tries to understand differences in the role of the various mechanisms through which the shock absorption happens. In doing so, we start by building fully comparable data for the US and the EA and then we estimate the different channels using a standard analytical framework, as in Asdrubali et al. (1996).
Our findings confirm that capital markets in the US perform far better than in the euro area in supplying risk-sharing. In the euro area, this channel has never been strong, not even after the introduction of the euro and during the good years of financial integration. However, under the new aggregation, prepared for comparability purposes, the channel performed better than was previously found, at least until 2008. After that it collapses and after 2010 it seems to amplify shocks rather than absorb them.
We also find that the persistence of shocks is an issue in the euro area relative to the US, for two reasons. In the euro area, total savings and borrowing, which include corporate and households as well as national budgetary policy (public savings), seem to play a greater role than in the US, where instead capital markets provide the largest part of risk-sharing. Since shock absorption through saving and borrowing does not usually work in response to persistent/permanent shocks, the persistence of the euro area debt crisis may explain why after 2010 the unsmoothed part of the shock increased dramatically in the euro area and much less so in the US.
In addition to this and in contrast with previous findings, in the US, personal savings have been very resilient in smoothing the impact of persistent shocks. It should be noted that net savings means both use of savings and borrowing through access to credit markets. We advance the hypothesis that such resilience can only be explained by measures taken in response to the financial crisis, from the FDIC intervention to the rescue of Fannie Mae and Freddy Mac. In the euro area, domestic (member state) fiscal policy seems to have been the only tool that contributed to smoothing the effect of shocks, but this has been limited in size.
References
Alcidi, C. and G. Thirion (2016), “Assessing the Euro Area shock absorption capacity: Risk-sharing, consumption smoothing and fiscal policies”, CEPS Special Report No. 146, CEPS,
Brussels (
https://www.ceps.eu/publications/assessing-euro-area%E2%80%99s-shock-absorption-capacity-risk-sharing-consumption-smoothing-and).
Alcidi, C. and G. Thirion (2017), “Fiscal risk-sharing in response to shocks: New lessons for the
euro area from the US”, FIRSTRUN D3.3 (
http://www.firstrun.eu/files/2017/03/D3.3-US-EA-fiscal-risk-sharing_final_ed.pdf).
Alcidi, C., P. D’Imperio and G. Thirion (2017), “Intertemporal risk-sharing in the euro area: Disentangling the effect of credit markets and governments”, forthcoming.
Allard, C., P.K. Brooks, J.C. Bluedorn, F. Bornhorst, K. Christopherson, F. Ohnsorge and T. Poghosyan (2013), “Towards a Fiscal Union for the Euro Area”, IMF Staff Discussion Note, International Monetary Fund, Washington, D.C., November.
Allard, C., J.C. Bluedorn, F. Bornhorst and D. Furceri (2014), “Lessons for the crisis: Minimal elements for a fiscal union in the euro area”, in C. Cottarelli and M. Guergeuil (eds),
Designing a European Fiscal union, International Monetary Fund, Washington, D.C., November.
Asdrubali, P., B. Sorensen and O. Yosha (1996), “Channels of interstate risk sharing: United
States 1963-1990”, Quarterly Journal of Economics 111 (4): 1081-1110.
Asdrubali, P. and S. Kim (2004), “Dynamic risk sharing in the United States and Europe”, Journal
of Monetary Economics 51(4), 809-836, May.
Backus, D., P. Kehoe and F. Kydland (1992), “International real business cycles”, Journal of
Political Economy 100: 745–775.
Balli, F. and B. Sorensen (2007), “Risk Sharing among OECD and EU Countries: The Role of Capital Gains, Capital Income, Transfers, and Saving”, MPRA Working Paper No. 10223.
Baxter, M. and M. Crucini (1995), “Business cycles and the asset structure of foreign trade”,
International Economic Review 36: 821–854.
Belke, A. C. Dominik and D. Gros (2016), “Business Cycle Synchronization in the EMU: Core vs. Periphery”, CEPS Working Document No. 427, CEPS, Brussels.
Campbell, J. and N.G. Mankiw (1987), “Are Output Fluctuations Transitory?”, Quarterly Journal
of Economics,102 (4): 857–880.
Crucini, M.J. (1999), “On International and National Dimensions of Risk Sharing”, Review of
Economics and Statistics 81(1): 73–84.