Understanding the effects of peripheral vision and muscle memory on
in-vehicle touchscreen interactions
Ayse Leyla Eren
1*, Gary Burnett
1, David R Large
1, Catherine Harvey
11
Human Factors Research Group, University of Nottingham, ITRC Building, University Park Campus, Nottingham, United Kingdom
*
ayse.eren@nottingham.ac.uk
Abstract: It is important to gain a better understanding of how drivers interact with in-vehicle touchscreens to help design interfaces to minimise “eyes off road” time. The study aimed to investigate the relative effects of two interaction mechanisms (peripheral vision - PV and muscle memory - MM) shown to be relevant to visual behaviour when driving, on the time to press different sized buttons (small 6x6cm, medium 10x10cm, large 14x14cm) on an in-vehicle touchscreen. Twenty-five participants took part in a driving simulator study. They were presented with a single, white, square button on the touchscreen on 24 successive trials. For MM conditions, participants wore a pair of glasses that blocked their peripheral vision and for PV conditions they were asked to keep their focus on the vehicle in front throughout. Results showed that task time gradually decreased for the trials when participants could only use MM. However, overall task time for MM conditions were significantly higher than for those in which PV was utilised, and participants rated the use of MM to be more difficult than PV. In contrast, results suggest that for interfaces that utilise peripheral visual processing the learning effect is not evident and operation times are constant over time. These findings indicate that in-vehicle touch screens should be designed to utilise peripheral vision for making simple button selections with reduced visual demand.
1. Introduction
In-Vehicle Information Systems (IVIS) afford a large number of potential useful functions for drivers, e.g. media/ entertainment, communication, navigation. Such functionality can be accessed via menu-oriented hardware technologies such as touchscreens – but the inherent visual nature of such displays together with a basic lack of tactile feedback raises the potential for significant distraction. Essentially, the visual attention required from the driver towards the inside of the vehicle (measured by number/duration of glances to the display) will increase at the expense of the attention that needs to be directed to the outside driving environment. Recognised definitions of distraction recognise this competition for a driver’s resources, for instance Lee et al. define driver distraction as
“a diversion of attention away from activities critical for safe driving toward a competing activity” [1].
With respect to epidemiological data, according to the Department of Transport in 2015, approximately 27% of fatal crashes in the UK that resulted in one or more deaths were caused by “failure to look”. Out of these, 25% of contributory factors were driver in-vehicle distractions, distractions outside the vehicle, and phone use [2]. Driver distraction can have a significant effect on driving performance. For example, texting while driving can lead to an increased number of lane excursions [3] and can result in hard braking and missed red lights at junctions [4]. There is also evidence showing that visual distraction can lead to impairments in event detection [5] and increased lane keeping variations [6].
There have been many attempts to gain a better understanding of how drivers interact with in-vehicle displays and how to decrease visual distraction caused by these displays. For example, an experiment by Rumelin and Butz aimed to identify new concepts to keep the driver’s attention on the road when interacting with touch screens
[7]. They investigated three different approaches; design for proprioception, incorporating physical handles onto the touch screen and the use of directional touch gestures. The results of their experiment showed that touch buttons had the lowest task completion time, however they still were not enough for blind interaction [7]. Another study conducted by Reiner et al., compared a phone dialling task using a touchscreen and a mobile phone whilst driving, with a focus on young drivers. Their results showed that participants made fewer glances to the device when they were using a mobile phone compared to the touch screen device [8].
Nevertheless, these approaches assume that the driver is directing full foveal vision towards the touchscreen during interactions, and as such aim to minimise the duration or frequency of glances. An alternative approach is to reduce the inherent demand that the interface places on full foveal vision, such that interaction may be possible using an alternative mechanism (e.g. peripheral vision, muscle memory), thereby eliminating glances.The aim of the study reported in this paper is therefore to investigate the extent to which different human performance processes (visual and manual) can be used to support ‘non-visual’ operation of an in-vehicle touchscreen interface.
There are two interpretations of ‘non-visual’ operation which are relevant in driving. Completely ‘non-visual’ operation would involve drivers selecting options on a display screen completely ‘blind’, i.e. without using any vision, and therefore only using motor movements (or ‘muscle memory’) to interact with the screen. We may also seek to achieve a partial ‘non-visual’ state, in which drivers can interact with an in-vehicle touch screen using peripheral vision, whilst still attending to the road and primary driving tasks such as steering, speed control and navigation, using foveal vision. In this manner, the driver is potentially able to achieve the simultaneous operation of
IET Review Copy Only
driving and interacting with an in-vehicle interface. It is important to note that there are likely to be limits to the types of operations achievable using only peripheral vision, but evidence suggests that some level of interaction with an IVIS is possible via this interaction mechanism [9].
To understand more about the potential for ‘non-visual’ operation of in-vehicle interfaces in both scenarios described above, we conducted a study to investigate the extent to which motor and visual processes are used in the selection of buttons on an in-vehicle touch screen display.
1.1. Peripheral Vision
As drivers typically spend around 90% of their time looking at the road scene [10] it is important that in-vehicle touchscreens are designed such that drivers are encouraged to keep their eyes on the road. Display characteristics, such as button size [11], number of items represented on the screen and display location [12, 13] have been used to minimise visual demand. An alternative approach is to reduce the dependency on foveal vision to accommodate ‘non-visual’ interaction.
The idea of using peripheral vision to detect information has been explored by previous research[14, 15, 16]. Horrey and Wickens [13] argued that drivers might use ambient vision (peripheral vision) to perform tasks of controlling the car such as lane keeping and speed control. However, they suggested that foveal vision might be required for effective hazard detection. In that instance, it is safer for the driver to have their eyes on the road to be able to detect hazards instead of focusing on an in-vehicle display. Summala et al. [17] conducted a study in which they asked novice and experienced drivers to drive on a straight road and use only their peripheral vision for lane keeping whilst performing a secondary task with an in-vehicle display using their foveal vision. The results revealed that even though initially the novice drivers’ performance was poor, it improved with practice and time. Another study carried out by Summala et al. showed that ambient vision was effective when used for vehicle control but did not support hazard awareness [18]. Lamble et al. examined the effect of the positioning of a visually demanding in-vehicle task on the driver’s ability to use peripheral vision to detect a decelerating lead vehicle [5]. During this study, a forced peripheral vision paradigm [17] was used where participants were asked to focus solely on an LED display, which was positioned at 10 different locations, and use their peripheral vision in detecting the decelerating vehicle in front. The results showed a strong inverse relationship between time-to-collision (TTC) and eccentricity of the task to the normal line of sight. Another study conducted by Horrey and Wickens involved participants reading information on a head-up display (HUD) and head-down display (HDD) whilst driving in a simulated environment [13]. The results of the study showed that participants were not as successful detecting hazards on the road using their peripheral vision when they were looking at the HDD using their foveal vision when compared with use of the HUD. Overall, the HUD display was the better option in detection hazards and completing the in-vehicle technology task.
Most peripheral vision studies in the context of driving investigate scenarios in which the driver is interacting with the in-vehicle display using foveal vision and is asked to detect anything important that might be happening on the road (i.e. potential hazards) simultaneously using peripheral vision. However, a notable scarcity in current research is the opposite approach, i.e. using peripheral vision as an interaction mechanism when interacting with in-vehicle displays, while maintaining foveal vision on the driving task. We investigated the use of peripheral vision as an interaction mechanism for in-vehicle touch screens instead of using it for hazard detection.
1.2. Muscle Memory
Muscle memory has been explored in the context of interface design, but has been seldom applied in the driving domain. Muscle memory, i.e. motor learning, is defined by the Medical Dictionary as “any of the processes related to the acquisition and retention of skills associated with movement. They are influenced by practice, experience, and memory” [19]. While driving, the driver builds up muscle memory as they gain experience with physical actions. Actions that are essential to driving – such as changing gear, indicating, steering, keeping the distance to the car in front and lane keeping – therefore become more ‘automatic’, i.e. the driver does not necessarily need to think consciously about every action before executing them [20].
In relation to interface design, the potential benefits of muscle memory have been explored. Van Dam [21] highlighted the development and use of muscle memory in his discussion about WIMP GUIs (graphical user interfaces based on windows, icons, menus, and a pointing device, typically a mouse). He suggests that multilevel radial menus would allow users to exploit muscle memory without having to look at the menu.
that there should be “sufficient consistency in the environment so that haptic feedback is effective and muscle memory can develop” [24]
.
In a driving context, muscle memory would, in theory, enable a driver to move their hand directly from the steering wheel to an in-vehicle control without the need for vision. It is easier to develop muscle memory when using traditional hard in-vehicle controls as the driver may learn the approximate location of the button and then use tactile cues (i.e. touching the buttons and receiving physical feedback) to help calibrate the finer movements as well as differentiate one target from another. This is not possible with touch screen displays as they typically lack tactile feedback [25]. Layouts may also be dynamic, which means that button locations could change between different menu screens. This makes it more difficult for the driver to develop muscle memory for specific locations on a touch screen display. However, it is possible that some muscle memory will develop to guide a driver’s hand from the steering wheel to a touch screen and possibly to a specific area of the screen where they recall a particular button being located, based on repeated and regular use. This will contribute to reducing button selection times with practice and lead to reductions in the need for vision over time. Previous literature suggests that vision is important in learning; however, it becomes less important for well-learned tasks [26].
2. Aims and Hypotheses
The study discussed in this paper aimed to investigate the use of an in-vehicle touchscreen and thereby identify the distinct contributions of peripheral vision and muscle memory, and their impact on task time. Task time was used as a measure to identify visual demand as it has been an approach that has been adopted by other studies in the literature. Various research has shown that task time correlates with Total Glance Time and Mean Glance Frequency [27], [28]. Four hypotheses were proposed based on previous research and understanding in these areas:
• During muscle memory conditions, task time (time to select a single button) will initially be high, however this will gradually decrease due to the muscle memory build up over several exposures; • Small button muscle memory condition will have
the highest task time, as this is expected to be the most difficult task which will require more effort; • As peripheral vision does not change throughout
each condition (participants were asked to focus on the car ahead - hence peripheral vision stayed constant) it is expected that task time for peripheral vision conditions (small, medium and large button size) will stay constant within each condition; • Overall, peripheral vision conditions will have a
lower task time compared to the muscle memory conditions, as participants will be able to ‘see’ the buttons on the screen
3. Method
3.1. Participants
Twenty-five (12 Female, 13 Male) participants took part from Virginia Polytechnic Institute and State University, where the study took place (mean age = 25.5; s.d. 5.3 years). These participants were recruited using posters placed around the Industrial and Systems Engineering (ISE) department. All participants held a US driver’s license and had experience driving on US roads for at least 1 year (mean time with license = 7 years; mean annual mileage = 7594 miles). All participants also reported that they had experience using touch screen devices such as smartphones and tablets.
3.2. Design
The study followed a within-subjects design. There were two independent variables; interaction mechanism (muscle memory, peripheral vision) and button size (small 6x6cm, medium 10x10cm and large 14x14cm). As a result, all participants had to complete six trials, which took approximately 40 minutes in total. The order of the drives was counterbalanced for each participant to avoid any learning effects.
Throughout the study participants were asked to sit in a stationary left-hand drive simulator – this study did not involve any driving – and interact with the touch screen that was placed on the right-hand side of the steering wheel. The touch screen task consisted of a single, white, square button appearing on the touch screen one at a time (repeated 24 times) and participants were asked to press the button as quickly and accurately as possible. To maximise contrast, the background colour for the touchscreen was black. Within each condition, the location and the size of the button stayed the same to ensure they developed some muscle memory. Conversely, between conditions the size and the location changed. However this was a control variable and not an independent variable. Participants also heard two different audio tones during their interaction with the screen; one tone to indicate the button had appeared on the screen and another to indicate that they had pressed the button correctly. This confirmation feedback ensured that motor learning would occur as participants would know to aim towards the same area of the screen on subsequent presentations of the button. As soon as the participant pressed the button, the presentation moved onto a blank screen for 5 to 10 seconds before moving onto the next button screen.
technique was also used for the muscle memory conditions to ensure that participants were not moving their head during the interaction with the display.
Figure 1. The glasses participants wore during the muscle memory conditions
Participants were asked to fill out a NASA TLX questionnaire [30] at the end of each condition. The questionnaire consisted of six different measures: mental demand, physical demand, temporal demand, performance, effort, and frustration. They were asked to rate each measure on a scale of 1 to 21. For all measures except the performance measure, 1 represented a low (good) score and 21 represented a high (poor) score.
3.3. Apparatus and Stimuli
[image:4.612.350.529.419.558.2]The fixed-based, medium-fidelity simulator based in the COGENT Lab in the ISE department at Virginia Tech University was used for this study. The simulator was formed of the front half of a left-hand drive 2014 Mini Cooper positioned in front of a curved screen providing approximately 270° viewing angle. One Epson PowerLite Pro G6900WU NL overhead projector was used to project the driving scenario onto the curved screen. A static image of the simulated driving environment was created using a software called MiniSIM [31] which was developed by the National Advanced Driving Simulator and the University of Iowa.
Figure 2. Driving simulator
As noted above, the driving simulator was only used to create a static driving scene image (see Figure 2), and participants were not required to drive in this study. The image presented consisted of the host car parked on the side of the road on a motorway with another car with flashing lights in front of them. The flashing lights were used to keep participants focus on the car in front to enforce the use of peripheral vision to locate and press the buttons appearing on the screen during the peripheral vision conditions.
A Microsoft Surface 3 tablet was used as the in-vehicle touch screen (see Figure 3). This was in the centre console of the car to the right-hand side of the steering wheel. PowerPoint 2013 was used to create the button interface. The buttons that appeared on the screen were white squares (small, 6x6cm; medium, 10x10cm; large, 12x12cm) on a black background. The screen did not advance onto the next screen until the participant pressed the button. An audio tone was played when the button appeared on the screen and audio feedback was given when the button was pressed. A single button was displayed on the touch screen at a time. The different button sizes were based on pilot work which was conducted to ensure all buttons were of a size where they could be detected – but not necessarily located – in peripheral vision within the simulator vehicle when looking straight ahead. They were also dependant on the size of the screen used in the trial (25x17cm) which was an accurate representation of most recent touch screens available in vehicles such as Tesla Model S (17inch), BMW 5 series (10inch) and Jaguar XF (10inch).
Figure 3. In-vehicle touch screen
3.4. Procedure
Initially, participants were given an information sheet, consent form and a data capture questionnaire. The data capture questionnaire was used to capture basic participant information such as age, gender, driving experience, annual mileage, and experience with touch screens.
[image:4.612.93.258.537.704.2]allowed the researcher to make sure that the participants were focusing on the road scene as instructed. Participants were also not allowed to move the driver’s seat, but they could adjust the headrest, so they could rest their head against it comfortably to help in keeping their head still. They were asked to put their hands back on the steering wheel after each button press and to use their right hand to interact with the in-vehicle touch screen. They were instructed to complete each task as quickly and as accurately as possible. The study took an hour to complete and participants were given vouchers to compensate for their time.
4. Results
4.1. Task Time
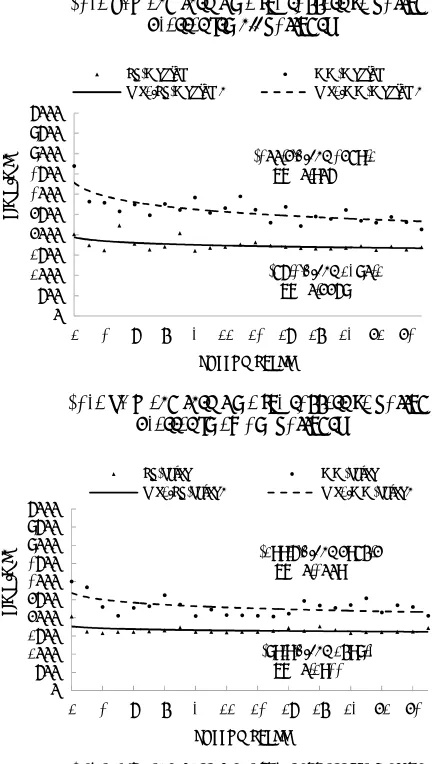
[image:5.612.320.536.57.439.2]Task times were used to compare performance in the completely non-visual condition (muscle memory) and the peripheral vision condition. Twenty-four repetitions of the button selection task were completed during each condition. To determine the theoretical point at which muscle memory potentially ceases to support peripheral vision for button selection operations, results were extrapolated. It is likely that task times for the muscle memory condition would plateau after a certain number of repetitions and follow a similar trend to the peripheral vision graph. It is worth noting that a shorter task time may be possible if participants were provided with full, foveal vision, but this will be at the expense of vision directed towards the primary driving task. The purpose of the investigation is to explore viable methods to interact with an in-vehicle touchscreen, without affecting (foveal) visual attention directed towards driving.
Figure 4. Mean task time for successive button presses (small buttons)
Figure 5. Mean task time for successive button presses (medium buttons)
Figure 6. Mean task time for successive button presses (large buttons)
The graphs (Figure 4, Figure 5, Figure 6) show the trend-line for task times of the two interaction mechanisms for the three different button sizes. There is a steeper decrease in muscle memory task time for small and medium buttons compared with the larger buttons. In addition, in comparison to muscle memory task time, peripheral vision task time stayed more constant within each condition. For both interaction mechanisms, small button presses took longer to execute than medium and large buttons. Although error rates were not recorded during the study, observations suggested that, the number of button press attempts for small buttons was higher, as participants had difficulties in pressing the small buttons on their first attempt.
y = -39.11ln(x) + 2078.5 R² = 0.0449
y = -305.6ln(x) + 3658.6 R² = 0.4202
0 500 1000 1500 2000 2500 3000 3500 4000 4500 5000
1 3 5 7 9 11 13 15 17 19 21 23
T
IM
E
(
M
S
)
BUTTON PRESS
PV-Small MM-Small
Log. (PV-Small) Log. (MM-Small)
y = -85.3ln(x) + 1940.1 R² = 0.2254 y = -300.2ln(x) + 3286.1
R² = 0.605
0 500 1000 1500 2000 2500 3000 3500 4000 4500 5000
1 3 5 7 9 11 13 15 17 19 21 23
T
IM
E
(
M
S
)
BUTTON PRESS
PV-Medium MM-Medium
Log. (PV-Medium) Log. (MM-Medium)
y = -46.6ln(x) + 1764.9 R² = 0.1633 y = -166.5ln(x) + 2687.2
R² = 0.3006
0 500 1000 1500 2000 2500 3000 3500 4000 4500 5000
1 3 5 7 9 11 13 15 17 19 21 23
T
IM
E
(
M
S
)
BUTTON PRESS
PV-Large MM-Large
Log. (PV-Large) Log. (MM-Large)
[image:5.612.72.284.439.571.2]Figure 7. Mean task time for each button size for both interaction mechanisms (error bars: Standard
Error)
A two-way repeated measures ANOVA was run to determine the effect of button size and interaction mechanism on task time. There was a largely statistically significant interaction between button size and interaction mechanism on task time, F(2, 46) = 12.052, p < .0005, partial η2 = 0.344, d = 1.448. Task time was higher for the muscle memory conditions 2638±60 ms compared to peripheral vision conditions 1798±18 ms. The difference of 840±49 ms was largely statistically significant, p < 0.0005,
η2 = 0.927, d = 7.127. Task time also significantly increased as button size decreased from small 2497±55 ms to medium 2173±41 ms and to large 1983±32 ms. The largely statistically significant differences in task time between the different button sizes are as seen in Table 1, p < 0.0005, η2 = 0.771, d = 3.669.
Table 1. Significant differences in task time between the three button sizes
(I) Button
Size
(J)
Button
Size
Mean
Difference
(I-J) (ms)
Std.
Error
(ms)
Small Medium 324.046 45.363
Large 514.295 42.912
Medium Small -324.046 45.363
Large 190.249 36.523
Large Small -514.295 42.912
Medium -190.249 36.523
4.2. NASA TLX
A two way-repeated measures ANOVA was performed to determine the effect of button size and interaction mechanism on NASA TLX measures. Both the interaction mechanism and button size had a largely significant effect on subjective workload, F(1, 24) = 59.703, p < 0.0005, ꞃ2= 0.713 and F(1.574, 37.767), p < 0.0005, ꞃ2=0.422, d = 1.709. NASA TLX results were higher for muscle memory conditions, 42±3 than peripheral vision conditions, 25±2. The difference of 17±2 was largely statistically significant, p < 0.0005, η2 = 0.713, d = 3.152.
[image:6.612.321.538.159.293.2]They were also higher for smaller buttons, 40±3 than medium, 30±2 and large buttons, 30±3. The differences of 9±2 between small and medium buttons and 10±2 between small and large buttons were statistically significant, p < 0.0005 and p = 0.001, η2 = 0.553, d = 2.225. These results show that muscle memory conditions with smaller buttons were perceived to be significantly more demanding by participants (Figure 8).
Figure 8. NASA TLX summed scores for all six conditions (error bars: Standard Error)
5. Discussion
In this paper, we studied the relative effects of two in-vehicle display interaction mechanisms – muscle memory and peripheral vision, and observed the effect of button size on task time. Subjective measures were also collected regarding the demand of each condition. The overall aim was to investigate the relative impact of alternative interaction mechanisms that could help support ‘non-visual’ operation of in-vehicle touch screens.
The first two hypotheses concerned muscle memory. Muscle memory (motor learning) is a key component of selection tasks and is developed or ‘learned’ over a series of repetitions [19]. The results of this study show that for completely ‘non-visual’ operation of in-vehicle touch screen controls, a muscle memory effect is evident, with results supporting the first two hypotheses, i.e. task time reduced over repeated exposures and the small button muscle memory condition had the highest task-time. In addition, the benefits of muscle memory resulted in a maximum effect over time, i.e. task-time plateaued. This is likely to represent the theoretical number of repetitions after which the benefit from repeated exposure no longer exists, and the motor operation reduces to a constant duration. This duration represents the inherent physical demand of the task.
The extrapolated results for button selection times for the two independent variables (muscle memory and peripheral vision interaction) had a difference in the number of repetitions required for muscle memory task time to reach to similar levels of peripheral vision task times depending on button size. The number of repetitions required for the smaller buttons represent a theoretical ‘maximum’ limit to performance as they represented the most difficult tasks. It would be expected that for larger buttons the number of practices required to reach a constant operation time would be lower. Nevertheless, the results for
0 500 1000 1500 2000 2500 3000
Small Medium Large
T
A
S
K
T
IM
E
(
M
S
)
BUTTON SIZE
Peripheral Vision Muscle Memory
0 20 40 60 80 100
TRIAL CONDITION
[image:6.612.80.282.445.593.2]the large button size condition did not support this hypothesis. This may have been due to the large button press task being too easy from the outset for the user to develop any learning effects. As a result of this, task time was also relatively constant for large buttons compared to small and medium buttons. Another explanation for this unexpected result might be that large buttons covered a greater surface area on the touch screen, which meant that participants were not necessarily pressing the same spot on the button repeatedly but still making successful selections. Hypotheses 3 and 4 concerned peripheral vision. As participants were asked to focus on the vehicle ahead, there was no change in the field of their peripheral vision throughout. As hypothesised, task time for peripheral vision conditions stayed relatively constant during each condition (hypothesis 3). There was an increase in task time as the button size decreased (Figure 7). This was likely to be a result of larger buttons being seen more easily in participants’ peripheral vision. As expected, for interfaces that utilise peripheral visual processing (i.e. located in a position that enables the driver to view them in their peripheral vision) there were no learning effects evident and operation times remained fairly constant over time (in contrast, learning effects were evident during the muscle memory conditions). This suggests that peripheral vision can be utilised for successfully making simple button selections on in-vehicle touch screens, thereby allowing drivers to keep their eyes on the road.
Also, the extrapolated data demonstrated that the number of repetitions it would take for muscle memory to plateau and offer the same benefits as peripheral vision (i.e. intersection points on Figure 4, Figure 5, Figure 6) is very high. This suggests that realistically the use of muscle memory to achieve non-visual interaction with in-vehicle touchscreens would not be an efficient strategy. For this to be achieved it is also assumed that the driver would be pressing the same button repeatedly for the given number of times. However, in a realistic driving environment the driver would not be required to press the same button uninterruptedly so regularly. Nevertheless, ‘relative’ effects revealed by the data are still of value.
Overall, results suggest that in situations where peripheral vision interaction is not possible (e.g. due to the in-vehicle display being located outside of a driver’s peripheral vision or if peripheral vision is not available due to high demands in primary driving tasks [32]), drivers may still be able to select buttons non-visually via motor memory. However, this will be dependent on repeated exposure and may therefore take considerable time to acquire. Consequently, such benefits are limited.
Moreover, the results of this study are limited to single button selection operations. It is likely that more repetitions would be required to realise the full benefits of muscle memory (i.e. reduce task time to a constant level) when more buttons are present on a single screen. This is because participants would need to ‘memorise’ which button was in which location. This limits the usefulness of these results for designers of in-vehicle touch screens, but we believe that this study has shown the potential for in-vehicle interfaces to be placed and operated within a driver’s periphery, and highlighted the learning effects associated with completely ‘non-visual’ button selections. However, it is acknowledged that using foveal vision to
locate the buttons would likely have reduced task times further.
6. Conclusion and Future Work
Overall, the results of the study show that it is possible for drivers to interact with in-vehicle touch screens using peripheral vision to some extent, but the benefits of muscle memory are less conclusive. Although it is not expected that drivers will be able to complete all touch screen tasks purely based on peripheral vision, it is believed that designing such displays to accommodate peripheral vision interaction could encourage drivers to keep their eyes on the road for some aspects of the interaction. For example, drivers could be given the option to customise their touch screen so that the icons for commonly used functions during driving are on the side of the touch screen that would allow peripheral vision interaction. Alternatively, the contrast levels could be increased, or specific colours could be used to accommodate peripheral vision.
In further work we aim to include the effect of foveal vision on task time alongside peripheral vision and muscle memory. It will aim to identify a combination of appropriate interface characteristics (colour, number of buttons, contrast, etc.) that would accommodate peripheral vision interaction. Future work including the current study will provide us with a better understanding of the strategies adopted by drivers when interacting with IVIS. Further investigations could also consider how generalizable the results from the current study are for physical buttons where peripheral vision and muscle memory are still involved as interaction mechanisms. For instance, research could investigate the precise role of tactile feedback when visually locating traditional in-vehicle buttons.
7. Acknowledgements
We would like to thank Joe Gabbard and Missie Smith from Virginia Polytechnic Institute and State University Industrial and Systems Engineering department for allowing us to use their facilities and supporting the experiment.
8. References
[1] J. D. Lee, K. L. Young and M. A. Regan, “Defining Driver Distraction,” in Driver Distraction: Theory, Effects and Mitigation, CRC Press, Taylor and Francis Group, 2008, pp. 31-40.
[2] K. Young, M. Regan and M. Hammer, “Driver distraction: A review of the literature,” Distracted Driving, pp. 379-405, 2007.
[3] S. G. Hosking, K. Young and M. A. Regan, “The effects of text messaging on young novice driver performance,” Monash University Accident Research Centre, 2006.
[4] K. H. Beck, F. Y. and M. Q. Wang, “Cell phone users, reported crash risk, unsafe driving behaviors and dispositions: A survey of motorists in Maryland,”
Journal of safety research, vol. 38, no. 6, pp. 683-688, 2007.
[5] D. Lamble, M. Laakso and H. Summala, “Detection thresholds in car following situations and peripheral vision: Implications for positioning of visually
demanding in-car displays,” Ergonomics, vol. 42, no. 6, pp. 807-815, 1999.
[6] J. Engström, E. Johansson and J. Östlund, “Effects of visual and cognitive load in real and simulated motorway driving,” Transportation Research Part F: Traffic Psychology and Behaviour, vol. 8, no. 2, pp. 97-120, 2006.
[7] S. Rümelin and A. Butz, “How To Make Large Touch Screens Usable While Driving,” in Automotive User Interfaces and In-Vehicular Applications, Eindhoven, 2013.
[8] B. Reimer, B. Mehler and B. Donmez, “A study of young adults examining phone dialing while driving,”
Transportation Research Part F, vol. 24, pp. 57-68, 2014.
[9] C. Harvey and N. A. Stanton, Usability evaluation for in-vehicle systems, CRC Press, 2013.
[10] G. E. Burnett and S. M. Joyner, “An assessment of moving map and symbol-based route guidance systems,” Ergonomics and safety of intelligent driver interfaces, pp. 115-137, 1997.
[11] H. Hada, “Drivers' visual attention to in-vehicle displays: effects of display location and road types,” UMTRI, 1994.
[12] A. L. Eren, G. Burnett and D. R. Large, “Can in-vehicle touchscreens be operated with zero visual demand? An exploratory driving simulator study,” in
4th International Conference on Driver Distraction and Inattention, Sydney, 2015.
[13] W. J. Horrey and C. D. Wickens, “Focal and ambient visual contributions and driver visual scanning in lane keeping and hazard detection,” Proceedings of the Human Factors and Ergonomics Society Annual Meeting, vol. 48, no. 19, 2004.
[14] D. Crundall, G. Underwood and P. Chapman, “Driving experience and the functional field of view,”
Perception, vol. 28, no. 9, pp. 1075-1087, 1999. [15] R. R. Mourant and T. H. Rockwell, “Strategies of
visual search by novice and experienced drivers,”
Human factors, vol. 14, no. 4, pp. 325-335, 1972. [16] M. Land and J. Horwood, “Which parts of the road
guide steering,” Nature, vol. 377, no. 6547, 1995. [17] H. Summala, T. Nieminen and M. Punto, “Maintaining
lane position with peripheral vision during in-vehicle tasks,” Human Factors: The Journal of the Human Factors and Ergonomics Society , vol. 38, no. 3, pp. 442-451, 1996.
[18] H. Summala, D. Lamble and M. Laakso, “Driving experience and perception of the lead car's braking when looking at in-car targets,” Accident Analysis & Prevention, vol. 30, no. 4, pp. 401-407, 1998.
[19] “Medical Dictionary. S.v. "motor learning.",” [Online]. Available:
http://medical-dictionary.thefreedictionary.com/motor+learning. [Accessed 22 June 2016].
[20] S. G. Charlton and N. J. Starkey, “Driving without awareness: The effects of practice and automaticity on attention and driving,” Transportation research part F: traffic psychology and behaviour, vol. 14, no. 6, pp. 456-471, 2011.
[21] A. Van Dam, “Post-WIMP user interfaces,” in
Communications of the ACM, 1997.
[22] K. Krol, C. Papanicolaou, A. Vernitski and M. A. Sasse, “Too Taxing on the Mind!” Authentication Grids are not for Everyone,” in International
Conference on Human Aspects of Information Security, Privacy, and Trust, 2015.
[23] K. E. MacLean, “Application-Centered Haptic Interface Design,” in Human and Machine Haptics, MIT Press, 1999.
[24] T. N. Smyth and A. E. Kirkpatrick, “A new approach to haptic augmentation of the GUI,” in Proceedings of the 8th international conference on Multimodal interfaces, 2006.
[25] A. Stevens, A. Quimby, A. Board, T. Kersloot and P. Burns, “Design guidelines for safety of in-vehicle information systems,” TRL Limited, 2002. [26] L. Proteau, R. G. Marteniuk, Y. Girouard and C.
Dugas, “On the type of information used to control and learn an aiming movement after moderate and
extensive training,” Human Movement Science, vol. 6, no. 2, pp. 181-199, 1987.
[27] O. Tsimhoni, “Effects of visual demand and in-vehicle task complexity on driving and task performance as assessed by visual occlusion,” UMTRI Human Factors, 1999.
[28] G. Paul, “Variations in task performance between younger and older drivers: UMTRI research on telematics,” Association for the Advancement of Automotive Medicine Conference on Aging and Driving, 2001.
[29] Visual Impairment North Eastt,
“http://www.vinesimspecs.com/,” Visual Impairment North Eastt, [Online]. Available:
http://www.vinesimspecs.com/. [Accessed 23 07 2017]. [30] S. G. Hart and L. E. Staveland, “Development of
NASA-TLX (Task Load Index): Results of empirical and theoretical research,” Advances in psychology, vol. 52, pp. 139-183, 1988.
[31] University of Iowa, “The National Advanced Driving Simulator,” [Online]. Available: https://www.nads-sc.uiowa.edu/sim_minisim.php. [Accessed 17 04 2017].
[32] T. Horberry, J. Anderson, M. A. Regan, T. J. Triggs and J. Brown, “Driver distraction: The effects of concurrent in-vehicle tasks, road environment
complexity and age on driving performance,” Accident Analysis & Prevention, vol. 38, no. 1, pp. 185-191, 2006.