Published online3 December 2003
Batesian mimics influence mimicry ring evolution
Daniel W. Franks
*and Jason Noble
Biosystems Group, School of Computing, University of Leeds, Leeds LS2 9JT, UK
Mathematical models of mimicry typically involve artificial prey species with fixed colorations or appear-ances; this enables a comparison of predation rates to demonstrate the level of protection a mimic might be afforded. Fruitful theoretical results have been produced using this method, but it is also useful to examine the possible evolutionary consequences of mimicry. To that end, we present individual-based evolutionary simulation models where prey colorations are free to evolve. We use the models to examine the effect of Batesian mimics on Mu¨ llerian mimics and mimicry rings. Results show that Batesian mimics can potentially incite Mu¨ llerian mimicry relationships and encourage mimicry ring convergence.
Keywords:mimicry rings; Batesian mimicry; Mu¨ llerian mimicry; evolutionary simulation modelling
1. INTRODUCTION
Mimicry theory dates to a few years after the publication ofThe origin of species(Darwin 1859), and the findings of Bates (1862) were presented as compelling evidence of evolutionary theory (Wallace 1866). However, Turner (1995, p. 131) states that ‘although mimicry is probably one of the most thoroughly explored exemplars [of (co)evolution] it is surprising what we do not know about it’. Mathematical models of mimicry have been useful theoretical tools for examining the costs and benefits to prey as a result of mimicry. They are usually used to examine predation levels on various artificial prey offixed colorations and thus to sketch out the probable evolution of mimetic relationships. However, the coevolutionary dynamics of, and interactions between, different types of mimetic prey have been little explored in models (although see Holmgren & Enquist 1999). Further, it has not been feasible to model mimicry rings (i.e. multi-species mimetic relationships) using such modelling approaches. To address the absence of work on the evolutionary dynamics of mimicry, we present individual-based evolutionary simulation models—in which prey colorations can evolve—to explore the effect of Batesian mimics on Mu¨ llerian mimicry relationships and mimicry rings.
2. THEORY
(a) Batesian mimicry
The hoverflyChrysotoxum festivumexhibits a black and yellow striped warning coloration despite being palatable to birds, and lacking a sting. This can be described as a parasitic relationship (see Wickler 1968) as themodel spec-ies, in this case bees or wasps, suffers from a dilution of the aversive effects of its coloration. The mimic, however, gains from the bluff and enjoys reduced predation without the need to evolve a costly defence such as a sting or toxin. This is known as Batesian mimicry (Bates 1862), which can be defined asa parasitic mimetic relationship between a palatable and a defended species. In this definition
*Author for correspondence ([email protected]).
Proc. R. Soc. Lond.B (2004)271, 191–196 191 2003 The Royal Society
‘defended’ refers to a natural defence from predators such as a sting or an unpleasant taste.
(b) Mu¨ llerian mimicry
Many different Heliconiusbutterflies share a conspicu-ous coloration, making an honest display as to their anti-predator defences (Mallet & Gilbert 1995). By sharing a coloration, fewer individuals from both species are sacri-ficed to a naive predator during its learning phase. Thus, both prey species mutually benefit from the relationship. Predators also typically benefit from a reduced educational burden (although see Speed 1993b). This is known as Mu¨ llerian mimicry (Mu¨ ller 1879). This mutualistic mim-icry is common among (but not between) many species of butterflies and bumble-bees, and occurs in vertebrates such as poison frogs (Symulaet al.2001). Mu¨ llerian mim-icry can be defined as a mutualistic mimetic relationship between two or more defended species.1
(c) Evolutionary dynamics
Predators generalize over their experiences, owing to predation strategies (Broweret al.1971) or fallible sensory systems. They can therefore mistake approximate mimics for their model. Thus, mimics typically receive more pro-tection as their mimicry becomes more refined (although see Johnstone 2002). Predators can discriminate between prey of sufficiently distinct colorations. For mimicry to evolve, therefore, an initial resemblance (in the eyes of the predator) is needed. This could be arrived at because of various factors such as random drift, large mutations (Turner 1988) or phylogenetic proximity.
The coevolutionary dynamics involved in these forms of mimicry differ (Turner 1987, 1995; see figure 1). Mu¨ ller-ian mimics generally convergeupon the same colour pat-tern; selection pressure typically causes both species to evolve ‘towards’ a middle-ground colour pattern.2
co-mimic co-mimic
convergence model mimic
[image:2.598.90.251.66.158.2]advergence
Figure 1. The difference in dynamics between Batesian and Mu¨ llerian mimicry. (Adapted from Turner 1995.)
Figure 2. Mimicry ring example. Illustration of three separate species of butterfly that all share the same pattern in a ‘yellow’ ring. (Adapted from Mallet & Gilbert 1995.) Note similarities and subtle differences in the patterns.
p. 66) state the evolutionary dynamics relevant to this work aptly: ‘... Batesian mimicry promotes continuous change in time, whereas Mu¨ llerian mimicry tends towards stabilization of common colour patterns’.
(d) Mimicry rings
Mimicry rings are Mu¨ llerian relationships between two or more species. Plowright & Owen (1980) showed that there are five different patterns of bumble-bee in north-west Europe, each constituting a mimicry ring of several species. Another example of a mimicry ring is the tiger pattern shared by different species ofHeliconiusbutterfly (Mallet & Gilbert 1995), which coexists alongside other ring patterns (see figure 2). It would presumably be highly profitable for a palatable species to invade these rings as a Batesian mimic, and some such relationships are known to exist. The coexistence of multiple mimicry rings within a geographical region raises a question as to why they do not all converge into a single ring for maximum defence from predators (Turner 1984; Mallet & Gilbert 1995).
3. MATERIAL AND METHODS
Mimicry rings have been little explored theoretically, and have not, to our knowledge, been modelled previously—probably owing to the difficulty that conventional mathematical or stochastic models would have in modelling the large and complex ecosystem required. Evolutionary simulation models, however, are a practical and promising approach to addressing such a task.
When developing simulations, it is useful to first work with a simpler model to which complex features can be added incrementally. Thus, we present an initial model that allows Batesian and Mu¨ llerian mimicry to evolve. Thereafter, we present a richer model and examine the effect of Batesian mim-ics on mimicry ring evolution.
4. A SIMPLE MODEL OF MIMICRY
(a) Artificial prey
Multiple populations of prey species were used in each model variation (which we shall refer to as experiments). Different species of prey were each assigned a fixed defence level. Each individual had a single gene: a value representing their phenotype or coloration. The color-ations were constrained to a ‘ring’ of values from 1 to 20 (where 20 loops back to 1 andvice versa).3 The distance
of one coloration from another represented their level of similarity.
(b) An artificial predator
A single predator was modelled with a simple reinforce-ment learning system. The predator’s experience of each coloration was represented by an attack probability; after consuming a prey item of a particular external coloration, the attack probability would be updated according to the defence level of the prey item. The predator generalized on the basis of experience and thus would also, to a lesser extent, update its scores for the closest neighbour color-ations (see equation (5.1)). The generalization in the sim-ple model was set to a threshold value of 4 (a value chosen to create a landscape of similar, less similar and distinct prey phenotypes). The attack probability gradually degraded back towards ambivalence at a constant rate of 2% per prey generation.
(c) Model conditions
For initial simplicity, in each generation the predator was presented with 30 binary forced-choice situations. Two individuals were randomly selected from across all prey populations present and the predator would make a probabilistic attack decision, based on its experience of each coloration. Random reproduction then took place among the surviving prey. Mutation was implemented as a uniform change of ±1 in the coloration, and the mutation rate was 0.03. All of the experiments were run over 5000 generations, and the populations of prey species were kept constant at 100. The main variable manipulated was the starting distance between prey species’ color-ations, to determine whether an initial chance resem-blance is required for the evolution of mimicry.
(d) Results
Figure 3 shows the results of two experiments in terms of the initial and final distances between prey species’ colorations. Experiment 1 was conducted using one palat-able and one defended species. Regardless of the starting distance between the two, Batesian mimicry evolved: the palatable species came to have the same or very similar coloration as the defended one. This was also true when the function to update the predator’s memory did not include generalization.
[image:2.598.51.286.207.315.2]0 1 2 3 4 5 6 7 8 9 10
0 1 2 3 4 5 6 7 8 9 10
final distance
[image:3.598.55.286.59.225.2]starting distance expt 1 expt 2
Figure 3. Final distance by initial distance between two prey species’ colorations; each point is averaged over 40 runs. The dotted line shows zero change in coloration.
In experiment 3 (no graph shown) simultaneous Mu¨ ll-erian and Batesian mimicry was investigated by including two defended and one palatable species. The results showed that the coloration of the palatable species moved towards that of one of the defended species (i.e. Batesian mimicry). Interestingly, this in turn drove the model spec-ies around the phenotypic ring and resulted in Mu¨ llerian mimicry with respect to the second defended species, regardless of their initial phenotypic distances (when plot-ted the results look similar to those of experiment 1).
Further experiments were carried out in which alterna-tive prey were available to the predator. This had no quali-tative effect on the results.
(e) Discussion
Experiment 1 shows that Batesian mimics will close in on the model regardless of how different their initial phenotypes are, and regardless of the predator’s ability to generalize. This shows that there is more selective pressure for the palatable species to resemble the model than there is for the model to diverge. However, there is an additional reason why the mimic is successful in ‘catching’ the model: before mimicry has evolved, palatable individuals gain an inherent fitness benefit for mutating away from the average (modal) phenotype of their species. This is because, when presented with a choice, the predator would be more likely to select a well-known phenotype than a newer one.
The results of experiment 2 show that Mu¨ llerian mim-icry relies on an initial resemblance between the species involved. Such initial resemblance might be caused by any number of factors, such as sexual selection, random drift, phylogenetic similarity and so forth (it should be noted that the particular resemblance threshold found in the experiment—in this case four units on the phenotypic ring—is of course determined by the nature of the pred-ator’s generalization).
Experiment 3 demonstrates an important finding: that pressure owing to Batesian mimicry can be a force that drives Mu¨ llerian mimics together despite a lack of initial resemblance.
5. A MODEL OF MIMICRY RING EVOLUTION
The results in § 4d suggest that Batesian mimics can influence Mu¨ llerian mimicry relationships. This implies that Batesian mimics may influence the formation of mim-icry rings. In the previous simulation the prey colorations were represented by only a single gene. A richer model will now be presented which incorporates multiple dimen-sions of prey coloration, and explicitly examines mimicry ring evolution.
(a) Artificial prey
Artificial prey were modelled as populations of individ-uals with a fixed defence level and a genome representing their coloration. Multiple populations of prey were used in each experiment, and each was assigned a palatability level on a scale between zero and 1 (most to least defended, respectively). The genome consisted of multiple genes with values compositely representing prey color-ation; most of the results presented here refer to the two-gene case. The two-genes were constrained tocontinuousvalues from 1 to 200 and the Euclidean distance of one color-ation from another represented the degree of similarity between phenotypes.
(b) Artificial predators
A population of predatory individuals was modelled with a Monte Carlo reinforcement learning system, as used in a mimicry model by Turneret al. (1984). Pred-ators were offered 10 prey per prey generation, which they could either consume or reject. Through experience, the predators could learn to associate prey colorations with a level of defence. As such, they could adapt their prob-abilities for each coloration as they experienced them, according to the defence level of the consumed prey. The chosen reinforcement learning system of Turneret al.was modified to include generalization, to capture the notion that predators will treat similar colorations in a similar way. Predators were modelled as having an attack rating (see equation (5.1)) for each prey coloration. The formula used for generalizing and updating these attack ratings after consuming a prey item was
Pt⫹1=W(Pt⫹␣( ⫺Pt)). (5.1)
This produces an updated attack ratingPt⫹1, based on the
rating at the previous time step (Pt), for colorations at a
given similarity distance from the consumed prey whose defence level was. The␣term denotes a variable learn-ing rate and is calculated uslearn-ing
␣=0.5⫹| ⫺0.5|. (5.2)
Wis a weighting (used for generalization), which is calcu-lated according to the distance of a coloration from the consumed prey’s coloration. If D⬎G then W=0 (i.e. generalization is finite in extent) otherwise
W=G⫺D
G , (5.3)
whereGis the predator’s generalization rate andDis the Euclidean distance between the coloration and the con-sumed prey’s coloration.
the attacked prey (equations (5.1) and (5.2)). Predators’ memories are updated by generalizing over similar color-ations within their generalization range, moving outward from the coloration of the attacked prey item (equation (5.3)). This update can be visualized as a cone shape, where the cone tip represents the update for the consumed coloration. The further the coloration is from the one con-sumed, the less it is updated.
Attack ratings were transformed with the logistic func-tion to give a probability of attack, such that predators were decisive about prey for which they had a relatively strong opinion. Predators made attack decisions by com-paring the attack probability to a pseudo-random number in the range of zero to 1. Thus, it was possible for pred-ators to become averse to eating some or even all prey species. We therefore assume that an additional food source is available; predators in the model will not starve even if they refuse all prey items. Predators’ memory degraded over time by gradually reverting back towards ambivalence (i.e. an attack probability of 0.5) at a constant rate of 2% per prey offering (as used by Turner et al. (1984)). Random asexual reproduction then took place among the surviving prey. After every prey generation the oldest predator would die and be replaced with a new and naive predator.
(c) Model conditions
All of the conditions were run over 200 000 generations and prey populations were kept constant after repro-duction. Predator generalization (G) was set to a value of 8 (this value should be considered relative to the abstract phenotypic space, which was 200 units across in each dimension). Stepwise mutation (choosing a random gene to mutate) is commonly used in simulation models, but it has an inherent bias towards orthogonal directions in multi-dimensional genetic space. This could influence the results of the simulation. To overcome this problem a mutation operator was implemented as follows.
(i) A random direction in the multi-dimensional space was chosen by selecting a random number from a normal distribution (0 mean, unit variance) for each gene.
(ii) The distance was then selected over a normal distri-bution (0 mean, unit variance) to allow for varying mutation sizes, with a bias towards smaller ones. (iii) The offspring were then mutated in the selected
direction at the selected distance.
Note that the mutation operator took place onevery off-spring. The result is that most, but not all, offspring are slight variants of their parent with the possibility of rare extreme variants. The issue of mutation bias due to unnatural boundaries (Bullock 1999) was handled using a wrap-around function (making the values 0.0 and 200.0 synonymous) on prey mutations and predator generaliz-ation. Attending to such implementation issues is important for avoiding artefactual results in models. They are of particular significance to mimicry models as random drift and mutation are vital to the initiation of mimicry. We consider this type of mutation operator appropriate for this type of simulation, in which there is no distinction between genotype and phenotype, and where the prey rep-resentations are additive genetic in character.
0 50 100 150 200
0 50 100 150 200
gene 2
[image:4.598.311.542.56.227.2]gene 1
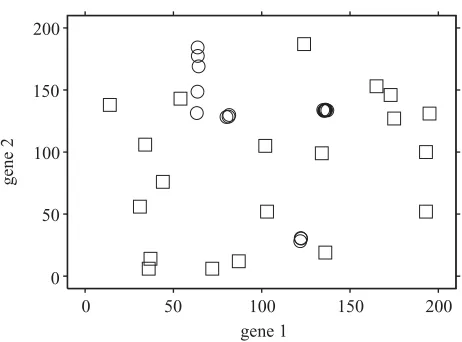
Figure 4. Initial random and final evolved position of each prey species’ modal coloration for a typical run with equal population numbers. Squares represent starting colorations and circles represent final colorations.
For our purposes, a mimetic relationship is defined as a Euclidean distance of less than 15 between the modes of two species. The distance of 15 was an approximation calculated by multiplying the generalization rate by 2 and deducting 1 (which gives the minimum distance of over-lapping generalization) and then multiplying that by 1.5 (to allow for spread of individuals within a species and generalization over each of them). This gave clusters that matched those found through manual observation of the results.
(d) Experiment
We ran the simulation with various numbers of palat-able prey (i.e. potential Batesian mimics). For the results given in § 5f, the prey coloration was represented by two genes. A random initial colour pattern was chosen for each prey species at the start of each run. A defence level of 0.9 and 0.1 was given to defended and palatable prey, respectively. All prey population sizes were kept constant at 300. The simulation results for each experiment were recorded over 20 runs, after which the number of coexisting mimicry rings were tallied.
(e) Sensitivity analysis
The same experiments were also performed with four genes (and an equivalent mutation rate and range of gen-etic values giving the same sized space of colorations as the two-gene case, using the generalization radius as a ref-erence point). The four-gene results were not significantly different from those presented here. The two-gene results are representative of our findings and are presented here for ease of conveying and visualizing the results. A sensi-tivity analysis (systematically varying the values of some key parameters) showed that the results are robust. The results of the analysis can be found in electronic Appendix A available on The Royal Society’s Publications Web site.
(f) Results
0 50 100 150 200
0 50 100 150 200
gene 2
[image:5.598.53.287.57.227.2]gene 1
Figure 5. Initial random and final evolved position of each prey’s modal coloration for a typical run with four palatable species added. Squares represent starting coloration and circles represent final colorations. Palatable species are not shown; defended species form two large rings and three small rings. Notice how there are fewer rings when palatable species are present.
1 2 3 4
0 1 2 3 4 5 6 7 8 9 10
number of rings (average of 40 runs)
number of Batesian mimics
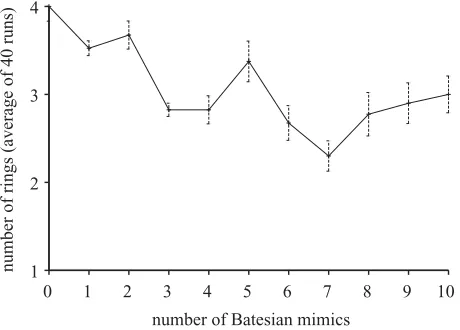
Figure 6. The average number of coexisting mimicry rings formed when a various number of palatable (potential Batesian mimics) prey populations are present
final colorations are clustered) and the number of rings or clusters is smaller in figure 5. The latter result indicates that Batesian mimics have encouraged the formation of a smaller number of large mimicry rings.
Figure 6 shows that as the number of palatable prey species present increases up to three, the number of mim-icry rings decreases. Adding more than four palatable species typically results in a number of mimicry rings not significantly different from adding just four palatable spec-ies.
A statistical comparison of the number of mimicry rings found in each of the two experiments indicated a signifi-cant difference (t=5.07,p⬍0.001) with more rings being found with no palatable prey added than with four.
(g) Discussion
When no palatable species were present in the model ecosystem (i.e. there was no possibility of Batesian mimicry) multiple mimicry rings evolved. A further exam-ination of the results showed that in all runs there is little
change from generation 150 000 to 200 000. This long-term stability occurreddespitethe fact that mutation rates were high (every offspring was a mutant) and variation in prey coloration was cost free. If multiple mimicry rings coexist and do not merge into a single ring despite these conditions, we can see that individual rings, once formed, are capable of maintaining their identity in the face of per-turbations owing to random drift. The results complement explanations for the diversity of mimicry rings in nature (see Turner 1977; Sheppardet al.1985), which suggests that the colorations of different mimicry rings may be so dissimilar that the rate of major mutations that could allow a species to swap rings tends towards zero.
The results of introducing palatable species show that Batesian mimics can influence the evolutionary conver-gence of mimicry rings. In the model, palatable species inevitably become Batesian mimics and chase their respective mimicry rings through cycles of colorations, increasing the chance that two mimicry rings might move within convergence range of each other. There is also a threshold over which an increase in the number of palat-able species does notfurtherreduce the number of mimicry rings. This is because, although Batesian mimics can entice Mu¨ llerian relationships, an excess of Batesian mim-ics can break up or prevent them (Poughet al.1973). We verified this by running the simple simulation with an excess of Batesian mimics. The result was that Mu¨ llerian mimicry almost never occurred with respect to two defended species.
6. CONCLUSION
The results of both simulations suggest that Batesian mimics can promote Mu¨ llerian relationships and, further-more, influence mimicry ring evolution. This finding has empirical consequences. If Batesian mimics drive defended species towards Mu¨ llerian mimicry, it follows that larger Mu¨ llerian mimicry rings should be expected to have a proportionally greater number of Batesian parasites than will smaller rings.
Finally, we would echo a question raised by J. Turner (personal communication). Given that Batesian mimicry occurs so readily in both of the simulations presented, why is it not more common in nature? It seems probable that some factors acting against, or as an alternative to, the formation of Batesian mimicry relationships need to be further studied.
This work has benefited from conversations with S. Bullock, D. Harris, A. Jackson and J. Turner. The authors thank three anonymous referees for their fruitful comments and L. Mitch-ell for assistance with artwork.
ENDNOTES
1Speed (1993a) has also described quasi-Mu¨ llerian mimicry. Although this and other exotic forms of mimicry may well be important in nature, for the purpose of this paper we have modelled only classical mimicry relationships.
2Although this is notalwaystrue; a new immigrant defended prey species might adverge upon abundant existing defended prey.
[image:5.598.56.286.330.495.2]REFERENCES
Bates, H. W. 1862 Contributions to an insect fauna of the Amazon valley. Lepidoptera: Heliconidae. Trans. Linn. Soc. Lond.23, 495–566.
Brower, L. P. & Brower, J. V. Z. 1972 Parallelism, conver-gence, diverconver-gence, and the new concept of advergence in the evolution of mimicry. In Ecological essays in honour of G. Evelyn Hutchinson, vol. 44 (ed. E. A. Deevey), pp. 59–67. Transactions of the Connecticut Academy of Science. Brower, L. P., Alcock, J. & Brower, J. V. Z. 1971 Avian feeding
behavior and the selective advantage of incipient mimicry. In Ecological genetics and evolution, essays in honour of E. B. Ford(ed. R. Creed), pp. 261–274. Oxford: Blackwell Scien-tific.
Bullock, S. 1999 Are artificial mutation biases unnatural? In Fifth European Conference on Artificial Life(ECAL99) (ed. D. Floreano, J.-D. Nicoud & F. Mondada), pp. 64–73. Heidel-berg: Springer.
Darwin, C. 1859The origin of species by means of natural selec-tion. London: John Murray.
Holmgren, N. & Enquist, M. 1999 Dynamics of mimicry evol-ution.Biol. J. Linn. Soc.66, 145–158.
Johnstone, R. 2002 The evolution of innacurate mimics. Nature418, 524–526.
Mallet, J. & Gilbert, L. E. 1995 Why are there so many mim-icry rings? Correlations between habitat, behaviour and mimicry in Heliconius butterflies. Biol. J. Linn. Soc. 55, 159–180.
Mu¨ ller, F. 1879 Ituna andThyridia; a remarkable case of mim-icry in butterflies. Trans. Entomol. Soc. Lond. May 1879, xx–xxix.
Nur, U. 1970 Evolutionary rates of models and mimics in Batesian mimicry.Am. Nat.104, 477–486.
Plowright, R. C. & Owen, R. E. 1980 The evolutionary signifi-cance of bumblebee color patterns: a mimetic interpretation. Evolution34, 622–637.
Pough, F. H., Brower, L. P., Meck, H. R. & Kessell, S. R. 1973 Theoretical investigations of automimicry: multiple trial learning and the palatability spectrum.Proc. Natl Acad. Sci. USA70, 2261–2265.
Sheppard, P. M., Turner, J. R. G., Brown, K. S., Benson, W. W. & Singer, M. C. 1985 Genetics and the evolution of Muellerian mimicry inHeliconiusbutterflies.Phil. Trans. R. Soc. Lond.B308, 433–607.
Speed, M. P. 1993a Muellerian mimicry and the psychology of predation.Anim. Behav.45, 571–580.
Speed, M. P. 1993b When is mimicry good for predators? Anim. Behav.46, 1246–1248.
Symula, R., Schulte, R. & Summers, K. 2001 Molecular phylogenetic evidence for a mimetic radiation in Peruvian poison frogs supports a Mu¨ llerian mimicry hypothesis.Proc. R. Soc. Lond. B268, 2415–2421. (DOI 10.1098/rspb. 2001.1812.)
Turner, J. R. G. 1977 Butterfly mimicry: the genetical evol-ution of an adaptation.Evol. Biol.10, 163–206.
Turner, J. R. G. 1984 Mimicry: the palatability spectrum and its consequences. InThe biology of butterflies, Royal Entomo-logical Society of London Symposium. no. 11 (ed. R. I. Vane-Wright & P. R. Ackery), pp. 141–161. New York: Academic.
Turner, J. R. G. 1987 The evolutionary dynamics of Batesian and Mullerian mimicry: similarities and differences. Ecol. Entomol.12, 81–95.
Turner, J. R. G. 1988 The evolution of mimicry: a solution to the problem of punctuated equilibrium. Am. Nat. 131, S42–S66.
Turner, J. R. G. 1995 Mimicry as a model for coevolution. In Biodiversity and evolution(ed. R. Arai, M. Kato & Y. Doi), pp. 131–150. Tokyo: National Science Museum Foun-dation.
Turner, J. R. G., Kearney, E. P. & Exton, L. S. 1984 Mimicry and the Monte Carlo predator: the palatability spectrum and the origins of mimicry.Biol. J. Linn. Soc.23, 247–268. Wallace, A. R. 1866 On the phenomena of variation and
geo-graphical distribution, as illustrated by the papilionidae of the Malayan region.Trans. Linn. Soc. Lond.35, 1–72. Wickler, W. 1968 Mimicry in plants and animals. London:
Wiedenfeld and Nicholson.