Prepared using sagej.cls [Version: 2016/06/24 v1.10]
Improving Indoor Air Quality Using
Dynamic Insulation and Activated
Carbon in an Air Permeable Ceiling
Journal Title XX(X):15 ©The Author(s) 0000 Reprints and permission:
sagepub.co.uk/journalsPermissions.nav DOI: 10.1177/ToBeAssigned www.sagepub.com/
Mohd Firrdhaus Mohd Sahabuddin1, Stirling Howieson1
Abstract
Indoor air pollution has proven negative impacts on the urban population in many developing countries. In Kuala Lumpur, high-rise housing programs are not addressing IAQ and thermal comfort. As household incomes rise, residents are resorting to retro-fitting wall mounted split, air conditioning units; a strategy that is neither cost nor carbon effective. This paper reports on the results of computer modeling in conjunction with scale model trials (1:5) of a ’Dynamic-Hybrid Air Permeable Ceiling’ (DHAPC) designed to filter, cool and dehumidify, the incoming air mass. This filter membrane, when combined with activated charcoal, reduced carbon monoxide, sulphur dioxide, benzene and particulate levels by up to 90%. These techniques now require to be replicated at 1:1 scale, however, the initial data suggests that such an approach, could make a major contribution to improving indoor air quality and thermal comfort with a much reduced carbon penalty.
Keywords
Indoor air quality, dynamic insulation, air permeable ceiling, activated charcoal, high-rise housing
Practical Application: Air pollution is now being recognised as having major negative impacts on public health. The use of insulation, as a large area and volume air filter, would appear to be a highly effective technique to reduce particulate matter, and when combined with activated charcoal that absorbs/adsorbs toxic gasses, can significantly improve indoor air quality in cities across the world that are presently exceeding WHO air quality guidelines.
Introduction
The World Health Organisation (WHO) has established that one in nine deaths (7 million per annum) are caused by fine particulate air pollution1, with 91% of the world’s population living in cities where pollution levels exceed their guidelines.2-4 South-East Asia is a pollution hot-spot frequently surpassing more than five times the WHO limits1 and the levels are currently increasing at circa 1% per annum.2 A study by Rahman et al(5) published in 2015 reported concentrations of PM2.5 and PM10 in Kuala Lumpur (2002 – 2011) between 21 to 35µg/m3 and 44 to 56µg/m3, respectively.5
A concurrent study (2014), undertaken in day care centres, measured higher carbon monoxide, carbon dioxide (CO2), and particulate levels in Kuala Lumpur, with these levels being positively correlated with high-density housing, traffic volumes and less greenery.6 Positioned on the ‘Intertropical Convergence Zone (doldrums), the city’s mean wind speed is relatively low (1.0 m/s to 3.0 m/s)7-8 with air movement in urban areas both inconsistent and unreliable.9 When combined with the standard flat layout (single sided) cross ventilation driven by ambient air movement, is not a particularly effective technique for providing evaporative cooling.10 Malaysia’s CO2 emissions have more than doubled over the last 40 years11 with air conditioning now responsible for close to 25% of this total. The Malaysian government signed the Paris Climate Agreement, committing to reduce their carbon emissions by 45% by 2030.4 As yet it remains unclear as to how this aspiration will be achieved.
On average city dwellers now spend approximately 90%12 of the time indoors. Indoor air quality – particularly where natural ventilation is the norm - is reliant on external air quality. Current air filter technologies in the main, address
bacteria, dust and relatively large particles. They do not filter submicron particulates or toxic gases.13 Among the solutions available to remove gaseous contaminants are adsorption, absorption and chemisorption but these techniques are limited to relatively esoteric applications such a clean room manufacturing13 and specialised vehicle cabins.14
There are two types of filter on the market - particulate filters (0.1µg and larger) and combined filters that are commonly found in vehicle cabins that filter both particles and gases.15 These combined air filters contain activated carbon and have been shown to reduce concentrations of toluene,16 ozone,13 n-butane, nitrogen dioxide and sulphur dioxide.15
This research investigates the performance of low cost air filter membranes (synthetic and recycled materials) in tandem with activated carbon in both cartridge and loose-fill formats, to filter carbon monoxide (CO), benzene, sulphur dioxide (SO2) and particulates (PM1-10). The main objective was to find an effective low cost and low carbon technique, to improve indoor air quality and thermal comfort in the short to medium term. It is hoped that the introduction of electric vehicles may start to improve external air quality in the longer term, however, the cyclical burning of agricultural land17 - common across Asia18-19 - may delay this horizon.
1Department of Architecture, James Weir Building, University of
Strathclyde, 75 Montrose Street, GLASGOW, G1 1XJ, United Kingdom. Tel.: +447756140812
Prepared using sagej.cls
2 Journal Title XX(X)
Fieldwork Studies
[image:2.596.305.545.244.383.2]A fieldwork study was conducted on two generations of the People’s Housing Program (PPR) in Kuala Lumpur to establish a baseline for indoor and outdoor air quality. Measurements were taken in ground, middle and top floor flats. The key parameters measured were: PM2.5-10, carbon dioxide (CO2), carbon monoxide (CO) and sulphur dioxide (SO2). These initial measurements suggested that toxicant gases were, in the main, within the limits set by the Department of Environment in Malaysia (DOE).20-24 The PM10 levels in the PPR second generation housing development, were peaking at 53.5 µg/m3. PM2.5 concentrations averaged 34.2 µg/m3 for PPR first generation and 44.2 µg/m3 for PPR second generation25 (Table 1). These values are clearly significantly higher than the DOE annual mean target of 15 µg/m3 and the WHO guideline of 10 µg/m3.
Table 1. Fieldwork study findings
Case Studies Mean PM10
(µg/m3)
Mean PM2.5
(µg/m3)
PPR 1st Generation 25.6 34.2 PPR 2nd Generation 53.5 44.2
DOE Limits26 40.0 15.0
WHO Limits27 20.0 10.0
There are a large number of variables that may be determining the difference in indoor particulate concentrations between the 1st and 2nd generation flat types, however, given the relatively high external PM2.5-10 concentrations, increasing ‘natural’ ventilation to provide evaporative cooling, is likely to produce a commensurate decrease in indoor air quality.28 Achieving ‘healthy IAQ’ and thermal comfort clearly requires lower air temperatures, humidity and concentrations of airborne particulates and toxicant gasses.25
Dynamic insulation (DI)
Dynamic insulation is a term that has been coined to describe the incoming air stream being delivered through an insulation matrix above an air permeable ceiling (or wall) to act primarily as an energy efficiency technique, in temperate climates. DI however has the additional advantage of providing a large volumetric filter membrane.29-32 Figure 1 shows a schematic of the initial design strategy, with a fan delivering external air into a ceiling void in combination with a low level extract fan exhausting vitiated air into the central light well, creating a negative pressure to draw the air mass through the DI supported on a perforated ceiling.
Figure 1: Schematic design of the system
Proof of concept testing by scale modelling
[image:2.596.61.277.270.348.2]A 1:5 model of the master bedroom in the PPR 2nd generation flat type was constructed. The model - made from rigid insulation board - has three compartments: outdoor air mixing chamber, a dynamic-hybrid air permeable ceiling (DHAPC) void and compartment to represent the living room/bedroom. Pre-warmed particulate laden air, was introduced into the mixing chamber using a heater fan. This air mass was delivered into the ceiling void where it was drawn through various insulation types (Figure 2).25 The initial tests evaluated the efficacy of these materials in combination with variable air change rates, to ascertain the optimum combination33.An additional filtering element (activated charcoal) was introduced in later test runs (AC) in both cartridge and loose fill formats.
Figure 2: scale model configuration
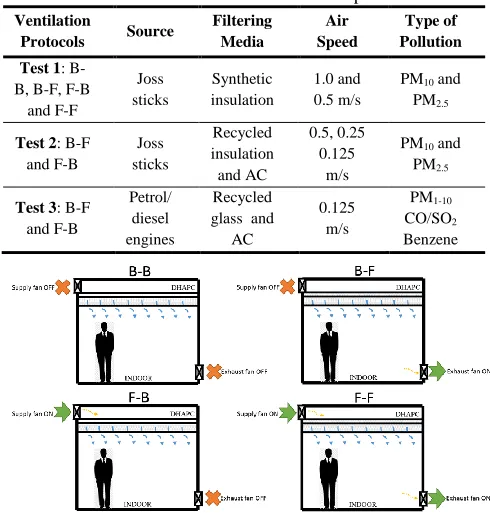
[image:2.596.299.544.539.796.2]Test 1 compared four ventilation protocols - 1) fully passive (B-B), 2) hybrid-negative (B-F), 3) hybrid-positive (F-B) and 4) fully active (F-F) (Figure 3). Tests 2 and 3 compared B-F and F-B only. The parametric analysis for tests 1 and 2, included PM2.5 and PM10. The initial runs used a burning ‘joss’ stick as the source of particulate matter, while the later test runs used the exhaust gases from both petrol and diesel engines (Table 2). This allowed additional parameters such a CO, benzene and SO2 to be measured.
Table 2. Scale model test set-ups
Ventilation
Protocols Source
Filtering Media
Air Speed
Type of Pollution Test 1:
B-B, B-F, F-B and F-F
Joss sticks
Synthetic insulation
1.0 and 0.5 m/s
PM10 and
PM2.5
Test 2: B-F and F-B
Joss sticks
Recycled insulation and AC
0.5, 0.25 0.125
m/s
PM10 and
PM2.5
Test 3: B-F and F-B
Petrol/ diesel engines
Recycled glass and AC
0.125 m/s
PM1-10
CO/SO2
[image:2.596.67.276.628.797.2]Benzene
Prepared using sagej.cls
[image:3.596.305.546.41.794.2]Figure 4 shows the instruments used in the tests. For gases, instrument ‘A’ measures CO using a detection technique of ‘stabilised electrochemical gas-specific’ that has a test range from 0 to 1000 ppm. Instrument ‘B’ was equipped with ‘semiconductor sensing technology’, to measure benzene, and instrument ‘C’ measured SO2 using an aspirator that can detect the gas within the range of 0 to 20 ppm. Meanwhile for PM particles, instrument ‘D’ with ‘plant tower’ technology was used to measure the particles from the range 0 to 999 µg/m3 (Table 3).
[image:3.596.54.282.156.333.2]Figure 4. Instrument used in the tests
Table 3. Details of the instruments used in the test Instrument Substance(s)
Measured Test Range Detection Technique Density Unit
A CO 0 - 1000
Stabilized Electrochemical
Gas-Specific
ppm
B Benzene 0 - 9.99
Semiconductor Sensing Technology
mg/m3
C SO2 0 - 20
Optional Manual Aspirator ppm D PM 1, PM2.5 and PM10
0 - 999
Plant Tower - ARM 32 Bit
Processor
µg/m3
[image:3.596.47.292.354.490.2] [image:3.596.46.290.609.716.2]The results of these three tests confirmed that the internal structure and type of membrane (Figs. 5 and 6) can play an important role in filtering efficacy.34 Air speeds in the initial tests were refined to match the prescribed ventilation rate of 8l/s/p as recommended by CIBSE35 (Table 4).In the second test run an activated charcoal filter was introduced to measure the effect on reducing gas concentrations of CO, SO2 and benzene.36
Table 4. Test 1 results using synthetic filters
Conf. Parameters Fieldwork
(µg/m3)
Reduction (%)
Results (µg/m3)
B-B PM2.5
PM10 44.2 53.5 45.3 44.7 24.2 29.6
B-F PM2.5
PM10 44.2 53.5 28.6 32.7 31.6 36.0
F-B PM2.5
PM10 44.2 53.5 31.9 33.5 30.1 35.6
F-F PM2.5
PM10 44.2 53.5 17.9 18.4 36.3 43.7
Table 5 confirms the optimum performance with an air speed of 0.125m/s driving a reduction in PM2.5 and PM10, between 75 and 82% - B-F(i) and F-B(i). Recycled glass insulation matrix recorded the highest reduction rates and when combined with the activated charcoal cartridge filter, produced a reduction for both PM2.5 and PM10 of 97.8% - F-B(ii).
Table 5. Test 2 results using recycled glass
Con f.
Parameters Fieldwork (µg/m3)
Reduction (%)
Results (µg/m3)
B-F (i) PM2.5 PM10 44.2 53.5 75.8 75.4 10.7 13.2 F-B (i) PM2.5 PM10 44.2 53.5 82.0 80.1 7.9 10.6 B-F (ii) PM2.5 PM10 44.2 53.5 81.9 81.4 8.0 9.9 F-B (ii) PM2.5 PM10 44.2 53.5 97.8 97.8 1.0 1.2
Figure 5. The synthetic materials
Figure 6. The recycled insulations and AC cartridge Polyester
Polyethylene Terephthalate (PET)
Test 3: Petrol/diesel engine particulates
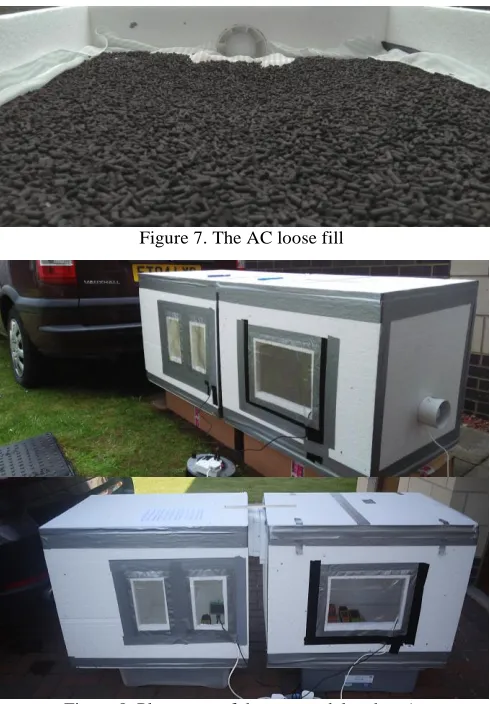
In addition to particulates this test measured carbon monoxide, sulphur dioxide and benzene as proxies. The test also evaluated the effect of having the activated charcoal condensed in a filter cartridge (Fig. 6), versus a ‘loose fill’ approach, where the granules were evenly spread above the insulation layer (Fig. 7). The tests were conducted at outdoor space using direct supply from both petrol and diesel engines – (Fig. 8).
[image:4.596.52.297.150.502.2]Figure 7. The AC loose fill
Figure 8. Placement of the test model and car/s
Test 3 - Measurement Method
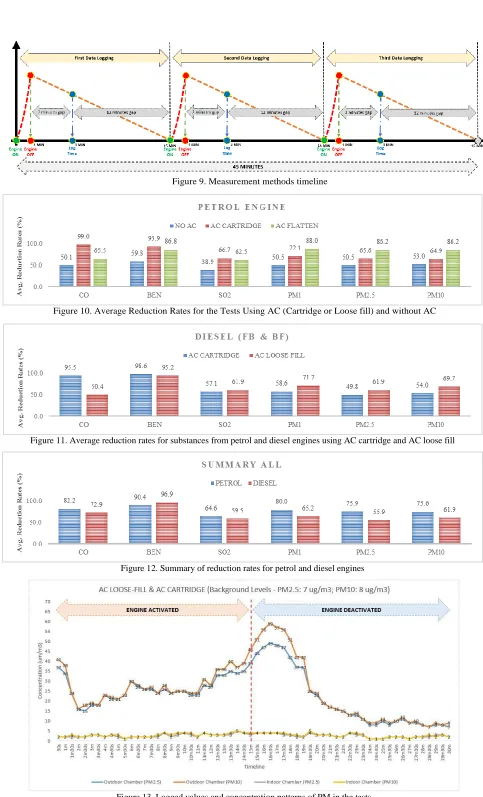
Each run assessed four filtering methods: 1) F-B with AC cartridge, 2) F-B with AC loose-fill, 3) B-F with AC cartridge, and 4) B-F with AC loose-fill. Each filtering method consisted of three data-logging series (15 minutes duration). Figure 9 shows the timeline of the initial series. The engine was run until the CO sensor became saturated after approximately 1 minute. The engine was then deactivated until the CO level dropped to ambient, at which point the fans were activated delivering the exhaust gasses into the chambers. After two minutes, the data was recorded. This delay was an attempt to provide more ‘steady state’ conditions in accordance with the parameters of the sensors, however fresh air infiltration did produce a diluting effect (Fig. 9).
Results
Figure 10 shows the average reduction rates for the tests with and without the AC (cartridge or loose fill). These rates represent both F-B and B-F average reduction rates. For CO, the average reduction rate without AC is 50%, however when the AC cartridge and loose fill were introduced, reduction rates increased to 65% and 99% respectively. For benzene, the baseline reduction rate
without AC is 59.8% increasing to 86.8% and 93.9% when the AC was introduced. For SO2 slightly lower reductions were recorded with a baseline of 38.9% with the addition of the AC techniques delivering improvements of 20 and 25%. For PM1, PM2.5 and PM10, the baseline rates were circa 50%. Introducing the AC cartridge, increased the efficacy to between 65 to 70%, with the loose fill AC, producing a further improvement peaking at 88%. The activated carbon in the cartridge format was more effective in absorbing gases (CO, benzene and SO2) with additional reductions of 20 to 45%. These results suggest that the AC in the cartridge format is more effective at absorbing gases whereas the loose fill configuration is more effective for adsorbing particulate matter.
Figure 11 shows a comparison of reduction rates for diesel engines using AC cartridge and loose fill. The results suggest that using the AC in the cartridge format, can absorb up to 90% of CO, benzene and SO2 compared when the loose fill at circa 70%. Conversely, AC loose fill was more effective in reducing particulate matter (88% v 66%). It appears that the cartridge that has a more compact density, has better ‘absorption’ of gases compared to the loose fill. The loose fill appears to be more effective at ‘adsorbing’ particulate matter possibly due to it having a greater contact area. All of the reduction rates shown are averaged from F-B and B-F results.
Figure 12 shows the summary of average rates for the petrol and diesel engines using AC filtering techniques in combination with recycled wool. Gaseous emissions from the engines, were reduced by up to 95% with particulate matter being reduced by an average of 76%.
Discussion
Figure 13 shows the logged values and concentration patterns of PM in the tests. In 15 minutes, the petrol engine produced a maximum level of 59µg/m3 for PM10 and 49µg/m3 for PM2.5. The ambient background levels were 8 µg/m3 for PM10 and 7µg/m3 for PM2.5. After 15 minutes, concentrations for both stabilised at circa 3µg/m3 in the inner compartment. The DHAPC and activated carbon (loose-fill), reduced particulates by circa 83%. An additional reduction of 6% was produced when the AC loose-fill and cartridge were combined (Fig. 11). This phenomenon suggests that DHAPC can successfully filter airborne particles not only from organic smoke (i.e. joss sticks) but also particles from petrol and diesel engines, however in terms of filtering gases, the DHAPC performance appears to be more sensitive to air flow rates.
AC has the advantageous property of trapping gases using a process known as ‘adsorption’36 where pollutants stick to the multiple voids in its high surface area. Myers36 also found that AC is less effective in adsorbing fine particles like mold, dust and pollen from the air. This argument is consistent with the test results where the reduction rates for particulates are generally lower than the reduction rates for gases. It is however likely that the AC cartridge filter will become saturated at some stage. Using it in the loose fill format is therefore likely to increase longevity.
Prepared using sagej.cls
Figure 9. Measurement methods timeline
Figure 10. Average Reduction Rates for the Tests Using AC (Cartridge or Loose fill) and without AC
Figure 11. Average reduction rates for substances from petrol and diesel engines using AC cartridge and AC loose fill
Figure 12. Summary of reduction rates for petrol and diesel engines
IAQ Conclusion
The use of activated carbon is particularly effective in absorbing gasses with a reduction of 99% for CO, 94% for benzene and 66% for SO2. This work suggests that the DHAPC system combined with AC filtering techniques (cartridge and/or loose fill) have considerable potential for reducing the concentrations of both particulates and toxic gasses from entering indoor spaces.
Applying these percentage reductions to the levels of particulates and gasses measured by the fieldwork studies would see both particulate and toxic gas concentrations dropping to well below the WHO guidelines. From the fieldwork studies, the PM10 levels in the PPR housing were peaking between 25.6-53.5 µg/m3. Applying these percentage reductions would bring these numbers down to 3.6 and 7.5 µg/m3; figures that are well below the WHO threshold guidelines.
Achieving thermal comfort
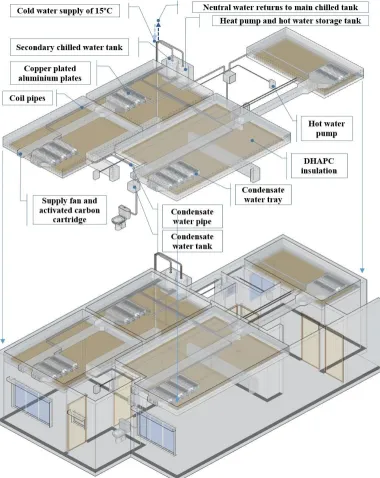
[image:6.596.113.493.288.766.2]Computational modeling using ‘Integrated Environmental Solutions’ (IES) software37 was undertaken of the likely hygro-thermal conditions in the flats and determined that comfort conditions could not be achieved by natural ventilation for over 70% of the year, with resultant indoor air temperatures predicted to be well above 28ºC.25 Humidity levels were also predicted to be over 65%RH for 85% of the year.25 An active cooling strategy is therefore required if thermal comfort is to be achieved. A chilled beam ceiling (Dynamic Hybrid Cooling Ceiling - DHCC) was modeled. This system introduces finned cooling pipes into the ceiling void. Chilled water at 15ºC was taken to be the optimum temperature and circulated in the pipework from a central chiller unit located at rooftop level (Figure 14). As the finned pipes will be invariably below dew point, condensate is collected and channeled via metal trays to a drain outlet. The warm return loop can also be upgraded by a heat pump to pre-heat the domestic hot water.
Prepared using sagej.cls
Predicted CO2 and cost savings
As the simulation data predicted peak temperatures occurring between 10am and 10pm, the cooling cycle was pre-programmed to be active during this timeframe. Based on the operative temperatures and relative humidity falling within the adaptive thermal comfort38-39 parameters for Malaysia, the optimum combination from the parametric analysis was calculated to be an air supply rate of 30l/s. Ideally, air change rates will be regulated with an internal CO2 monitor set at 1000ppm allowing the system to respond to fluctuating occupancy patterns. Combining the fan and compressor power consumption, produced a prediction of 1.86 kWh per day that equates to 680 kWh/year.
Kubota et al40 calculated the current average annual energy consumption for cooling (air-conditioning and ceiling fans) in Malaysian housing units, at 1973kWh/year (29% of total consumption) with a carbon penalty of 558 kgCO2/year. The DHCC configuration running at the low fan speeds, equates to a potential saving of circa 66% in power consumption41 with the associated carbon penalty falling to 192kgCO2/year. In addition to this there will also be a commensurate saving in energy consumption for domestic hot water that will vary depending on the system type being displaced.
The integration of the DHAPC and DHRCC systems has therefore the potential to provide thermal comfort and 'healthy' indoor air quality in high-rise residential buildings, with a much reduced running cost and CO2 penalty.
Acknowledgements
The authors would like to thank the Commonwealth Scholarship Commission (CSC) for funding the study. Mohd Firrdhaus Mohd Sahabuddin is a Commonwealth Scholar, funded by the UK government.
References
1. Osseiran, N.; Lindmeier, C., 9 out of 10 people worldwide breathe polluted air, but more countries are taking action. World Health Organization (WHO): Geneva, Switzerland, 2018.
2. WHO, W. H. O.-. Air Pollution.
http://www.who.int/airpollution/en/ (accessed 19 November).
3. WHO, W. H. O.-. Exposure to ambient air pollution from particulate matter for 2016. 2 April 2018 ed.; World Health Organization (WHO): Geneva, Switzerland, 2018. 4. Hopke, P. K.; Cohen, D. D.; Begum, B. A.; Biswas, S. K.; Ni, B.; Pandit, G. G.; Santoso, M.; Chung, Y.-S.; Davy, P.; Markwitz, A., Urban air quality in the Asian region. Science of the Total Environment 2008, 404 (1), 103-112.
5. Rahman, S. A.; Hamzah, M. S.; Elias, M. S.; Salim, N. A. A.; Hashim, A.; Shukor, S.; Siong, W. B.; Wood, A. K., A long term study on characterization and source apportionment of particulate pollution in Klang Valley, Kuala Lumpur. Aerosol and Air Quality Research 2015, 15 (6), 2291-2304.
6. Cionita, T.; Adam, N. M.; Jalaludin, J.; Mansor, M.; Siregar, J. In Measurement of Indoor Air Quality Parameters in Daycare Centres in Kuala Lumpur Malaysia, Applied Mechanics and Materials, Trans Tech Publ: 2014; pp 245-249.
7. Leary, C. A., Behavior of the wind field in the
vicinity of a cloud cluster in the intertropical convergence zone. Journal of the Atmospheric Sciences 1979, 36 (4), 631-639.
8. Milne, M., Climate Consultant v6. 0. Energy, U. D. o., Ed. University of California, Los Angeles, 2016.
9. Mohd Sahabuddin, M. F.; Gonzalez-Longo, C. In Natural Ventilation Potential in Kuala Lumpur: Assumptions, Realities and Future, Passive Low Energy Architecture : Design to Thrive, Edinburgh, 3rd - 5th July; PLEA: Edinburgh, 2017; pp 4291-4298.
10. Prajongsan, P. Natural ventilation strategies to enhance human comfort in high-rise residential buildings in Thailand. University of Liverpool, 2014.
11. Lucon, O.; Ürge-Vorsatz, D.; Ahmed, A. Z.; Akbari, H.; Bertoldi, P.; Cabeza, L. F.; Eyre, N.; Gadgil, A.; Harvey, L. D. D.; Jiang, Y.; Liphoto, E.; Mirasgedis, S.; Murakami, S.; Parikh, J.; Pyke, C.; Vilariño, M. V. Buildings. In: Climate Change 2014: Mitigation of Climate Change. Contribution of Working Group III to the Fifth Assessment Report of the Intergovernmental Panel on Climate Change; Cambridge University Press, Cambridge, United Kingdom and New York, NY, USA, 2014.
12. Stephens, B.; Brennan, T.; Harriman, L., Selecting Ventilation Air Filters to Reduce PM2. 5 of Outdoor Origin. ASHRAE JOURNAL 2016, 58 (11), 10-10.
13. Seyffer, C., Ozone and Air Filters. ASHRAE JOURNAL 2012, 54 (2), 82-84.
14. Bauer, B.; Heininger, T.; Haider, D.; Schwimmbeck, T.; Hoesl, M.; Heinzmann, M.; Weber, A.; Schoen, M.; Schoen, M.; Klein, M., Smart multi-modal vehicular air filtering system and associated methods. Google Patents: 2018.
15. Ladrech, F.; Martinell, A.; Caudy, N.; Del Fabbro, L.; Ondarts, M.; Hort, C., Composition comprising an activated carbon, a zeolite, and Fe ions for a vehicle passenger compartment air filter. Google Patents: 2018.
16. Kumar, M.; Giri, B. S.; Kim, K.-H.; Singh, R. P.; Rene, E. R.; López, M. E.; Rai, B. N.; Singh, H.; Prasad, D.; Singh, R. S., Performance of a biofilter with compost and activated carbon based packing material for gas-phase toluene removal under extremely high loading rates. Bioresource technology 2019, 285, 121317.
17. DOE Chronology of Haze Episodes in Malaysia;
Department of Environment (DOE), Ministry of Natural Resources and Environment: Putrajaya, 2016.
18. Rahman, H. A. In Haze phenomenon in Malaysia: Domestic or transboudry factor, 3rd International Journal Conference on Chemical Engineering and its Applications, 2013; pp 597-599.
19. Fuller, G., The Invisible Killer - The Rising Global Threat of Air Pollution and How We Can Fight Back. Melville House UK: London, 2018.
20. DOE CHAPTER 1: AIR QUALITY MONITORING
Department of Environment (DOE), Ministry of Natural Resources and Environment: Putrajaya, 2017.
21. DOE CHAPTER 1: AIR QUALITY MONITORING
Department of Environment (DOE), Ministry of Natural Resources and Environment: Putrajaya, 2016.
22. DOE CHAPTER 1: AIR QUALITY MONITORING;
Department of Environment (DOE), Ministry of Natural Resources and Environment: Putrajaya, 2015.
24. Mohamed Binyehmed, F.; Abdullah, A. M.; Zainal, Z.; Zawawi, R. M.; Elawad, R. E. E., Trend and Status of SO2 Pollution as a Corrosive Agent at Four Different Monitoring Stations in the Klang Valley, Malaysia. 2016. 25. Mohd Sahabuddin, M. F.; Gonzalez-Longo, C., Achieving Health and Comfort in High-Rise Residential Buildings by Using Dynamic-Hybrid Air Permeable Ceiling (DHAPC). American Society of Heating Refrigerating and Air Conditioning Engineers (ASHRAE) Transactions 2019, 125 (2), 15.
26. DOE New Malaysia Ambient Air Quality Standard;
Department of Environment (DOE), Ministry of Natural Resources and Environment: Putrajaya, 2013.
27. WHO, W. H. O.-.; UNAIDS, Air quality guidelines: global update 2005. World Health Organization: 2006. 28. Mohd Sahabuddin, M. F.; Gonzalez-Longo, C., Assessing the Indoor Comfort and Carbon Dioxide Concentration in High-Rise Residential Buildings in Kuala Lumpur: The People’s Housing Programme. In CIBSE Technical Symposium 2018 - Stretching the Envelope, CIBSE: London South Bank University, 2018.
29. Halliday, S., Performance of Dynamic Insulation. In CIBSE National Technical Conference, Gaia Research: Edinburgh, 1997.
30. Taylor, B. J.; Webster, R.; Imbabi, M. S., The building envelope as an air filter. Building and Environment
1998, 34 (3), 353-361.
31. Elsarrag, E.; Aboulnaga, M.; Peacock, A.; Imbabi, M. S. In Dynamic insulation for energy conservation and improved indoor air quality in hot humid climates, Invited keynote paper, ASHRAE 5th Chapter Regional Conference (CRC), 2006; pp 01-03.
32. Di Giuseppe, E.; D’Orazio, M.; Di Perna, C., Thermal and filtration performance assessment of a dynamic insulation system. Energy Procedia 2015, 78, 513-518. 33. Mohd Sahabuddin, M. F.; Gonzalez-Longo, C., Balancing Comfort and Indoor Air Quality in High-Riser Buildings for Social Housing in Kuala Lumpur: From Regulations to Construction. In 51st AiCARR International Conference: The Human Dimension of Building Energy Performance, Venice, Italy, 2019.
34. Liu, C.; Hsu, P.-C.; Lee, H.-W.; Ye, M.; Zheng, G.; Liu, N.; Li, W.; Cui, Y., Transparent air filter for high-efficiency PM 2.5 capture. Nature communications 2015, 6, 6205.
35. CIBSE, G. A., Environmental Design. The Chartered Institution of Building Services Engineers, London
2015, 8th Edition.
36. Myers, P. Activated Carbon Air Filters: Everything You Need to Know.
https://molekule.com/blog/activated-carbon-air-filter/ (accessed 16 April ).
37. Marko Jarić; Nikola Budimir; Milica Pejanović; Svetel, I., A Review of Energy Analysis Simulation Tools. 7th International Working Conference ‘Total Quality Management–Advanced and Intelligent Approaches’, 3rd – 7th June, 2013. Belgrade, Serbia 2013.
38. ASHRAE, Standard 55-2013:“Thermal Environmental Conditions for Human Occupancy”; ASHRAE Atlanta USA 2013.
39. Nicol, F., Adaptive thermal comfort standards in the hot–humid tropics. Energy and Buildings 2004, 36 (7), 628-637.
40. Kubota, T.; Jeong, S.; Toe, D. H. C.; Ossen, D. R., Energy consumption and air-conditioning usage in residential buildings of Malaysia. Journal of international Development and Cooperation 2011, 17 (3), 61-69.