Copyrighti) 1987,American Society for Microbiology
Multidimensional Analysis of
Intracellular Bacteriophage
Effects of
Amber Mutations in Genes
3
and 19
T7 DNA:
PHILIP SERWER,* ROBERT H. WATSON,AND SHIRLEYJ. HAYES
Department of Biochemistry, The University of Texas Health Science Center, San Antonio, Texas 78284-7760
Received13 February 1987/Accepted 20 July 1987
By use of rate-zonal centrifugation,followed by either one- or two-dimensional agarose gel electrophoresis,
theformsof intracellular bacteriophage T7 DNA produced by replication, recombination, and packaginghave
beep analyzed. Previous studies had shown that at least some intracellular DNA with sedimentation coefficients between32S (the S value of mature T7 DNA) and 100S is concatemeric, i.e., linear and longer than mature T7 DNA. The analysis presented hereconfirmed thatmost ofthisDNA is linear, but also revealed a significant amount of circular DNA. The data suggest that these circles are produced during DNA packaging. It is proposed that circles are produced after a capsid has bound twosequential genomes in a concatemer. The size distribution of the linear,
concatemeric
DNA had peaks at the positions of dimeric and trimericconcatemers.Restriction endonuclease analysis revealed that most of the mature T7 DNA subunits ofconcatemers were joinedleftendtoright end. However, these data also suggest that a comparatively small amount of left-end to left-end joining occurs, possibly by blunt-end ligation. A replicating form of T7 DNA that had.an S value greater than 100 (100S+ DNA) was also found to contain concatemers. However, some of the 100S' DNA, probably the most branched component, remained associatedwith the origin after agarose gel electrophoresis. It hasbeenfound that T7protein 19, known to be required for DNA packaging, was also required to prevent loss, probably by nucleolytic degradation, of the right end of all forms of intracellular T7 DNA. T7 gene 3 endonuclease, whoseactivityisrequired for both recombination ofT7 DNAanddegradationof host DNA, was required for the formation of the 32S to 100S molecules that behavedasconcatemersduring gel electrophoresis. In theabsence of gene 3 endonuclease, the primary accumulation productwasorigin-associated 100S+ DNA withproperties that suggest the accumulation of branches, primarily at theleft end of mature DNA subunits within the 100S+ DNA.
Tounderstand the processesofDNAreplication,
recombi-nation, and condensation, the DNA inbacteriophage-infected
cells has been fractionated and characterized (reviewed in
references8, 13, and54). In thecaseofbacteriophageT7, the
mature DNA is linear
and
terminally repetitious. Mature T7DNA has a unique permutation of its sequence (9, 33). The
sedimentation
coefficient,
S,ofmature-length(monomeric)
T7DNAis32(51). Afterfractionation of T7-infectedEscherichia
coliby rate-zonalcentrifugation, most ofthe DNAnot
pack-aged in
bacteriophages
is also not monomeric. DNA thatsediments between32S and 100S is observed. LinearDNAs
longer thanmatureT7 DNA(concatemers)are atleastsome
of the 32Sto100SDNA(16, 21, 23,37, 50). Inadditiontothe
32S to lOOS DNA, a replicating (and therefore branched)
DNA that appears collapsed when viewed by electron mi-croscopyandthatsedimentsmore
rapidly
than100S(100S+
DNA)hasbeenobserved (23, 29, 38). The 100S+ DNAhas
also beenreferredto asflowers (23, 29). SomeT7
concatem-ers are partof
100S+
DNA(43, 44). In the case ofseveraldouble-strandedDNA
bacteriophages,
including X,
P22, T2,T3, and T4as well as T7, concatemers are
packaged by
apreformed, DNA-free
capsid (procapsid);
a concatemer iscutto maturesize either
during
orafterpackaging
(reviewed
in references 10, 11, 12, 46, and59).To understand theformation andpackagingof
concatem-ers, their characteristics have been determined. Profiles
suggestingthe presenceof
discrete-length
concatemers(dim-ers,etc.)aresometimesbutnotalways seen
a.fter rate-zonal
*Corresponding author.
centrifugation in sucrose gradients, followed by
fractiona-tion ofthegradient and assay for DNA (16, 21, 23, 37,50).
However,theaccuracyofthe assay andtheresolutionpf the
sucrosegradientarenotsufficienttoreliablydetect
discrete-lengthconcatemers in thepresence of othertypes ofDNA
(variable-lengthconcatemers,forexample).A morereliable
procedureis to couplerate-zonalcentrifugation with
proce-dures of agarose gel electrophoresis developed (40) for
optimal resolution of concatemers. In
addition,
two-dimensional agarose gel electrophoresis procedures have
beendeveloped for
determining
the conformation(circular,
linear, branched) of DNA (1, 41, 45).
Application
ofthelatterprocedurestoT732Sto100SDNAwould
improve
thecharacterization of this DNA,
particularly
the detection ofcomparatively small amounts of a conformer
(circles,
forinstance)present amongmoreabundant linear DNA. In the
present study, these procedures ofagarose gel
electropho-resis and
analysis
offragments
releasedby
restrictionendonucleases were applied to 32S to 100S T7 DNA with
somesurprising results.
Apparently, before
becoming
partofeither
100S'
DNAora pure concatemer, T7 DNA
replicates
as a linear(as
opposed
tocircular)
molecule with theprimary origin
ofreplication 17% of the length of the mature DNA from the
geneticleft end(17, 60, 61).
Therefore,
itispresumed
that T7concatemers are formedby end-to-end
joining of
theprod-uctsofreplication (24, 58). Inadditiontoend-to-end
joining
during
concatemerization, joining
of genomes to formbranchesoccurs
during
DNArecombinationandreplication.
Genetically
removing
theproduct
of T7 gene3,
p3
(the
protein productsof T7 genes will bereferredto
by
pfollowed3499
on November 10, 2019 by guest
http://jvi.asm.org/
by the gene number [53]), an endonuclease that assists in degradationof the host DNA (4, 36) and selectively cleaves branched DNA(7)causes accumulationofrapidly sediment-ing(>32S) DNA(16, 24, 27). Although it has been assumed that the high S value of this DNA was caused by concatemerization (16, 24, 27), the participation of p3 in genetic recombination (22, 26, 27, 31, 49) and the branch-cleaving activity of p3 suggest that absence of p3 would
causeaccumulationof branches. Accumulation of branches is anotherpossible cause of thehigh S value in the absence ofp3. However, the rapidly sedimenting DNAobserved in the absence of p3 has never been characterized beyond determination of its S value. Thus, inthe present study the above analysis applied to DNA from wild-type T7-infected cells has also been applied to DNA from a nonpermissive host infected by T7 carrying an amber mutation in gene 3
[referred to as T73; other amber mutants will also be indi-cated byaddingto T7 the number ofthe mutant gene(s)].
In the absence of p19, a protein necessary for DNA packaging and no other known process (34), rapidly sedi-menting DNA, presumed but not proven concatemeric,
accumulates (24). Thus, to complete the above analysis of intracellularDNA, the rapidly sedimentingDNAthat
accu-mulatedwheneitherT719orT73,19infected anonpermissive host hasbeenanalyzedasdescribed above. The implications
formechanisms of T7 concatemerformation andutilization are discussed forthe results obtained with all of the above bacteriophages.
MATERIALSAND METHODS
Strainsofbacteriaand bacteriophages. Bacteriophages T73 (mutant29[52])andT719 (mutant10[52])werereceivedfrom
F. W. Studier. T7319 was constructed by a genetic cross,
performed as previously described (52). Lysates and the
contents of lysates obtained by infecting a nonpermissive
host withT7 ambermutantswillbe referredto by thename
of the mutantbacteriophage.Forexample,alysate obtained
with T73 will be referred to as a T73 lysate. To avoid confusion, wild-typeT7 will bereferredtoasT7WT. The host
forT7WTand thenonpermissive host for ambermutantswas
Escherichia coli BB/1. The permissive host for amber
mu-tantswasE. coli 0-11'.
Buffersandreagents. Standard/G buffer contained0.15 M NaCl, 0.05 M Tris chloride, pH 7.4, 0.005 M EDTA, and gelatin (100,ug/ml).Cultures forradiolabeling of intracellular
T7 DNA were grown in M9 medium (20). Electrophoresis buffer A(0.05Msodiumphosphate, pH 7.4, 0.001M EDTA) was used for unidirectional agarose gel electrophoresis.
Electrophoresisbuffer B (0.01Msodium phosphate, pH7.4, 0.001 M EDTA) was used fortwo-dimensional agarose gel
electrophoresis. Sample buffer contained 0.005 M sodium phosphate, pH 7.4, 0.001 M EDTA, and bromphenol blue (400 ,ug/ml) with the indicated concentration of sucrose.
SeakemLEagarose(Marine Colloids Division,FMC Corp., Rockland, Maine), wasusedfor allagarosegels. 3H-labeled
thymidine (40to70Ci/mmol)waspurchased from
Schwartz-Mann (Orangeburg, N.Y.). Nycodenz was purchased from
Accurate Chemical and Scientific Corp. (Westbury, N.Y.). All restriction endonucleases were purchased from New
England Biolabs (Beverly, Mass.).
Infection, radiolabeling, and lysis ofcells. To detect and characterize T7DNA in E. coli infected with eitherT7WTor
aT7mutant, cellsweregrowninlog phaseto4.0 x 108/ml in
M9 medium at 30°C with aeration. The cells were infected
(multiplicity of 15), and incubation was continued at 30°C
with aeration. Intracellular T7 DNA was then labeled with
3H by adding
[3Hlthymidine
tothe infectedcellsat thetimeindicated.T7 stopsthesynthesis ofDNAbyits
host,
and theDNAlabeledbythisprocedure isprimarilyT7 DNA
(21,
23).
To quench the process ofinfection, either part or all ofan
infected culture was mixed with an equal volume of an
ice-cold solution that contained 0.3 M NaCl, 0.1 M Tris
chloride, pH 7.4, 0.01 M EDTA, 0.008 M
KCN,
and 50%sucrose. After quenching, infected cells were pelleted and lysed by a procedure described previously (38), except that the detergent used was Sarkosyl NL97 instead ofBrij (58).
Sarkosyl NL97 was used because in preliminary
experi-ments it wasfound to inactivate DNasesthat were presentin infected cells and that were not inactivated by Brij (58).
These DNases interferedwithanalysis ofDNAby
digestion
with restriction endonucleases. The above lysis procedure did not disrupt mature bacteriophage T7 and also avoided
partitioning the lysate before centrifugation. Partitioning can result in selective lossof either one or more typesof DNA in thelysate. However, the capsids of the previouslydescribed
T7 capsid-DNA complexes are released from DNA
by
Sarkosyl (39).
Fractionation of DNA by centrifugation.Afterradiolabeling
ofintracellular T7DNAandlysis of infected cells, 100 ,ulof
lysate was diluted into 500 ,ul of standard G buffer, mixed gently, and then centrifuged through abiphasic gradientof
sucrose and Nycodenz (sucrose-Nycodenz gradient). To avoid breakage from hydrodynamic shear (6, 38), thelysates were pipetted slowly (<0.2 ml/s) through a comparatively wide-bore (1 mm diameter) micropipette. The gradient con-sisted of a 9.4-ml linear 5 to 25% sucrose gradient poured over a2.4-ml linear Nycodenz gradient (1.13 to 1.26g/ml); all partsof the gradientwere in standard/G buffer. The density of solutions of Nycodenz was determined from the refactive index (32). After layering the entire diluted lysate on the sucrose-Nycodenz gradient, centrifugation was conducted for 120 min at 35,000 rpm and 18°C. During this centrifuga-tion, intact, mature bacteriophages sedimented through the entire sucrose gradient and 50 to 70% of the Nycodenz gradient without detectable loss of DNA. All 100S+ DNA sedimented to the sucrose-Nycodenz interface and was buoyed there because double-stranded DNA has a density of 1.126g/ml in a gradient of Nycodenz (14). Thus, the100S+
DNAdid not obscure the peak of bacteriophage-associated 3H after sedimentation in a sucrose-Nycodenz gradient. In the sucrose portion of the biphasic gradient, DNAs below 100S were fractionated by S value. The position of 32S DNA (monomeric T7 DNA) was assumed to be the position of the peak intensity of the monomeric DNA band observed after unidirectional agarose gel electrophoresis-fluorography (see below) of DNAs in fractions of the gradient (see Fig. 2). The positions in the gradient expected of dimeric, trimeric, and tetrameric concatemers (no. 2, 3, and 4 on Fig. 2) were calculated from the position of monomeric DNA (no. 1 on Fig. 2) by using a relationship described in reference 15. Gradients were fractioned by tube puncture; all fractions had the same number of drops. DNA-associated 3H in fractions of sucrose-Nycodenz gradients was assayed by acid-induced precipitation of the DNA, collection of precipitated DNAon a filter, and liquid scintillation spectrometry, performed as described previously (38). Recovery of 3H-labeled DNA from gradients was greater than 90%.
The concentration of cells in the lysates (before dilution) was 5 x
1010/ml,
25% less than themaximum concentration that can be used without observing cell concentration-dependent changes in sedimentation profile (data noton November 10, 2019 by guest
http://jvi.asm.org/
shown). Anear-maximum concentration of cells was used to
maximize
the amountof3H
incorporated
intoDNA.Raisingthe ratio of
[3H]thymidine
concentration to cellconcentra-tion did not raise the amount of
3H
incorporated (data notshown).
The profile of acid-precipitable
3H
in the fractions of asucrose-Nycodenz gradient is presented as a plot of the
percentage of the total
3H
versus fraction number. Tocalculate this percentage, acorrection was made for
differ-ences in the volume of fractions as follows. Fractions in the sucrose portion of the gradient were found to have a volume greater than the volume of fractions in the following regions of the gradient, by the factor indicated: Nycodenz portion, 1.38; interface between Nycodenz and sucrose, 1.16; Sarko-syl-containing four fractions at the origin, 1.24. Fractions are referred to by the number that they were given in subsequent analyses of their contents by gel electrophoresis.
Agarose gel electrophoresis,
unidirectional.
Agarose gelswere poured and samples were subjected to electrophoresis through the gels as described previously (42). For 0.4% and more concentrated gels, a 30- or 31-finger comb was used to fractionate the bottom 29 or 30 fractions of a sucrose-Nycodenz gradient. These gradients had a total of 32 to 35
fractions. To
avoid
breakage of the septa between samplewells for 0.2% agarose gels, a 13-finger comb with wider septa was used (details are given in reference 42). In addi-tion, to avoid breakage of 0.2% gels during fluorography (see below), they were poured above a 1- to 2-mm layer of 1.8% agarose in the same electrophoresis buffer used for the 0.2% gel.
Lowering
the salt concentration during dilution of bacte-riophages for electrophoresis releases sufficient monomeric DNA from bacteriophages to form a band during agarose gel electrophoresis. Before digestion with restriction enzymes(see below), monomericDNA was completely released from
bacteriophages by heating to
75°C
for 10 min.To determine the molecular weight of a linear DNA from its distance of migration during unidirectional agarose gel electrophoresis, the following procedure introduced by Southern (48) was used. (i) The molecular weight of markers
was plotted
as
afunction of the reciprocal of their distance ofmigration. (ii) With this plot, the molecular weight of a DNA was determined from its distance migrated in the same gel
used for the markers. For linear DNAs with
molecular
weights between 0.25 and 1.0 times the molecular weight of monomeric T7 DNA, the plot for calibration was linear (r > 0.999) for the conditions of electrophoresis used below to analyze restriction endonuclease-produced fragments. Be-cause of curvature in this plot as molecular weight decreased
to 0.14 times that of monomeric DNA, a separate plotwas
made for DNAs shorter than 0.25 times the length of
monomeric DNA.
In the case of DNAs longer than monomeric T7 DNA,the
sample analyzed was
3H
labeled and detected byfluorog-raphy (see below). The markers, which included themature
DNAs of bacteriophages T4, T5, and T7 (40), were unlabeled
and detected by staining with ethidium bromide (seebelow).
The distances migrated by unlabeled DNAs were scaled to
the distances migrated by labeled DNAs by use of the
mature T7 DNA present in the3H-labeled samples and also
in the collection of unlabeled markers.
Agarose gel electrophoresis, two-dimensional.
Two-dimen-sional agarose gel electrophoresis was performed byinitially
layering a sample at the origin of a 0.2% agarose gel
(first-dimension gel) embedded within a more concentrated
1.5% agarose gel (second-dimension gel). The sample was
subjectedto electrophoresisthrough the first-dimension
gel
at 0.34V/cmfor 16 h with
buffer
circulation(42)
at20ml/minstarted2 h afterthe start of
electrophoresis.
After this firstelectrophoresis, a second
orthogonally
directedelectropho-resiswasperformedat thevoltageandforthetime
indicated,
causing the molecules of DNA to migrate into the
second-dimension gel. Embedding of gels and two-dimensional
electrophoresis were performed by procedures described
previously (41). Ethidium bromide
staining
ofgels
to beanalyzedbyfluorography(see
below)
revealedthat
nobandwasformed bymore than 10 ng ofDNA. Tennanogramsis
belowtheupper limitfornodistortion ofaband
position
(40).
Detection of DNA after agarose gel
electrophoresis.
Todetect
3H-labeled
DNA after agarose gelelectrophoresis,
gels were subjected to
autoradiography
afterpermeation
with a compound (fluor) that fluoresces when struck
by
,Bparticlesproduced by decayof
3H
(fluorography
[3,
25]).
Forfluorographywithpolyacrylamidegels,it has been shown
(5)
that salicylic acid can replace the fluors used
originally (3,
25). The advantages of fluorography with
salicylate
werecomparatively short time of
penetration
andcomparatively
lowcost(5). Therefore, attempts to use
salicylate
as afluorwithagarose gels were made.
In the presence of 0.72 M sodium
salicylate,
drying
ofagarose gels eitherin a vacuum or in air resulted in brittle
gels that
exuded
crystals of sodiumsalicylate.
The use ofglycerolto dryagarose gelsfor silver
staining (30)
suggested
the use of glycerol
together
with sodiumsalicylate
forfluorography of agarose
gels.
The inclusion of10%
glycerol
during drying for
fluorography
prevented
the aboveprob-lems. The following procedurewas used.
Agel(volume, 95 to 120ml;5 to 6mm
thick)
was soakedat room temperature for 2.5 h in 500 ml ofa solution that
contained10% glyceroland0.72Msodium
salicylate,
pH
7.0to7.4. Forsupport,the agarosegelwas
subsequently
placed
on water-saturated filter paper, and a second
piece
offilter
paper was placed beneath the
supporting
piece.
Thegel
onfilterpaperwas thenplaced inanovenat
56°C.
Foreither1%ormore concentrated gels, a
1/8-in.
(ca.
0.3-cm) thick
glass
plate over plastic wrap was
placed
on thegel
to preventcurling. Lessconcentratedgelsweredried without eitherthe
glass plate or the plastic wrap. Gels were allowed to
dry
overnightat atmospheric pressure.
Drying
required
nolessthan 5 and no more than 15 h. The dried
gel
was even lessbrittle than agarose gels vacuum dried without either
glyc-erol orsodiumsalicylate. Thedried
gels
wereslightly
sticky
butusableforfluorography.
Increasing
the concentration ofsodium salicylate increased the stickiness of the
gel
afterdryingwithoutchanging detection
efficiency.
Afterdrying,
agel was covered with plastic wrap and
clamped
against
preflashed (25) X-ray film
(Kodak
SB-5).
Exposure
wasmadeat -70°C. Inaccordance with the recommended
cau-tions (5), gloves should be worn while
handling
salicylate.
Salicylic acid forms an
extremely
light
powder
whosedis-persion in the laboratory is difficult to prevent unless
work-ing under a hood with
negative
air flow. Gels morecon-centrated than 0.3% agarose and used for unidirectional
electrophoresis usually do not
undergo
distortion inshape
duringthe drying stepin the above
fluorography
procedure.
However, less concentrated
gels
dousually
distortslightly
(see Fig. 3). Because of the presence of the
comparatively
weak first-dimensiongel embeddedin themoreconcentrated
second-dimension gel used fortwo-dimensional agarose
gel
electrophoresis,these
gels also
usually
distortduring drying.
However, the distortion is
usually
smallenough
so that thepattern
of DNA inthegel
is notsignificantly
disturbed.on November 10, 2019 by guest
http://jvi.asm.org/
Theintensityofbandsproducedbythe aboveprocedureis not a linear function of the time that the X-ray film is
exposed. Conclusions drawn from band intensities are
semiquantitative.
To observe nonradioactively labeled DNA, gels were
stainedwithethidium bromide as describedpreviously (40).
The gel was photographed through a Tiffen 23A (orange) filter on Kodak Tri-Xfilm.
Digestion
with restriction endonucleases. Thefollowing
restriction endonucleases were used to cleave intracellular
T7 DNAaftercentrifugationin asucrose-Nycodenz gradient
(fragments in order of left to rightplacement in mature T7
DNA are indicated, asis thepercentage of total monomeric DNA mass inthefragment; dataarefromRosenberg et al. [35]). XbaI: A (32.10), C (25.25), B(28.55), D(14.10); AvaI: A(26.20), D (13.60), B (25.58), E(9.92), C (24.70);BgII: B
(28.76), A(71.24). In
addition,
enzymeswhichdo not cut T7DNA (35) but do cut E. coli DNA (not shown) were used
(EcoRI, BamHI, andPstI).
Todigest with the above restriction
endonucleases,
frac-tions fromasucrose-Nycodenzgradientwereheatedto75°C
for 10 min to eject DNA from mature
bacteriophages.
A10- I amount from a fraction was diluted with 20 ,ul ofa
bufferthatcontained0.01 MTrischloride, pH 8.1,0.015 M
MgCl2, and 150 ,ug of bovine serum albumin per ml, with
enzymes addedin 1to3 ,ulportionsto afinal concentration
of2to 4U/ml. This mixturewasincubatedat37°C for2h. To
stopdigestion andprepare the DNAfor
electrophoresis,
10pul ofthefollowing solutionwasadded: 15%sucrose, 400 pLg
ofbromphenol blue per ml, and 0.08 M EDTA, pH 7.4.
EcoRI, BamHI, and PstI were tested for activity with mature DNAfrombacteriophageA andcompletelydigested
1 ,ugofDNAunderthe conditions usedhere.
Fragments of T7 DNA produced by digestion with a
restriction endonuclease are labeled either by the letters
described above and below or, when appropriate, by a
numberwhich indicates thefragment's fraction ofthe mass
ofmature T7 DNA.
Digestion with nuclease Si. Tocleave single-stranded
re-gions of DNA without cleaving double-stranded regions,
digestions with nuclease Siwereperformed (57). To 10,ul of
afractionfrom a
sucrose-Nycodenz
gradient
wasadded 20,ul ofa mixture that contained 1 part standard G buffer, 14
partsofabuffer that contained0.39 MNaCl,0.015 MZnCl2, and0.15 Msodiumacetate(plI4.6) andnuclease S1to afinal
concentration of600 U/ml. Digestion was continued for 15
min at30'C andterminatedby additionof 10
,u1
ofasolutioncontaining
10.5% sucrose,bromphenolblue(400p.g/ml),
and 0.05 M EDTA, pH 7.4. The concentration of nuclease Siuseddegrades
OOS'
DNAbut notmonomericT7 DNA (43).RESULTS
Sedimentation and gel electrophoresis ofDNA from cells infected byT7WT. To fractionate and detectintracellular T7
DNA, T7WT-infected cellswere labeled with
[3Hlthymidine
from 14 to 22
mnin
after infection. After concentration andlysis of the infected cells, the
3H-labeled
DNA wascentri-fuged throughasucrose-Nycodenz gradient. Intheprofileof
acid-precipitable
3H
from this gradient, a peak formed by100S+
DNA was observed at the interface between the sucroseandNycodenz (fractions23to 25, Fig. la). Particlesof mature
bacteriophage
penetrated this interface andformedapeakin fractions28and 29 (arrow marked by
4)
inFig. la). In the sucrose-containing portion ofthe
sucrose-Nycodenz gradient, DNA sedimenting at 0 to 100S was
;_
30Q-
I5201-5 23
3
3-89.5
0
1
1 5 10I5
20 25 30Fraction
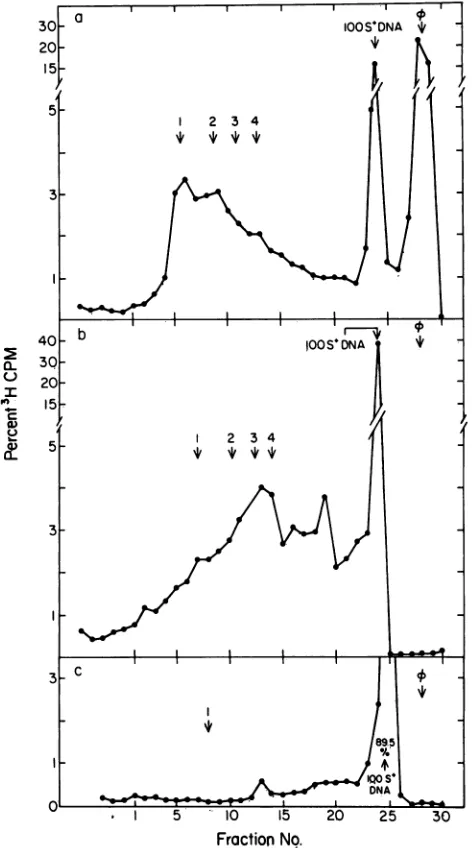
No.FIG. 1. Rate-zonal centrifugation of DNA in lysates of cells infected withT7WT, T719, and T73. A 15-ml cultureof nonpermissive host was infected with either (a) T7WT, (b) T719, or (c) T73 by procedures described in Materials and Methods. The infectedcells werelabeled from14 to22 min fterinfection with [3H]thymidine (6.7 ,uCi/ml, final concentration). After labeling, the cells were quenched, pelleted, and lysed by procedures describedin Materials and Methods. The lysates were centrifuged through sucrose-Nycodenzgradients, andportions of the fractionswereassayed for acid-precipitable 3H by procedures described in Materials and Methods. Thepercentage of the total 3H in each fractionisplotted as afunction of fraction number.Sedimentation is fromlefttoright. found. The percentages ofacid-precipitable 3H in mature
bacteriophage, 100S+ DNA, 32S to 100S DNA, and DNA
sedimentinglessrapidlythan32S (<32SDNA) are shown in
Table1.
In the 32S to 100S region, a peak was observed at the position of monomeric DNA(32S) (vertical arrow 1 in Fig. la). To further test for both monomeric DNA and other discrete-sized DNAs in
the
gradient,
portions offractions 1 to 30 were subjected to agarose gelelectrophoresis-fluorography,with 0.4%agarose and 0.34 V/cm, conditions
on November 10, 2019 by guest
http://jvi.asm.org/
[image:4.612.328.564.66.490.2]TABLE 1. Acid-precipitable
3H
inintracellular particles after the labeling and fractionation shown in Fig. 1%of total3H
P bae
Mrophage
100S+ DNA32S-100S
DNA <32SDNAT7WT 40.7 20.9 35.4 2.7
T719 0.0 46.6 47.1 5.8
T73 0.55 77.8 17.4 4.14
T73,19 0.37 84.7 10.8 4.0
found previously (40)to resolve monomeric T7 DNA from T7 concatemer-sized DNAs (Fig. 2a). To avoid
overexpo-sure ofbands from fractions that contained comparatively large amounts of 3H-labeled DNA, selected fractions from the mature bacteriophage-containing and 1OOS+ DNA-containing regions of the gradientweredilutedasdescribed
in thelegendtoFig. 2 beforeuse.MonomericDNA thathad
emptied from mature bacteriophages was observed at the
2---0.7t--
-1 5 10 15 20 25 30
I ~ 0 I1
t 3 t
2 34
0.71-I _ *.4_-w
0.71
-2- 3 4
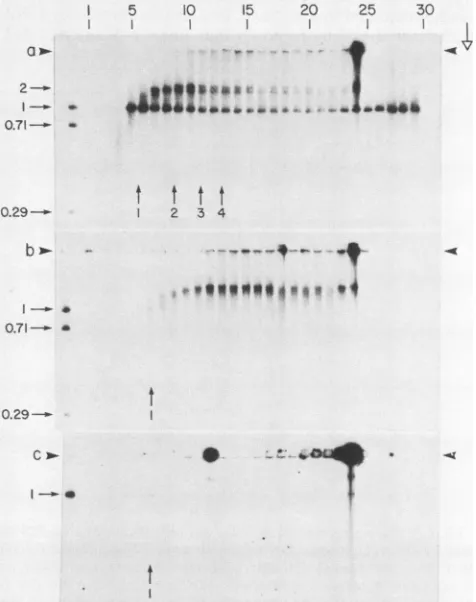
FIG. 3. Agarose gel electrophoresis ofconcatemer-sedimenting DNAathigherresolution. To 30,ul ofsamplebuffer that contained 3% sucrose was added 15 ptl of the indicated fraction from the sucrose-Nycodenz gradient ofFig. la(T7WT). A 40-pul amount of thismixturewassubjectedtoelectrophoresis ina0.2%agarosegel at0.34 V/cm for 50 h, andthe gelwas subsequently subjectedto fluorography as described in Materials and Methods. The
arrow-headsindicate theorigins of electrophoresis; theopen arrow indi-catesthedirection ofelectrophoresis.
'4
_-0.71-'- a
!
0.z29-_
_
[image:5.612.51.296.87.167.2]I--.
FIG. 2. Agarose gel electrophoresis of DNA fractionated by centrifugationinasucrose-Nycodenz gradient.To 20,ulofsample buffer with 3% sucrose and 1% Sarkosyl was added 10 pulofthe indicatedfraction from thesucrose-Nycodenz gradientsused inFig. 1tofractionate DNA from E.coliBB/1infected with(a) T7wT, (b) T719,or(c) T73.Some of these fractionswerediluted beforeusein standard G buffer as described below. A 25-pul amount of this mixture was layered in a sample well of a 0.4% agarose gel in
electrophoresisbuffer A. Thesamplesweresubjectedto electropho-resisat0.34 V/cm for 40h,and thegelwassubsequentlysubjected
tofluorographyasdescribedinMaterials and Methods. The
arrow-heads indicate theorigins ofelectrophoresis; theopen arrow indi-catesthedirection ofelectrophoresis.Thefollowingdilutionswere
made beforeadding samplebuffer:fraction29,1/5;fraction28, 1/6; fraction24,1/4.
position of bacteriophage T7 (Fig. 2a, fractions 27 through 29). The peak of monomeric DNA previously observed in the sucrose portion of this gradient (Fig. la) was also
observed in theprofile of monomeric DNA in the gel of Fig. 2a(verticalarrow 1). However, some monomeric DNAwas
alsofoundthroughout the 32Sto 100Sregion of thegradient andattheposition of
10OS'
DNA.Inadditiontotheband formed by monomeric DNA in Fig. 2a, twobandswereobserved closertotheorigin of electro-phoresis. The band closestto the bandof monomeric DNA (indicated by horizontalarrow2attheleftof Fig. 2a)wasat
theposition ofadimericconcatemer +20% in theagarosegel (see Materials and Methods). The DNA that formed this band alsoformedaskewedpeak in thesucroseportion of the
sucrose-metrizamidegradient. Thispeakwasapproximately
at the position expected of a dimeric concatemer (vertical arrow 2 in Fig. 2a). The band above the band of dimeric concatemer in Fig. 2awas formed by DNA that could be
either a trimeric or a tetrameric concatemer. A separation with resolution higher than the resolution in Fig. 2 was
needed to resolve trimeric from tetrameric concatemers.
Thus, assuming that the bands of Fig. 2a were formed by
linearDNA (this assumptionwastested andconfirmed; see
below),thepresence of dimericconcatemerswas confirmed witharesolution by length of ±+20%, and the presenceofat
leastone longer, discrete-lengthconcatemerissuggested. To improve the resolution by length of T7
concatemer-sizedDNAs,agarosegel electrophoresisof DNA in fractions 8to19(Fig. la and2a)wasperformed ina0.2%agarose gel
at 0.34 V/cm (Fig. 3). The two bands in the
concatemer-containing region of the gel were found at the positions of
dimeric concatemers +10% and trimeric concatemers ±20%. In other experiments, a less intense band at the
8 13 18
4x..
3---K.
on November 10, 2019 by guest
http://jvi.asm.org/
[image:5.612.55.293.281.582.2]a b
24 24
2.- X i
t-
-FIG. 4. Digestion ofT7WT100S+ DNA with nuclease Si. Frac-tions 23, 24, and25of thegradient of Fig.la wereseparately diluted into standardG buffer by1/3, 1/5, and 1/1, respectively. To 10
RI
of eachof these dilutionswasadded 20 ,ul of either(a)Sl bufferor(b) Si buffer with nucleaseSi(600U/ml). Digestionwascontinuedfor 15minat30°C and wasstopped by addition of10pu1 ofasolution containing bromphenol blue (400,ug/ml), 10.5% sucrose, and 0.05M EDTA, pH7.4. A20-RIl
amountofaquencheddigestwassubjected toelectrophoresis in a0.4% agarose gel for40hat 0.34V/cm, and thegelwassubsequentlysubjectedtofluorographyasdescribed in Materials and Methods. The arrowheads indicate the origins of electrophoresis; the open arrow indicates the direction of electrophoresis.position of tetrameric concatemers wasalso observed(data
notshown).
Inadditiontothe monomeric DNA and multimeric DNAs discussed above, DNAatthe origin of electrophoresis was observedattheposition ofT710OS+DNA(Fig. 2a,fraction 24). DNA, most heterogeneous in distance migrated, has previously been released from 100S+ DNA by digestion with nuclease Si, specific for single-stranded DNA (43). Diges-tion with nuclease Si (400 U/ml) of10OS+DNA reduced the amount of theorigin-associated DNA and released heterog-eneousDNA(digested: Fig. 4b, fraction 24; control: Fig. 4a, fraction 24). The nuclease Si did not digest monomeric T7 DNA (Fig. 4, fractions 23 and 25). An interpretation of this result is that branches connected by single-stranded DNA are necessary for the comparatively slow migration ofthe origin-associated 10OS+ DNA.
Two-dimensionalagarosegelelectrophoresis: circularDNA in lysates. Although it has been shown by electron micros-copy that most32S to 100S T7 DNA is linear (21, 23), it is possible thatsomeof this DNA iscircular, inanamount too
small for reliable detection by electron microscopy. The procedure of two-dimensional agarose gel electrophoresis described in Materials and Methods separates the linear DNA from the open circular DNA of bacteriophage X
(molecular weight, 32,100,000) and should do the same for
anyDNAofcomparable orgreatersize (P. Serwer and S. J. Hayes, Electrophoresis, in press). During the second elec-trophoresis at 6 V/cm, such circles are immobilized in the
first-dimension gel; linear molecules migrate out of the first-dimension gel and forman arcin the second-dimension
gel. According to the data of Bell and Byers (1), branched molecules should fall between thearcof linearDNA and the
immobilized circles. Circles too small to be immobilized shouldalso befoundbetween thearcof linearDNAs and the
first-dimension gel (45).
Thus, to determine whether circles were present among
themolecules of 32Sto100S DNA, this DNAwas subjected
totwo-dimensionalagarosegel electrophoresisasdescribed
in Materials and Methods. Initially unradiolabeled
prepara-tions ofDNA wereused,and the DNAprofilewasobserved
by staining with ethidium bromide. By DNA-DNA hybrid-izations performed in a previous study (23), no more than 20% of the unlabeled DNA was likely to be host DNA. The profileofall detected DNAsedimenting at35S to 45S (Fig. 5a)and 45S to 52S (Fig. Sb) was a single arc. This arc was coincident with an arc formed by the collection of linear DNAspreviously (45) used as markers (thearcofmarkersis not shown). This observation confirms the previous finding (21) that most 32S to 100S T7 DNA is linear.
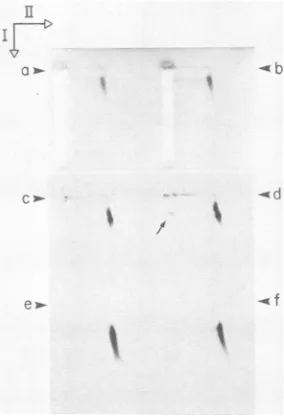
Although some distortion ofgels used for two-dimensional agarose gel electrophoresis occurs during drying for fluorography, fluorography is more sensitive than staining for detecting comparatively small amounts of nonlinear DNA.Fluorograms of gels after two-dimensional agarose gel electrophoresis confirmed that most of the 3H-labeled T7 DNA, including DNA that formed a band, was linear for DNAs from thefollowing regions of the sucrose-Nycodenz gradient inFig. 1: 59S to 75S (Fig. 5c), 41S to 59S (Fig. Sd), 30S to 41S (Fig. Se), and 13S to 30S (Fig. Sf). However, a comparatively weak band bent during drying (filled arrow, Fig. Sd) was observed in the first-dimension gel. This band was not detected in Fig. 5c, e, or f. It was formed byDNA thatmigrated 14% more slowly than linear monomericDNA
I.t-/> b
I
ew f
FIG. 5. Two-dimensional agarose gel electrophoresis of 32S to 100ST7 DNA. UnlabeledDNAfrom30 mlofT7wT-infectedE.coli BB/1 was sedimented through a sucrose-Nycodenz gradient as described inMaterials and Methods. DNAs(40,ul) from the 35Sto 45S region (a) of the gradient and 45S to 52S region (b) of the gradient were separately subjectedtotwo-dimensional agarose gel electrophoresis (without dilution)at6V/cm for1.8hfor the second electrophoresis. Electrophoresis was followed by staining with ethidium bromide as described in Materials and Methods. In a separateexperiment, fractions from the gradientin Fig. la(T7wT) werepooled and diluted, as indicated below. To 30 ,ul of each of these dilutions was added 10
pul
of sample buffer with no sucrose, and 35 p,loftheselatterdilutions wassubjectedto two-dimensional agarosegel electrophoresis for2.0 hfor the second electrophoresis. Thegelwassubjectedtofluorography. Other panels: (c) fractions 15 to 19(59S to 75S), no dilution; (d) fractions 9 to 14(41S to 59S),1/1.5 dilution; (e) fractions Sto 8(30S to 41S), 1/2 dilution; (f) fractions 0 to 4(13Sto30S),nodilution.Thearrowheads indicate the origins of electrophoresis; theopenarrowsindicate thedirections ofthefirst (I)and second(II)electrophoresis.on November 10, 2019 by guest
http://jvi.asm.org/
[image:6.612.138.234.65.198.2] [image:6.612.372.514.330.538.2]during
the first electrophoresis (0.34 V/cm) but did notmigrate during
the second electrophoresis (6V/cm). Whenthe
voltage gradient
for the second electrophoresis waslowered from6 to 1
V/cm,
the arrestedDNAmigrated (notshown).
This behavior of the DNA that formed the bandindicated
by
thearrowinFig. Sd is thesame as the behaviorofopencircles of
bacteriophage
A DNA(Serwerand Hayes,in
press).
Itistherefore concludedthat the DNA that formedthis bandwas circularDNA. Analysis of single fractionsby
the
procedure
inFig.
5 revealed that this circular DNAformeda
peak
atthe42± 2Sposition.
The S valueof theT7circles was
significantly higher
than the 36S expected foropencircularT7DNA
(2,
19). The measured S value forT7circles was,
however,
consistent with a DNA that wasclosed circularatthetime of
centrifugation
(2, 56). Thus, thedata suggest that the bandindicatedby an arrow inFig. Sd
wasformed
by
either circles thatwere closedatthe time ofcentrifugation
andsubsequently
convertedtoopencirclesorcircles thatwereopenatthe time ofcentrifugationbut whose
S value wasaltered
by
DNA-DNA interactions duringcen-trifugation.
The correctalternative is notknown. Theinte-grated intensity
of the band ofcircles was always less than3% of the
integrated intensity
ofthe arcof linearDNA.To
help
determine thepathway
forthe production ofthecomparatively
small amount of circular DNAproduced
during
aT7WT
infection,
thekineticsofappearanceof circleswas determined
by
a kineticlabeling
experiment similartothose
previously performed (38),
but with assay for circlesby
theprocedure
of two-dimensionalagarosegel
electropho-resis used here. After
labeling
T7wT-infected
cells for 1.5min
(13.0
to 14.5 min afterinfection)
at30°C,
nocircle-associated 3H was detected
by
theprocedures
used above.Similarly,
nocirclesweredetected afterstopping
incorpora-tion with an excess of unlabeled
thymidine
and furtherincubation for 1.5 min.
However, by
3.5 minafterstopping
incorporation
of[3H]thymidine,
circle-associated 3H wasdetected and itsamountincreased
monotonically, roughly
inproportion
totheincreaseinbacteriophage-associated
3Hat 5.5 and 7.5 min after termination oflabeling (data
notshown).
This result indicates that thecirclesaretheproduct
ofaprocess thatoccursafter DNA
replication.
Themecha-nism for the
production
ofcircles is discussed further below.Alterations caused
by
amber mutations ingenes 3 and 19.To determine the effects on intracellular DNA of
removing
either
p3,
p19,
orboth,
theexperiment
ofFig.
lawasalsoperformed
withT73, T719,
andT73,19.
Apeak
attheposition
ofmature
bacteriophage
was notpresent in the sedimenta-tionprofile
for eitherT719
(Fig. lb), T73 (Fig. lc),
orT73,19
(not
shown),
asexpected.
TheT719
lysate
had both 32Sto lOOS DNA and10OS+
DNA(percentages
forT7WT,
T719,
T73,
andT73,19
areallgiven
inTable1).
TheT73
andT73,19
lysates
had a percentage of10OS+
DNA that wassignifi-cantly higher
than that in bothT7WT
andT719
lysates.
The percentageof 32StolOOSDNAintheT73
andT73,19 lysates
was
comparably
reduced(Table 1).
These observationsare in agreement with those madepreviously
forT73
andT719
lysates
(24).
To furthercharacterize the
T719
andT73
DNAsfraction-ated in
gradients
suchasthoseinFig.
lband c, these DNAs weresubjected
tobothtwo-andone-dimensional agarosegel
electrophoresis.
By
two-dimensionalagarosegel
electropho-resis,
thecircularDNAdetected inT7WT
32Sto lOOS DNA was absent fromT719
32S to lOOS DNA(not
shown).
TheT719
32S tolOOS DNAwaseitherarrestedattheorigin
ofthefirst
electrophoresis
ormigrated
to aposition
on the arcoflinear DNAs.
During
unidirectionalelectrophoresis,
most32S to 100S DNA in T719 lysates migrated as concatemers, but did not form thebandof dimericconcatemersobserved
forT7WT in a 0.4% agarose gel (Fig. 2b). Analysis of T719 concatemersin the0.2%gel of Fig. 3 did reveal weak bands of dimeric andtrimeric concatemers, but these bands were reduced in intensity to levels that were at the limit of detection (data not shown). In addition, only a trace of monomeric DNA was observed in the T719 lysate (Fig. 2b). Thus, the presence of p19 was necessary for the appearance ofmost DNA that migrated as either monomeric DNA or a multimeric concatemer. The origin-associated DNA ob-served in the fraction that contained T7WT 100S+ DNA in Fig. 2a was also observed in the case of T719 100S+ DNA
(fraction24, Fig.2b). Some origin-associated DNA was also
found tocosediment with32S to 100S DNA in Fig. 2b. Inthe case of T73, almost all of the 100S+ DNA detected was origin associated (fraction 24 in Fig. 2c). In addition, origin-associated DNA was found in the 32S to 100S region of thegradient. These observations have also been madefor
T73,19
DNA(notshown). No evidence for the accumulation of32Sto100Sconcatemersin either T73 orT73,19
lysates was observed. Onthecontrary, thedata in Table 1 indicate that32Sto100S concatemers were decreased by at least a factor of 3 in theT73 lysate. The data of Fig. 2c suggest that the
decrease was even higherthanthis. The abovedata do not
reveal whether concatemers arepartof theorigin-associated
T73100S+ DNA.
Digestion with restriction endonucleases. (i)T7WT. If either
concatemeric or circular DNA is a constituent of either
100S+or32Sto100SDNA, then digestion with a restriction
endonuclease will produce a fragment (termini-joined [TJ]
fragment) that consists of joined terminal fragments of
monomeric DNA(24, 44)ifno region of theTJfragmentis
branched. Thus,tofurther characterizethe DNAsobserved
inFig. 1, asampleof each fraction wasdigestedwith either
one or more restriction endonuclease and the fragments
produced were analyzed by agarose gel
electrophoresis-fluorography. The fragments released from T7 DNAs in
fractions of the gradient in Fig. la
(T7WT)
were observedafter digestion by the following mixture of restriction
endonucleases: XbaI (four fragments released from
mono-meric T7DNA) and EcoRI, BamHI, and PstI (none ofthe
latter three cut T7DNA, but theydo cut E.coliDNA). Such
analysis of DNA released from mature T7 bacteriophage
(fractions
26 to 29 in Fig. 6a) revealed the A, B, C, and Dfragments ofXbaIdescribedpreviously (35). At theposition
of monomeric DNA
(vertical
arrow 1 inFig.
6a), the sameprofile wasobserved. However, as the S valueofthe DNA
increased from 32S, an additional band, closer than the A
band to the origin of electrophoresis, was observed to
increasein
intensity.
Also,theintensity ofthebandsformedby
fragments
from theleft(Aband)andright (D band)ends ofmatureT7 DNA decreased in relation to theintensityof the B and C bands. Neitherthemigration
distance northeintensity of the additional band was altered when EcoRI,
BamHI, and PstI were omittedfrom the
digestion
mixture(notshown),
indicating
that this bandwasformedby
T7, nothost,DNA. These observationssuggest that this additional
band was formed by a TJ
fragment.
From its position inagarosegels (seealso
Fig.
7),this TJfragment
hadalength0.48±0.03timesthe
length
ofmatureT7DNA,
equal
withinexperimental error to the
length
of afragment (TJ[L-R])
consisting ofthe A
(left end)
and D(right end) fragments.
This length is
significantly
different from thelength
of afragment(TJ[L-L])
consisting
oftwoleft endsorafragment
(TJ[R-R]) consisting oftwo
right
ends. The data ofFig.
5on November 10, 2019 by guest
http://jvi.asm.org/
20 2 30
! I!
79
w
Iz
- TJ(L-L)-TV{L-R) 4~*% --B
. -F 'I
D
rnu.;;; * --dl
4
,-*-, -*.. aU d.a..b 6II&..
---TJ(L-LI
-TJlL-
LRI1
-TJ(L-R)
-j-A
-8 C
-49
-Host
TJ(L-L)
--TJ(L-R)
_-A
-B
LC
-D
FIG. 6. Digestion of fractionated intracellular T7 DNA with restriction endonuclease XbaI. A portion of each fraction of a sucrose-Nycodenz gradientwasdigestedtocompletionwith restric-tion endonucleaseXbaI asdescribed in Materials and Methods. A
25-,ul amountof eachdigestwasthen subjectedtoelectrophoresis through a0.7%agarosegelat0.5 V/cm for24 hinelectrophoresis buffer A. After electrophoresis, the gel was subjected to fluoro-graphyasdescribed in Materials and Methods. Thelysatesanalyzed were(a)T7wT, (b)T7WT(the same gel butexposed three timesas long),and(c) T719. Thearrowheadsindicate theorigins of electro-phoresis;theopenarrowindicates the direction ofelectrophoresis. indicate that most of the TJ fragments were from linear
concatemers, not circles.
When thefluorogram ofFig. 6a was exposed three times as long as it was exposed for Fig. 6a, two additional,
comparatively weak bands appeared at the position in the
gradient of concatemer-sedimenting, but not monomeric,
DNA(Fig. 6b). Thesebandswere also present when EcoRI,
BamHI, and PstI were omitted from an XbaI digest (not
shown). Thus,itis concluded that thefragments that formed
these latter twobands were released fromT7 concatemers
by XbaI. The larger fragment (TJ[L-L] in Fig. 6b) had a
molecular weight 0.62 + 0.03 times that ofmonomeric T7
DNA, indistinguishable from twice the molecular weight of
the A (left end) fragment. It is therefore assumed that the TJ(L-L) fragment consists of two joined A fragments and was cut from a left-end to left-end joined region in a concatemer. The smaller fragment, marked with an asterisk
inFig. 6b,had a length 0.19 + 0.01 times that ofmonomeric
DNA,significantly differentfrom twice the molecular weight
of the A (right end) fragment. There are, thus far, no data
that indicate the nucleotide sequences in the fragment
marked withan asterisk in Fig. 6b.
(ii) T719. When the experiment of Fig. 6a was repeated
with T719, but omitting the EcoRI, BamHI, and PstI, the TJ(L-R) fragmentwasfoundin32Sto 100Sand100S+ DNA. Inrelationto the B and C fragments, theTJ(L-R) fragment was more abundant and the A and D fragments were less abundant at all S values in theT719 DNA of Fig. 6c than they werein the T7WT DNA of Fig. 6a. The D fragment and the fragment indicated withanasteriskwere notdetectedatall in the T719 32S to 100S DNA. Onlya comparatively small amount of D fragment was released from the T719 100S+ DNA(Fig. 6c). In relation to the A fragment,the Dfragment appeared depressed by a factor of more than 10 by the absence ofp19. The preferential loss ofthefragmentat the right end was alsoobserved when restriction endonuclease XbaI (left-end fragment larger than right-end fragment)was
replaced byBglII (left-end fragment smaller than right-end
fragment) and AvaI (left-end fragment approximately the same size as right-end fragment; see below) (data not shown). These observations indicate that the selective loss of the right-end XbaI fragmentin T719intracellular DNA is caused by the position of this fragment, notby its relative size. The DNAforming the band marked hostinFig. 6cwas digested by the mixture of EcoRI, BamHI, and PstI (not shown) and was thereforeE. coli DNA. This3H-labeledhost DNA has beenpresentin all lysates thus far examined and was the onlybandof host DNA observed.
(iii)T73.Digestion of T73 100S+ DNA tocompletionwith
restriction endonucleaseXbaI released some of the
origin-associated DNA as fragments A, B, C, and D. However, most of the T73 100S+ DNA detected remained origin
associated after digestion withXbaI (Fig. 7a, lane 1). The
intensityof the bands(Fig. 7a,lane1)decreased in the order
DtoA, the reverse of the order that was observed formature T7 DNA(Fig. 6a,fractions26 to29;Fig. 7a, lane 4)and that was expected if fragments were released in equimolar
amounts. In contrast to the results obtained with T7WT
100S+ DNA(Fig. 7a, lane2)andT719100S+ DNA (Fig. 7a,
lane 3), the TJ(L-R) fragment was not released from T73
100S+ DNA.
a 1L 34
*w --Host
_.
-TJ
( -R)--,A
-. -B
40 -c
-GD
b
234
-. -TJ(L-R)
Lc
-D
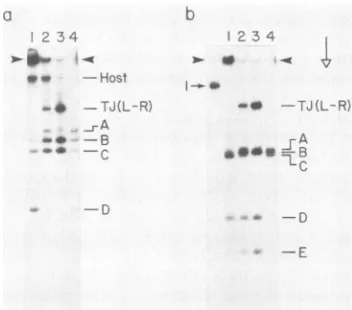
FIG. 7. Digestion of 100S+ DNA from T7wT (lanes 2), T719 (lanes 3), and T73 (lanes 1) lysateswith restriction endonucleases XbaIandAvaI.Asample of100S+DNA fromT7wT,T719, and T73 lysateswasdigestedtocompletionwitheither (a)Xbal or (b)AvaI
as described in MaterialsandMethods. Monomeric T7 DNA was alsodigested (lanes 4). The digests were then subjected to electro-phoresis in a0.7% agarose gelat 0.5 V/cm for 21 h; the gel was subjected to fluorography. The left-hand lane of panel b contains mature,undigestedT7 DNA.Panels a and b were different sections ofonegel. The arrowheadsindicate the origins of electrophoresis; theopenarrowindicates the direction of electrophoresis.
t
on November 10, 2019 by guest
http://jvi.asm.org/
[image:8.612.71.306.68.375.2] [image:8.612.356.532.461.616.2]The alteration in relative band intensities observed in the T73 100S+ DNA can be a function of either the relative size
of the fragments involved or their position on T7 DNA or
both.Toobserve the effects of position independent of size,
the 100S+ DNAs weredigested with restriction
endonucle-ase AvaI, an enzyrme whose fragments from the left end,
middle, and right end of monomeric T7 DNA vary by no
more than 6% in size. Two smaller fragments that separate
the middle fragment from the two end fragments are also
produced (35). TheAvaI digest of T73 100S+DNA (Fig. 7b,
lane 1) revealed band intensitiesthat decreased in the order
C (right end) > B (middle) > A (left end); no TJ fragment
was present. In contrast, the A and C bands had depressed
intensities relative to the B bandforT7WT
100S'
DNA (Fig.7b, lane 2) and T719 100S+ DNA (Fig. 7b, lane 3); the
intensities of the A, B, and C bands were indistinguishable
for the monomeric DNA (Fig. 7b, lane 4). The results for
T7WT and T719 100S+ DNA areinagreement with theabove
results obtained with restriction endonuclease XbaI in Fig.
6. The relative band intensities for the AvaI digest of T73
100S + DNAindicateaneffect of position. Thatis, fragments
werelost with increasing probability as distance from the left
end decreased. However, that an increased probability of
losing a fragment also occurs with increasing size of a
fragment was suggested by the observation that the C
fragment oftheXbaIdigestof T73100S+ DNA(Fig. 7a, lane
1) was moreintense than the largerBfragment,eventhough
the C fragment was at the left side ofthe B fragment(35).
The absence of the TJ fragment of XbaI and AvaI in T73
100S+DNAcouldhavebeencausedby eithertheabsenceof
left-to-right joined termini or the decreasing intensity of
bands with increasing size. A more extensive study of
left-to-right joining of termini in T73 100S+ DNA is in
progress.
As discussed above and below, the best explanation
fQr
the selective absence of fragments fromthe digests ofT73
100S+ DNA in Fig. 7 istheaccumulation of branchesinthis
DNA. To test this hypothesis, attempts were made to use
electron microscopy to compare the branching in T73 and
T7WT
100S+
DNAs. Inagreement
withpreviously reported
observations(24), both ofthese DNAs looked
indistinguish-able from thepreviously described (24, 29, 38) complicated
tangles ofDNA (datanot shown). Amore advanced
proce-dure for
analysis
of100S+
DNA structure is needed todescribe the branching of this DNA.
DISCUSSION
In the past, analysis of the DNA in lysates of
bacterio-phage T7-infected cells has been
performed by
rate-zonalcentrifugation
in adensity gradient, usually
followedby
fractionation ofthegradientandassayforDNA(21, 23, 29,
37, 38, 50) (Fig. 1). In part because the DNA
analyzed
isvariable in both molecular weight and conformation and becausefractionation ofthe
gradient
limitsresolution,
mul-timeric concatemers could not bereliably
detected in theseprevious studies. The
asymmetric spreading
of both themonomericDNAandthemultimericconcatemers
observed
hereisanadditional cause.
Although
attemptswere madetoavoid
overloading during
centrifugation,
overloading
is apossible explanation forsomeof this
spreading.
Apossible
additional
explanation
isdegradation
of morerapidly
sedi-menting
DNA to fprm thediscrete-length
DNAs detectedhere. This
degradation
could occureither
during
or aftercentrifugation.
Byuseofan
optical
procedure
forthedetection of DNAaftereither agarose
gel
electrophoresis
orrate-zonalcentrif-ugation, bandshavepreviouslybeenfoundattheposition of
monomeric DNA and dimeric concatemers after
fractiona-tionof nuclease Si digests of 100S+T7DNA (43, 44). Inone
study, a band for tetrameric but not trimeric concatemers
wasalso observed(44). Byanalysisof all of theDNAinaT7
lysate with a combination ofrate-zonal centrifugation and
agarose gel
electrophoresis-fluorography,
in the presentstudy bands were observed at the positions of dimeric,
trimeric,and sometimestetramericconcatemers not
associ-ated with 100S+ DNA. The reason for variations in the
relative intensity of bands at the positions of trimeric and
tetramericconcatemersis not known. The DNA that forms
these bands was found to be linear by two-dimensional
agarose
gel electrophoresis.
The 32S to 100S linear DNAalso contained TJ restriction endonuclease
fragments,
pre-dominantly
theTJ(L-R)fragment
expected ofa concatemerthat consists of monomeric DNAs
joined
left end toright
end. Itis concluded, therefore, that thefirst twobands are
formed
by
concatemersthataredimeric(±10%)
andtrimeric(±20%), respectively. Locating
moreprecisely
the ends ofthese concatemers and testing for nicks and gaps in their
polynucleotide chains require analysis of the concatemers
afterseparation byagarosegel electrophoresis;thisstudyis
being performed.
Formation ofconcatemerswith left-endto
right-end
join-ing
ofmonomeric DNA can occurby complementary
basepairing
at therepeated
ends madesingle-stranded (21, 24,
58).
Because theterminally repetitious
sequenceofT7 DNAis not an inverted repeat (9), left-end to left-endjoiningof
monomersina concatemer cannot occur
by complementary
base
pairing. Thus,
theTJ(L-L) fragment
observed herewould be produced by joining of blunt ends, presumably
catalyzed by
aligase
suchasthebacteriophage
T4ligase
thatjoins
DNAatblunt ends(47).
Thepresenceof theTJ(L-L)
band in
digests
of T719 concatemers indicates that DNApackaging
isnotrequired
forleft-end toleft-endjoining.
Thecircular T7 DNAfoundin
T7WT lysates
was notfoundin T719 lysates,
indicating
that DNApackaging
wasneces-saryfortheformation of thecircularDNA. This conclusion is consistent with the kinetics of the formation
of
circlesduring
infection with T7WT. Apossible
mechanism for theformationof circles
during
the initiation ofpackaging
(i.e.,
before DNA enters the
capsid)
isjuxtaposition
ofthe twoends ofamonomericDNAwithinaconcatemer,followed
by
recombinationbetween these ends. The
juxtaposition
wouldbecaused
by
capsid-DNA
binding.
Evidence forbinding
ofacapsid
ofT7concatemers at apoint
onthe DNA7%fromtheright
end has beenpresented (39).
Some monomeric andconcatemericDNA
observed
herewasreleasedfromcapsid-DNA
complexes by Sarkosyl
used forlysis (39).
Thepack-aging
specificity
ofT7-T3hybrids
confirms the presenceofaspecific binding
sitenear(but
notat)
theright
end(62).
If theright
endoftwosequential
monomersinaconcatemerwerebound
by
acapsid,
juxtaposition
of the two ends of themonomerclosesttothe
right
endoftheconcatemerwould beachieved
(Fig. 8).
Attheinitiationofpackaging,
thebinding
oftwo
sequential
monomersby
thecapsid
in aconcatemeralso
explains
thefollowing
observations.(i)
During
"invitro"
DNApackaging
withaT3 extract,theselectivity
for T3 DNA inpreference
to T7 DNA is greater forconcate-meric DNA than it
is
formonomericDNA(18);
thebinding
specificity
would be increased for a concatemerby
therebeing
twobinding
sitesinstead ofone.(ii)
The DNApack-aging
ofbacteriophages
Kand P22isprocessive (reviewed
inreferences 11 and
59);
theprocessivity
would be a conse-quenceof increasedprobability
forbinding
acapsid
ifasiteon November 10, 2019 by guest
http://jvi.asm.org/
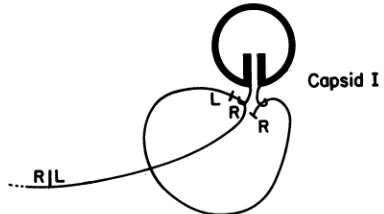
Capsid
IFIG. 8. Mechanism for the formation of circular DNAduringT7 DNApackaging.Theprocapsidofbacteriophage T7,referredtoas
capsid I (46), simultaneously binds two adjacent genomes in a
concatemer;thebindingsiteonbothgenomes isnearthegenome's rightend. A result is thejuxtapositionof the left(L)andright (R)
ends of the genome bracketed by the two binding sites. It is
proposedthat thisjuxtapositionincreases theprobabilityof
recom-bination between thetwoterminally repeatednucleotidesequences
of thebracketed genome,producingthe circular DNAobserved.
on the DNAeither has previously oris presentlybound to another capsid. (iii) In vitro packaging of concatemeric X
DNA requires an amount of DNA-capsid linking proteins (reviewedin reference 11)that istwicetheamount required
for in vitro packaging of monomeric DNA (reviewed in reference 59).
The mechanism of the selective loss of therightendofall intracellular forms ofT719DNAis notknown. One explana-tion is that initiation ofDNA packaging requires p19 and
protects the right end from intracellular nuclease-induced damage. In agreement with the hypothesis that initiation of DNApackaging by the procapsid prevents loss of theright
endofconcatemers,this end is also lost in the absence ofp9 (p9 is a protein essential for the formation ofa procapsid
[34]) (P. Serwer and R. H. Watson, unpublished data). Possibly, to initiate packaging a procapsid with the assis-tanceofp19binds the DNA to bepackagedattherightend of the DNA, as shown in Fig. 8, butwith the DNA's right
terminusalso bound tothecapsid.
Thedeficiency of bands formedby discrete-length DNAs in T719 lysatescan be explained, at least in part, by
degra-dationoftherightend ofconcatemers. It is alsopossiblethat thisdeficiencyis caused inpartbyeitheradeficiencyin the production ofdiscrete-length T719 concatemers or
concate-merizationmorerapidandextensivethan the concatemeriza-tion of T7WT. For example, packaging of concatemers in T7WTwould limit thegrowthofconcatemers. As therateand extentofconcatemerizationincrease,the fraction of DNA in those concatemers toolongtoisolatewithoutshear-induced breakage (6, 38) increases.
Theaccumulationofaform of10OS+DNA inT73 lysates
(24, 50) has been previously interpretedas an accumulation
of concatemers(16, 24, 27, 50). However, itwasfound here that mostof the DNA in T73 lysates is 1O0S+DNA that is origin associated after agarose gel electrophoresis. The
remaining DNA is 32S to 100S DNA, almost all origin associated during agarose gel electrophoresis. This 32S to lOOSDNA is thereforenotlinear, concatemeric DNA. The comparatively slow migration ofT73 DNA during agarose gel electrophoresis (see Results) and the evidence for branch-cleaving activity of p3 (7, 55) suggest that the
intracellular DNA that accumulates in T73 lysates is
branched. Thebranchingisextensiveenoughsothatmostof
the T73 100S+DNA remains origin associated even after
digestionwithrestrictionendonucleases XbaI andAvaI.The
data also indicate that thereare more branches on the left than on the right end of T7 DNA in T73
1OOS'
DNA complexes. A possible explanation is the previously demon-strated (17, 61)initiation of DNAreplicationonthe left end of T7 DNA. Inapparentanalogy withT7, bacteriophageT4 accumulates aDNA with theproperties of T73 10OS+DNA in the absence of T4 p49,aprotein that iscomplementedbyT7p3 (7). It has also been concluded thatT449DNA also has accumulated branches (28).
ACKNOWLEDGMENTS
We thank Elena T. Moreno and Helen C. Hoffer for technical assistance, Henry R.Hollyday III for constructingT73,19,and Anna M. Uriegas for secretarial assistance.
Supportwasreceivedfrom Public Health ServicegrantGM-24365 from the National Institutes of Health and the Robert A. Welch Foundation (grant AQ-764).
LITERATURE CITED
1. Bell, L., and B. Byers.1983.Separation of branched from linear DNAby two-dimensional gel electrophoresis. Anal. Biochem. 130:527-535.
2. Bloomfield, V. A., D. M. Crothers, and I. Tinoco, Jr. 1974. Physical chemistry of nucleic acids, p. 260-283. Harper and Row, NewYork.
3. Bonner, W. M., and R. A. Laskey. 1974. A film detection methodfor tritium-labeled proteins and nucleic acids in poly-acrylamide gels. Eur.J. Biochem. 46:83-88.
4. Center, M.S.,F. W.Studier,andC. C. Richardson. 1970.The structuralgeneforaT7endonucleaseessential for phage DNA synthesis. Proc.Natl. Acad. Sci. USA 65:242-248.
5. Chamberlain, J.P. 1979.Fluorographic detection of radioactiv-ity in polyacrylamide gels with the water-soluble fluor, sodium salicylate.Anal. Biochem.98:132-135.
6. Davison, P. F. 1959. The effect of hydrodynamic shearonthe deoxyribonucleic acid from T2 and T4 bacteriophages. Proc. Natl.Acad. Sci. USA45:1560-1568.
7. deMassy, B.,F. W.Studier,L.Dorgai,E.Appelbaum, and R. A. Weisberg. 1984. Enzymes and sites ofgenetic recombination: studies with gene-3 endonuclease of phage T7 andwith site-affinitymutants ofphage lambda. Cold Spring Harbor Symp. Quant. Biol.49:715-726.
8. Dressler, D., and H. Potter. 1982. Molecular mechanisms in geneticrecombination.Annu. Rev. Biochem.51:727-761. 9. Dunn, J. J., and F. W. Studier. 1983. Complete nucleotide
sequence of bacteriophage T7 DNA and the locations of T7 geneticelements. J. Mol. Biol. 166:477-535.
10. Earnshaw,W.C., andS. R.Casjens. 1980.DNApackaging by thedouble-strandedDNAbacteriophages. Cell21:319-331. 11. Feiss, M. 1986. Terminase and the recognition, cutting and
packaging ofX chromosomes. Trends Genet.2:100-104. 12. Feiss,M., and A. Becker.1983. DNApackaging and cutting,p.
305-330. In R. W. Hendrix, J. W. Roberts, and F. W. Stahl (ed.), LambdaII.ColdSpringHarborLaboratory, Cold Spring Harbor,N.Y.
13. Fisher,H.W.,andR. C. Williams.1979. Electron microscopic visualizationof nucleic acids and their complexes with proteins. Annu.Rev. Biochem. 48:649-679.
14. Ford, T., and D. Rickwood. 1983. Analysis of macromolecules and macromolecularinteractions using isopycniccentrifugation, p. 23-41. In D. Rickwood (ed.), lodinated density gradient media: apractical approach. IRLPress, Oxford.
15. Freifelder, D. 1970. Molecularweights ofcoliphages and coli-phageDNA. J. Mol. Biol. 54:567-577.
16. Frolich, B., A. Powling, and R. Knippers. 1975. Formation of concatemeric DNA in bacteriophageT7-infected bacteria. Vi-rology65:455-468.
17. Fuller, C. W.,andC. C. Richardson. 1985. Initiationof DNA replicationattheprimary origin ofbacteriophage T7 by purified proteins. Site anddirection of initial DNA synthesis. J. Biol. Chem. 260:3185-3196.