XXX-X-XXXX-XXXX-X/XX/$XX.00 ©20XX IEEE
Automatic 3D Detection and Segmentation of Head and Neck
Cancer from MRI Data
Baixiang Zhao, John Soraghan, and Gaetano Di-caterina
Centre for Signal and Image processing, Department of electronics and electrical
enginering University of Strathclyde, Glasgow,United Kingdom [email protected],
[email protected], [email protected]
Derek Grose
Beatson West of Scotland Cancer Centre
Glasgow,United Kingdom [email protected]
Trushali Doshi
Micrima Limited
Bristol, UK [email protected]
Abstract—A novel algorithm for automatic head and neck 3D tumour segmentation from magnetic resonance imaging (MRI) is presented. The proposed algorithm pre-processes the MRI data slices to enhance quality and reduce artefacts. An intensity standardisation process is performed between slices, followed by cancer region segmentation of central slice, to get the correct intensity range and rough location of tumour regions. Fourier interpolation is applied to create isotropic 3D MRI volume. A new location-constrained 3D level set method segments the tumour from the interpolated MRI volume. The proposed algorithm is tested on real MRI data. The results show that the novel 3D tumour volume extraction algorithm has an improved dice score and F-measure when compared to the previous 2D and 3D segmentation method.
Keywords—Magnetic resonance imaging, head and neck cancer, Fourier interpolation, fuzzy clustering, 3D level set method
I. INTRODUCTION
According to the World Health Organisation [1], approximately 8.8 million people worldwide died from cancer in 2015. Radiotherapy, along with surgery, provides the main option for curative treatment. Radiotherapy planning is a complicated and lengthy process requiring detailed defining of complex cancer regions. This area is referred to as the Gross Tumour Volume (GTV). Definition of this region is fundamental to accurate and effective radiation treatment planning. Development of automated delineation methods can reduce inter and intra variabilities of manual tumour delineation, and provide objective and reliable assistance to clinical oncologists to reduce work load and improve radiation treatment [2].
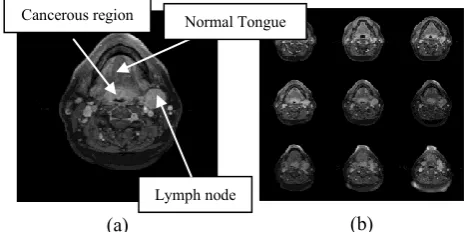
Fig.1 (a) shows a T1 weighted gadolinium-enhanced head and neck MR image with tongue base tumours. It is known that the tumour region has fuzzy boundaries and it is not significantly distinct from neighbour tissues. Furthermore as seen in Fig.1 (b) artefacts of MRI data, such as uneven illumination, are obvious. All these make automatic tumour segmentation a very challenging task.
A variety of algorithms have been proposed for head and neck cancer segmentation, such as atlas-based techniques [3], training-based approaches [4], and Deformable model [5, 6].
However, these methods cannot efficiently solve the automatic segmentation challenge. The work in [5] relies on manually initialisation, which is neither automatic nor objective while in [3], the atlas-based and [4] the training-based approaches relies on an atlas or large amount of labelled data. Also, from the review of deep learning research on medical image[7], currently no efficient deep learning approach is applied on head and neck cancer segmentation, this may indicate that the trending deep learning method can still not solve our challenge well. The work in [6] applies 3D level set segmentation to bone segmentation from CT data which have a significant contrast difference. Our previous work [8] presented an automatic 2D tumour segmentation method, which was tested on real MRI slices. In [9], 3D throat detection was obtained as interpolation of segmented 2D MRI slices. The novel work presented in this paper addresses the automatic extraction of 3D tumour models (with poor contrast difference) from a series of MRI slices, using a new 3D level set method (LSM).
[image:1.595.311.546.445.561.2](a) (b)
Fig. 1. (a) A T1-weighted Gadolinium-enhanced head and neck MR image example with cancerous lymph nodes; (b) A image serires from one MRI dataset
This paper presents a new fully automatic algorithm to segment 3D tumour volume from T1-weighted Gadolinium-enhanced MRI data. The challenges of this work include segmenting tumour regions with fuzzy boundaries, irregular shapes, non-uniform intensities, and avoiding adjacent anatomical structures. It is essential to determine the intensity range of the tumour area; also the size of the initialisation cube for 3D LSM can also impact the final result. This algorithm is validated on real MRI data from the Beatson West of Scotland Cancer Centre, in Glasgow.
*Research supported by Beatson Cancer Charity.
Fig. 2. Workflow of proposed head and neck cancer segmentation system.
The remainder of the paper is organised as follows. Section 2 describes the new automatic 3D tumour detection, segmentation and visualisation algorithm. Section 3 demonstrates the experimental results on real MRI datasets. The last section concludes the paper.
II. AUTOMATIC HEAD AND NECK TUMOUR 3D SEGMENTATION
The proposed head and neck tumour segmentation process as shown in Fig.2 contains three parts: a) image pre-processing, b) tumour detection on central slice, c) tumour segmentation with 3D location-constrained LSM.
A. Image pre-processing
In this work, multiple pre-processing techniques are applied on MRI data for artefacts removing and image enhancing. Background noise is minimised using morphological opening and majority operation [10], which can remove small noisy regions while preserve edges in the image. The images are enhanced by background brightness preserving contrast enhancement technique [11].
There are two types of intensity variations in MRI data. The first type is intensity inhomogeneity (also named as Bias field) [12] on single slice. In this paper, inhomogeneity (Bias) is estimated and corrected based on techniques from [13]. The second type of intensity variation is between slices; it occurs when a certain measured intensity cannot be associated with a specific tissue class [12] on all slices, which is solved by intensity standardisation between slices in this work [10].
(a) (b) (c)
(d) (e) (f)
Fig. 3. Intensity standardisation example: (a) central slice used as reference, (b) slice A before intensity standardisation, (c) slice A after intensity standardisation, (d) histogram of central slice, (e) histogram of slice A before standardisation, (f) histogram of slice A after standardisation.
As this work will use intensity based 3D level set method for tumour extraction, it is essential to take intensity standardisation to acquire uniform intensity range of tumour regions through all slices. Fig.3 demonstrates an example of intensity standardisation. It can be shown that after intensity standardisation, slice A has an intensity distribution more similar to the reference slice. Thus a uniform intensity range of tumour regions through all slices can be determined.
The MRI data used in this work has anisotropic voxels, while 3D LSM only works well on isotropic voxels. Original voxels are converted to isotopic voxels through Fourier interpolation, which was introduced in [9]. The volume for LSM segmentation is reconstructed in 3D using both real and interpolated slices.
B. 2D tumour detection on central slice
To extract tumour from MRI data, first essential task is detecting rough location of tumour region. In this work, central slice is taken for 2D tumour detection. The detected 2D tumour region on central slice will be used as a guide for 3D tumour volume segmentation in following section.
Steps of tumour detection on central slice are also shown in Fig.2. The throat is detected by two fuzzy rules [8]. Then modified fuzzy c-mean (MFCM) [14] utilises intensity and spatial information of pixels to organise them into five clusters. Clustering into five categories is based on the assumption that a pre-processed head and neck MRI slice consists of four main tissue types (fatty tissue, cancer tissue, normal tissue, and normal muscle tissues) and background. Based on prior biomedical knowledge from clinicians, head and neck cancerous regions (tumour and cancerous lymph nodes) are normally located around the throat region, and they usually have first or second brightest intensity among all tissues, regions of interest are taken from these clusters and further refined. Combined with edge information of the original image, large regions are separated. And regions around throat will be preserved. Then symmetrical regions (if there are) on two very side of preserved regions will be detected and removed, because they are very likely to be salivary glands. Then watershed transform [15] is applied to further separate regions, and then small regions are removed. Thus a rough tumour region is detected, and this region can be used as an initial contour for 2D level set method to get the accurate tumour region on central slice.
[image:2.595.47.278.503.660.2](a) (b) (c) (d) (e)
Fig. 4. 2D tumour detection and segmentation on central slice of an interpolated MRI dataset. (a) Central slice and detected throat region (red region). (b) Selected cluster which contains tumour region. (c) Regions around throat further separated by watershed transform, the biggest sky blue region is the region of interest, i.e. rough tumour location. (d) Initial region for level set evolution, this region is eroded ROI (largest sky blue region in (c)). (e) Tumour region segmented by 2D level set method.
) ) ( ) ( ( )) ( ( )) ( ( x x div x F x t
(1)
Where the first term on the right hand side of Eq.1 is the external force (i.e. image force) which drives level set evolving to desired boundary and second term is internal force, term
) ) x ( ) x ( ( div
is the curvature of level set function
which keeps
smooth. Here, external force is given as [17]:dy ) A ) ) y ( I ( )( y , x ( M )) y ( ( dy ) A ) ) y ( I ( )( y , x ( M )) y ( ( F y out y in outx inx 2 2 (2)
Where
inx is the mean andin
A is the area of interior and
outx
andout
A of the exterior local region M(x,y) of each point on the evolving curve (zero level of level sets, i.e.=0). Based on Eq. 1 and Eq.2, level set evolution will stop when foreground and background have maximally separate mean intensities [17].
In Fig.4 (a)-(e), the workflow of 2D tumour region detection and segmentation is displayed. Finally, the 2D tumour region (call it Seg2D) is obtained through localised region-based level set method [5, 16]..
C. 3D tumour segmentation
Results of the level set evolution rely on the initialisation, which includes the position and size of initial volume. In this work, the position is set based on Seg2D, the proposed work takes central of Seg2D as horizontal position, and the vertical position is half of whole volume’s depth due to Seg2D is on the central slice. A symmetric pyramid is taken as initial volume. The pyramid’s max length and width are 5 percent of MRI volume’s axial size; and the length and width will be 1 on the top and bottom of MRI volume. These chosen values guarantee that the initial pyramid is not distant from tumour region. An example of initial pyramid is shown in Fig.5 (a).
In this work, the speed function F used for 3D level set evolution is modified based on [6]:
(
)
(
)
F
I
div g
(3)Where first term on right hand side of Eq.3 is external force (i.e. image force), I is image data and
is predefined lower bound of the gray-level of the target object, in this work lower bound of Seg2D is taken as
. The second term is internal force, anddiv g
(
)
is curvature flow weighted by gradient feature map g [6]. This level set function is only sensitive to intensities and can produce many false positives. Thus in this work, the speed function is modified as following:(
L( )
)
(
)
F
I
div g
(4)Where
L( )
I
is the location constrain of image force, which deweights image force of regions far from throat and initial volume, but keep weights of Seg2D region. The deweighting is based on two Gaussian distribution:2 2 ([ , ] [ , ]) 2 2 2 1 ([ , ]|[ , ], ) 2
p p s s
s x y x y
s p p s s s
s
f x y x y e
(5)
2 2 ([ , ] [ , ]) 2 2 2 1 ([ , ]|[ , ], ) 2
p p t t
t x y x y
t p p t t t
t
f x y x y e
(6)
Eq.5 shows the deweighting rule for regions away from initial volume centre (i.e. centre of Seg2D). Eq.6 shows the deweighting rule for regions away from throat region centre. These two rules are same for each layer of MRI volume.
[xp,yp] is the coordinate of pixel P, [x ys, s] is coordinate
of centre of Seg2D and [ , ]x yt t is coordinate of centre of throat region. s and t are automatically and adaptively set according to radius of Seg2D and throat region. Based on these two distributions, and the rule that keeping weight of Seg2D
region, the
L( )
I
is given as following:( )
.*max(
( .* ),
2 )
L
I
I
norm f
sf Seg D
tWhere norm means normalise the product of
f
s andf
t,Seg2D is a binary map which also fits the range [0,1]. In this way image force of pixels away from both Seg2D and throat region will significantly decreased, while the weight of Seg2D
will not be influenced. Introducing Eq.7 to Eq.4, a location-constrained level set function is acquired. Based on the Eq.4 and initialisation (Fig.5 (a)) of level set, the 3D tumour volume can be segmented as Fig.5 shown:
[image:4.595.43.285.154.229.2](a) (b) (c) (d)
Fig. 5. Tumour segmentation using 3D level set method: (a) initial cube, (b)(c)(d) 3D evolving process, (d) segmented tumour.
As demonstrated in Fig.5 (b)-(d), through level set evolution, the initial pyramid expanded or eroded in both vertical and horizontal planes, and finally converged at tumour’s surface.
III. EXPERIMENTAL RESULTS
The new algorithm was implemented in Matlab, running on a PC with 16G RAM, 3.2GHz Intel(R) Core(TM) i7-8700 CPU. Experiments were taken on real MRI datasets from Beatson West of Scotland Cancer Centre to test the performance of the new algorithm. The data contains T1-weighted Gadolinium-enhanced MR images. This part will demonstrate some results of proposed algorithm on real data, and also some quantitative
study compared with 2D plus interpolation algorithm [8], and other 3D algorithm [18].
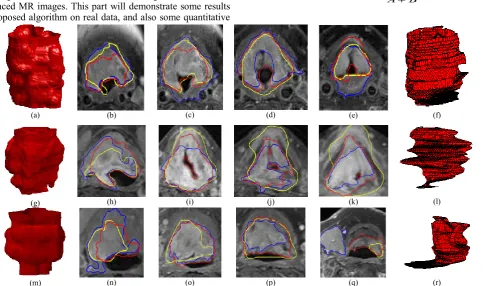
The comparison between results acquired from two methods (proposed and [8] ) is shown in Fig.6. Each row shows the results on one MRI dataset, and the left parts of each line ((a)(g)(m)) are 3D volume from proposed algorithm, right parts ((f)(l)(r)) are from 2D approach [8]. In the middle of each row are comparisons of 2D contours among proposed algorithm, 2D method, and gold standards. The gold standards are consensus tumour outlines on 2D axial slices according to clinicians from Beatson West of Scotland Cancer Centre. From the 2D contours comparison it can be seen that the proposed algorithm has similar segmentation compared with gold standards. Also, the visualisation of 3D tumour volumes in Fig.6 (a)(g)(m) shows that the proposed 3D method can produce tumour volume with smooth surface and consistent structure. On the other side, the volumes extracted by 2D approach [8] have sharp edges (Fig.6 (f)(l)(r)), and if there is inaccuracy in 2D segmentation (Fig.6 (q)), the structure of 3D volume will be inconsistent (Fig.6 (r)).
The quantitative measurements includes Dice Similarity Coefficients score (DSC), false positive (FP), false negative (FN), and F-measure. The measurements of proposed approach, 2D method [8] and threshold-based 3D level set method [18] will be compared.
The DSC is to measure similarity between two samples A and B; it can be calculated as given [19]:
2 ( ) ( , ) A B
DSC A B
A B
(8)
(a) (b) (c) (d) (e) (f)
(g) (h) (i) (j) (k) (l)
(m) (n) (o) (p) (q) (r)
[image:4.595.58.546.389.675.2]In Eq.8, the symbol
denotes the intersected area between contour A and contour B.The F-measure is given as:
FP TP
TP precision
,
FN TP
TP recall
recall precision
recall precision measure
F
2. .
(9)
Based on Eq. 8 and Eq. 9, the DSC and F-measure bar graphs are drawn:
[image:5.595.320.546.175.310.2](a) (b)
Fig. 7. Comparison of DSC and F-measure between 2D approach verses gold standards (consensus manual outlines), and proposed 3D method verses gold standards. The x axis represents dataset 1 to 10.
[image:5.595.50.275.200.311.2]From Fig.7, it can be seen that in half above datasets the proposed method performs better. The mean DSC of 2D approach on all ten datasets is 0.65, and the proposed 3D method is 0.70. The average F-measure of 2D+I is 0.70, and the average F-measure of proposed 3D method is 0.74. The quantitative study comparisons of proposed method, 2D method [8], and 3DLSM [18] are summarised in following table:
TABLE I. DSCS,F-MEASURE, FALSE POSITIVE, AND FALSE NEGATIVE COMPARISONS.
Methods DSCs F-measure FP FN
Proposed 0.6983 0.7386 0.2401 0.0039
2D+I 0.6484 0.7035 0.3187 0.0033
3DLSM 0.6302 0.6589 0.4199 0.0020
Table.1 lists the measurements of three approaches according to gold standards (manual consensus outlines). The DSCs, F-measure, FP and FN all show that the proposed method has better performance.
Fig.8 shows the time cost of proposed 3D approach and 2D approach. It can be seen that proposed approach requires less processing time. Furthermore, when the number of input slices increase, the time consumption of 2D method is increasing linearly, while time cost of proposed method is increasing with lower rate. The time consumption will be extremely vital then when the input data is huger.
The drawbacks of 2D approaches is that detection and segmentation are taken on every slice, this is time consuming, and any failure of detection can deteriorate 3D reconstruction result. The 3D approach only take detection once on central slice to get roughly start point, and then use intensity as guide to segment 3D volume, thus ensure the consistency of extracted 3D structure. Moreover, the location-constrained level set method efficiently reduced false positive rate of 3D level set method in head and neck tumour extraction, and thus gave better results.
Fig. 8. Time consumption of 2D and proposed 3D method, the x axis is the number of input slices, the y axis is the time cost in seconds.
IV. CONCLUSION
There are challenges for the automatic3D segmentation of tumours on T1 head and neck MRI datasets. 2D segmentation plus reconstruction approach suffers from serious artefacts, high time consumption, and as a result produce unsmooth 3D volume. Existed 3D level set methods may fail due to the intensity variations between slices, and indistinct tumour boundaries. This paper presented a new algorithm for automatic 3D tumours segmentation on T1 MRI datasets, which firstly applies intensity standardisation between slices using central slice as reference, then segments central slice’s cancer region, in this way, location and intensity range of tumour areas are determined; also, this work uses location-constrained level set method and successfully improved performance.
The proposed method was shown to work well on real MRI datasets. The results show this method has lower complexity costs compared to the previous 2D segmentation approach. The results on real data show that this algorithm can have better segmentation results, and can produce smooth surfaces as well as consistent structure.
In the future, this method will be tested on more MRI datasets. The modification on contrast enhancement methods and 3D level set function, and development of tumour start-end position detection are also objectives for future study.
ACKNOWLEDGEMENT
The authors would like to acknowledge grant from Beatson Cancer Charity for their financial support with this study.
[image:5.595.36.287.488.552.2][1] W. H. Organization. (2018 July 3rd). Global Health Observatory (GHO) data.
[2] T. Doshi et al., "Validation of a Magnetic Resonance Imaging-based Auto-contouring Software Tool for Gross Tumour Delineation in Head and Neck Cancer Radiotherapy Planning," Clinical Oncology, vol. 29, no. 1, pp. 60-67, 2017/01/01/ 2017. [3] X. Han et al., "Atlas-Based Auto-segmentation of Head and Neck
CT Images," in Medical Image Computing and Computer-Assisted Intervention – MICCAI 2008, Berlin, Heidelberg, 2008, pp. 434-441: Springer Berlin Heidelberg.
[4] Z. Zeng, T. Shepherd, and R. Zwiggelaar, "Hierarchical modelling for unsupervised tumour segmentation in PET," in Proceedings of 2012 IEEE-EMBS International Conference on Biomedical and Health Informatics, 2012, pp. 439-443.
[5] T. Doshi, J. Soraghan, L. Petropoulakis, D. Grose, and K. MacKenzie, "Semi-automatic segmentation of tongue tumors from magnetic resonance imaging," in 2013 20th International Conference on Systems, Signals and Image Processing (IWSSIP), 2013, pp. 143-146.
[6] Y. Zhang, B. J. Matuszewski, L. K. Shark, and C. J. Moore, "Medical Image Segmentation Using New Hybrid Level-Set Method," in 2008 Fifth International Conference BioMedical Visualization: Information Visualization in Medical and Biomedical Informatics, 2008, pp. 71-76.
[7] G. Litjens et al., "A survey on deep learning in medical image analysis," Medical Image Analysis, vol. 42, pp. 60-88, 2017/12/01/ 2017.
[8] T. Doshi et al., "Automatic pharynx and larynx cancer segmentation framework (PLCSF) on contrast enhanced MR images," Biomedical Signal Processing and Control, vol. 33, pp. 178-188, 2017/03/01/ 2017.
[9] S. Campbell et al., "3-dimensional throat region segmentation from MRI data based on fourier interpolation and 3-dimensional level set methods," in 2015 37th Annual International Conference of the IEEE Engineering in Medicine and Biology Society (EMBC), 2015, pp. 2419-2422.
[10] R. C. Gonzalez, "Digital image processing," ed: Prentice hall, 2016. [11] T. L. Tan, K. S. Sim, and C. P. Tso, "Image enhancement using
background brightness preserving histogram equalisation," Electronics Letters, vol. 48, no. 3, pp. 155-157, 2012. [12] F. Jager and J. Hornegger, "Nonrigid Registration of Joint
Histograms for Intensity Standardization in Magnetic Resonance Imaging," IEEE Transactions on Medical Imaging, vol. 28, no. 1, pp. 137-150, 2009.
[13] O. Salvado, C. Hillenbrand, Z. Shaoxiang, and D. L. Wilson, "Method to correct intensity inhomogeneity in MR images for atherosclerosis characterization," IEEE Transactions on Medical Imaging, vol. 25, no. 5, pp. 539-552, 2006.
[14] T. Doshi, J. Soraghan, D. Grose, K. MacKenzie, and L. Petropoulakis, "Modified fuzzy c-means clustering for automatic tongue base tumour extraction from MRI data," in 2014 22nd European Signal Processing Conference (EUSIPCO), 2014, pp. 2460-2464.
[15] V. Grau, A. U. J. Mewes, M. Alcaniz, R. Kikinis, and S. K. Warfield, "Improved watershed transform for medical image segmentation using prior information," IEEE Transactions on Medical Imaging, vol. 23, no. 4, pp. 447-458, 2004.
[16] S. Lankton and A. Tannenbaum, "Localizing Region-Based Active Contours," IEEE Transactions on Image Processing, vol. 17, no. 11, pp. 2029-2039, 2008.
[17] A. Yezzi, A. Tsai, and A. Willsky, "Medical image segmentation via coupled curve evolution equations with global constraints," in Proceedings IEEE Workshop on Mathematical Methods in Biomedical Image Analysis. MMBIA-2000 (Cat. No.PR00737), 2000, pp. 12-19.
[18] A. E. Lefohn, J. M. Kniss, C. D. Hansen, and R. T. Whitaker, "Interactive deformation and visualization of level set surfaces using graphics hardware," in IEEE Visualization, 2003. VIS 2003., 2003, pp. 75-82.
![Fig.2. The throat is detected by two fuzzy rules [8]. Then Steps of tumour detection on central slice are also shown in modified fuzzy c-mean (MFCM) [14] utilises intensity and spatial information of pixels to organise them into five clusters](https://thumb-us.123doks.com/thumbv2/123dok_us/1359350.89419/2.595.47.278.503.660/detected-detection-modified-utilises-intensity-information-organise-clusters.webp)