City, University of London Institutional Repository
Citation
:
Gandrud, C. and Hallerberg, M. (2017). Interpreting Fiscal Accounting Rules in
the European Union. Journal of European Public Policy, 24(6), pp. 832-851. doi:
10.1080/13501763.2017.1300182
This is the accepted version of the paper.
This version of the publication may differ from the final published
version.
Permanent repository link:
http://openaccess.city.ac.uk/16139/
Link to published version
:
http://dx.doi.org/10.1080/13501763.2017.1300182
Copyright and reuse:
City Research Online aims to make research
outputs of City, University of London available to a wider audience.
Copyright and Moral Rights remain with the author(s) and/or copyright
holders. URLs from City Research Online may be freely distributed and
linked to.
City Research Online:
http://openaccess.city.ac.uk/
publications@city.ac.uk
Interpreting Fiscal Accounting Rules in the European Union
Christopher Gandrud
City, University of London
Hertie School of Governance
∗Mark Hallerberg
Hertie School of Governance
December 22, 2016
Forthcoming at the Journal of European Public Policy
Abstract
In the European Union, the creation of public debt statistics starts with member state governments’
reports. The EU’s statistical agency–Eurostat–then revises. How do these actors’ incentives shape
reported numbers? Governments have incentives to take a more favourable view of often ambiguous
accounting rules than Eurostat. Lower debt improves governments’ performance with domestic and
external audiences. Eurostat is tasked with monitoring budgets for ‘excessive’ debts. We expect
govern-ments to present debt figures that Eurostat then revises upwards. This is more likely when governgovern-ments
have high debts, especially when in the eurozone, and prior to elections. Financial crises heighten the
number of policies needing interpretation and both actors have more incentives to shape the numbers.
We examine these propositions using Eurostat’s debt revisions. We find debts are revised upwards more
for eurozone countries with higher debt levels and years with unscheduled elections. Financial stress
strengthens these effects.
Keywords: fiscal policy, European Union, financial crisis, electoral budget cycles, Eurostat
Word count: 7,990
∗Christopher Gandrud is Lecturer in Quantitative International Political Economy at City, University of London and
Post-doctoral fellow at the Hertie School of Governance. Please contact him at Rhind Building, City, University of Lon-don, EC1V 0HB, LonLon-don, United Kingdom (christopher.gandrud@city.ac.uk). Mark Hallerberg is Professor of Pub-lic Management and Political Economy at the Hertie School of Governance, Friedrichstrasse 180, Berlin 10117, Germany
(hallerberg@hertie-school.org). Thank you to workshop participants at Texas A & M University and attendees at the
Euro-pean Political Science Association 2016 Annual Conference, Brussels. This work was supported by the Deutsche Forschungsge-meinschaft under grant number HA5996/2-1. Replication material can be found at: https://github.com/christophergandrud/
1
Introduction
European Union member state public debt statistics are first created by national governments. They
de-termine the budget implications of their policies by applying a shared statistical rule book–the European
System of Accounts (ESA). The European Union’s statistical agency–Eurostat–then monitors the
applica-tion of these rules. It can make revisions to the numbers. These actors have different incentives regarding
the production of these statistics. Member states want to demonstrate their competence to cost-conscious
voters and external audiences such as the European Commission and international investors. Eurostat also
broadly wants to be seen as a tough monitor of member states’ finances. This enables the Commission to
identify states that may be violating the Stability and Growth Pact’s (SGP) budget rules (?). How do these
incentives shape what debt numbers are reported and when?
Specifically, we examine to what extent and why governments may make more favourable interpretations
of the budget accounting rules than Eurostat when they determine how policies impact their debts. By ‘more
favourable fiscal rule interpretations’ we mean that when the fiscal implications of a policy are potentially
ambiguous under the ESA, a decision is made to interpret the rule in such a way as to minimise its effects
on the member state’s public balance sheet.
For example, in 2009 in response to widespread banking system stress, the Irish government proposed
creating a ‘bad bank’–the National Asset Management Agency–to acquire and dispose of Irish banks’ troubled
assets. It had two choices in terms of reporting the bad bank’s liabilities that were not obvious under the
accounting rules. They could count the bad bank’s liabilities as the government’s liabilities, thus increasing
the public debt, or they could be counted solely under the bad bank’s accounts, thus having no impact on
the public debt. The latter decision would have made the public accounts appear better, but may have
been interpreted as being against the EU’s accounting rules. Eurostat, more concerned with reporting fiscal
risks, may have later ruled against it. The government’s choice of the latter interpretation would be a more
favourable interpretation of the fiscal rule than Eurostat’s likely view.
Interaction between member states and Eurostat on their debt statistics is continuous. Eurostat regularly
revises European Union member states’ debt numbers. An interviewed Eurostat official1 described their
monitoring of member states’ debt statistics for the SGP as “police work” and that Eurostat is constantly
“running behind” member states’ new accounting attempts to reduce their policies’ debt implications. This
is born out in the data on revisions Eurostat has made to member states’ statistics. From 2003 through
2011, Eurostat revised three quarters of member state’s debt figures. On average, after a typical four year
review period, it revised debt figures upwards by one percentage point of GDP per year.2 In only a quarter
of these cases did Eurostat determine that debt was lower than originally reported, with the largest debt
reduction amounting to only 1.1 percent of GDP. 12 member states during this period had their debt figures
revised upward by two percentage points or more of GDP. Austria, Croatia, Greece, Ireland, and Portugal
all had at least one instance where their debt figures were revised upwards by nine percentage points of GDP
or more in a single year. Overall, Eurostat has tended to take a view of member states’ debt figures that is
less favourable to member states than their original reports.
Studying Eurostat revisions to member states’ debt statistics impacts a number of political science
literatures in interesting ways. ? explore the relationships between fiscal data transparency, elections, and
pressure from the European Union. They argue that European Union member states were more likely to
violate the Eurostat statistical agency’s budget reporting rules in ways that made the government look better
to voters when fiscal transparency was low and when it was an election year. A related strand focuses on
the economic vote and whether or not voters notice or incorporate information about these revisions into
their decisions. ? find that the press, and voters as a result, do not pay attention to revised figures.
If cost-conscious voters care most about initially reported, rather than actual, figures then governments
have electoral incentives to release data that is more favourable to them than what Eurostat will ultimately
allow. European Union institutions other than Eurostat and investors also influence member states’
incen-tives. ? argue that member states are more likely to use ‘creative accounting’ when their deficits approach
three percent of GDP. The reason is that such countries face a supranational fiscal rule under the Stability
and Growth Pact where they are expected to run budget deficits less than three percent of GDP (and debts
of less than 60 percent of GDP). More favourably interpreting statistical rules could give governments more
budgetary room not to have to cut back in areas voters care about in order to meet internationally agreed
commitments. Governments may similarly use favourable rule interpretations in order to maintain an
at-tractive balance sheet for foreign sovereign bond investors, thus allowing them to fund spending that voters
want. In more recent work that comes closest to our approach,? find that most European Union member
states are more likely to understate their deficits, that this behavior is more common in pre-electoral periods,
and less common with more stringent fiscal rules in place. We expand this research in several important
ways.
First, we consider the effects of financial crises on the likelihood of governments to favorably interpret
fiscal rules. Many tools commonly used to respond to financial crises–guarantees, liquidity assistance, bad
banks–have potentially ambiguous fiscal implications. This creates more opportunities for disagreement
between member states and Eurostat about how their costs are counted. Additionally, during a financial
crisis, electorally and SGP-motivated incentives to limit reported debts are more pronounced. Financial
crises substantially strain public budgets as economic activity and so tax revenue decreases, while bank
bailout policies may incur significant expenses. At the same time, Eurostat may be under more pressure
from other EU institutions and member states to be more vigilant during crises in spotting ‘excessive’ debts.
They will be under greater pressure to spot the fiscal problems that the SGP is designed to prevent.
Second, unlike ?, who discuss any revision to deficit figures, we focus on revisions to debt figures, and
specifically on those that Eurostat requires. There are several reasons to focus on debt data revisions made
by Eurostat. First, as ? note for so-called ‘stock-flow’ adjustments and? separately note using a balance
sheet approach, that there are many operations that governments can use that change deficit figures without
any need for revisions of deficit figures. This suggests that? may underplay the extent of the manipulation.
Note that the operations the authors above describe reduce the reported deficit, but do not affect the gross
debt burden. It is in the latter part of government accounts where we focus our attention. Additionally,
many operations governments engage in during financial crises appear on the debt ledger, and studies that
focus only on deficits will miss the behavior of governments during such periods. Policies such as bank
guarantees, liquidity assistance, and nationalizations have potentially ambiguous effects on the public debt,
largely because they create contingent rather than immediately realized liabilities which can be difficult to
catergorise.
The third contrast with previous research concerns the countries and years included in our sample–we
use a data set of the EU-28 members and include data from the the period 2003-2013, which allows us to
consider the effects of financial crises.3
Our dataset is composed only of European Union member states. This is useful for several reasons beyond
our interest in studying interactions between Eurostat and member states. All EU members fall under the
same set of fiscal rules–the European System of Accounts (ESA)–, although the penalties for violating the
rules are theoretically greater for eurozone states. Importantly for our analysis, national agencies produce the
initial fiscal figures. They report this data to one body–Eurostat–which then evaluates the data and enforces
the accounting standards by revising governments’ original figures. This means that differences across
countries in initial reporting are not due to different accounting rules, but instead different interpretations of
these rules. Institutionally, these countries are all parliamentary or semi-presidential systems where elections
are crucial for the formation of governments.
2
Budgeting interactions between member states and Eurostat
Member states have many possible incentives from domestic and external sources to take more favourable
views of the budget rules than Eurostat. In this section we discuss member states’ possible incentives in
detail and contrast them with Eurostat’s.
2.1
Favourable interpretations for domestic audiences
The literature on the economic vote often assumes that voters are able to access regular data on the state
of the economy and they use this to determine their government’s economic policy management competence
(for a discussion see?). One debate considers whether voters are prospective or retrospective. On the latter,
the assumption is that voters observe outcomes, and they decide whether or not to support the incumbent
government. In response to the strong assumptions about voter knowledge, there is a growing literature on
‘real-time fiscal policy’. ? argue that the press ignores revisions to data. Moreover, ? find that voters pay
particular attention to data they do not experience themselves. They observe unemployment, for example,
but they do not observe economic growth and instead rely on reported figures when making decisions about
which party to support. In our case, we are interested in government fiscal data that only the government
can report. If one combines the insights in the two papers, they suggest that voters make decisions on the
first set of data they see. This would make manipulation of such data potentially rewarding for governments
that seek to remain in office.
Following ?, as well as ?, one would anticipate that there are opportunistic business cycles where
gov-ernments manipulate macro-economic tools at their disposal in an effort to make the economy look better
before an election. ? finds the tools a government uses depends upon the logic of the Mundell-Fleming
model: if one assumes that capital is mobile, a government relies on monetary policy when the exchange
rate is flexible while it leans on fiscal policy when the exchange rate is fixed. Both Nordhaus and Clark,
however, focus on actual economic output from the use of these instruments.
We are interested in the perceived figures. In the ‘strongest’ version of the electoral incentives approach,
voters are very attentive to public debts and politicians know this. Voters are concerned with both economic
figures, which may be improved by government spending, as well as a countervailing concern for fiscal figures.
So governments have an interest in spending more at elections, while also taking steps to make their balance
sheets look better. We are interested in the latter behavior here.
There is a possible spin-off from Clark’s argument. One can expect that extra spending in EU member
states with flexible exchange rates has no macro-economic payoffs, while it does have payoffs in countries
with fixed exchange rates, which will mostly be those in the eurozone.4 Governments may, however, want
to look good to their voters on budget figures even in countries with flexible exchange rates.
At the same time, there is an opposite force at work. Governments do not want to present completely
non-credible figures for fear that voters (and external actors we detail below) will heavily discount them.
As discussed, in the European Union there is an external third party–Eurostat–that makes decisions on the
credibility of debt figures. As a supranational agency appointed by the European Commission, Eurostat
lacks the electoral incentives to interpret rules in member states’ favour. Instead, Eurostat is tasked with
enforcing a common set of rules across member states and especially monitoring their budgets for ‘excessive’
debts and deficits, as defined by the Stability and Growth Pact (see ?). The body regularly publicises
non-credible figures, though it may take a few years for their review to play out.
We would expect that governments will avoid always presenting highly favourable interpretations given
that there is an independent body that monitors them. Instead they may alternate the intensity of this
behaviour in conjunction with situations under which there are stronger incentives to do so. This suggests
that there may be a cycle to this behaviour according to elections. ? in fact find that fiscal data for years
closer to elections are revised by Eurostat more.
Moreover, we add two additional parts to the model. First, and separate from? who focus on all election
years, we anticipate that manipulation of figures is greater when the government calls an early election.
This means that it is unscheduled and does not go to full-term. The reasoning follows the insights of ?
on the use of instruments, but with the expectation that elections called quickly–largely for non-fiscal or
economic reasons–do not give the government time to affect the economy directly either through monetary
or fiscal policy. ? finds that manipulation of the economy before unscheduled elections is too cumbersome
and too difficult to time. This suggests that the manipulations are substitutes for actual instrument use.
Governments are manipulating budget figures on the margin to appear more competent to voters.
Second, we are interested in circumstances under which governments can more easily manipulate the
figures. Where are the ‘grey’ areas in terms of the classification of assets and liabilities? For?, those ‘grey’
areas are in the budgetary shadows, in places where there is less transparency. However, as we discuss
in more detail below, there are many policies, especially those used during a financial crisis such as bank
guarantees, that are complex and often difficult to classify for experts, let alone voters. As such, having a
transparent budget process may not prevent governments from taking highly favourable views of accounting
rules.
2.2
Favourable interpretations for external audiences
Domestic voters may not be the only or, in some contexts, even the primary actor the government is trying to
impress with its budget statistics. There is evidence that countries intentionally distort statistics so that they
receive some sort of payoff from international organisations. For example,? find that some African countries
kept their per capita incomes below the eligibility threshold for World Bank’s International Development
Association. This is a clear case where governments change their official statistics in response to expectations
from international organisations.
Reported outcomes in terms of economic and fiscal data have a real impact on policy, especially in
Euro-pean Union countries because of the role of EU institutions, and in particular the EuroEuro-pean Commission and
Council of Ministers. GDP figures affect what type of co-financing governments receive from the European
Union for a range of activities, such as environmental protection, guarantees for small and medium-sized
enterprises loans, and the construction of roads.5 Under the Stability and Growth Pact, all member states
are expected to have budget balances no worse than 3 percent of GDP and debt burden no greater than
60 percent of GDP. The European Commission decides each year whether a member state has an ‘excessive
deficit’, with those earning this distinction subject to an Excessive Deficit Procedure (EDP). Member states
in an EDP must propose corrective methods. The subset that are also eurozone members face potential
penalties, such as fines. Member states that do not adjust their performance could lose their access to
structural and cohesion funds, which are the largest part of the European Union budget. As such, we would
expect governments to have more favourable statistical rule interpretations as they approach and are above
SGP limits, especially if they are in the eurozone.
There are several articles that find empirical support for the argument that European Union member
states adjust their national accounts so that their figures look better to European authorities. ? find
that governments resort to more fiscal gimmicks in Europe, which include one-off measures that make final
budget figures look better, the more binding the fiscal rule in place. ? document that so-called ‘stock-flow
adjustments’ increase as member states approach the deficit maximum of 3 percent of GDP. Similarly, ?,
using a balance sheet approach, find that member states adjust their budget figures in ways that make it
more likely they comply under the European rules but also in ways that do not affect the overall net worth
of the government.
The impact of external audience evaluations and voters’ interests are not mutually exclusive. The former
could reinforce the latter. For example, a member state that receives a negative European Union evaluation
of its fiscal policy may lose credibility as competent in voters’ eyes. The member state may feel pressure to
cut spending on activities that voters want and/or raise taxes. So, even if voters did not pay attention to
public debt statistics, in the EU member states and especially eurozone countries, governments have electoral
incentives generated by the EU to limit their debts.
2.3
Favourable interpretations during financial crises
Governments in countries that experience financial market stress and crises face considerable fiscal difficulties
(see?) that heighten politicians’ incentives to interpret fiscal rules in their favour. At the same time, and an
unexplored area in the literature, the policy options available to politicians to respond to financial crises–e.g.
buying equity in failing banks, bad banks, and bank nationalizations–present numerous opportunities for
fiscal rule optimism. As such, we expect politicians to engage in favourable accounting even more during
periods of financial market stress and crisis.
? argue that many of the policies available to politicians, especially during the 2008-2011 crisis in
Europe, were both rarely used before and had potentially ambiguous budget implications. If a government
buys equity in a troubled bank as, for example, Ireland did with Irish Nationwide Building Society and
the Educational Building Society in 2010 has the government spent money or does it have a different, but
equivalently valued asset? Does the transaction hit the budget, or is it what the European System of
Accounts terms a ‘financial transaction’, with no effect on the budget? If a government owns a stake in a
bad bank–otherwise known as an asset management company (AMC)–used to clean up a failed bank, are
the AMC’s liabilities also government liabilities counted against its debt? Or are they what the ESA terms
‘contingent liabilities’, where the government is liable only if the AMC cannot repay them? These questions
are particularly difficult to answer because they rely on complex and opaque information about probabilistic
outcomes (?). For example, whether a publicly guaranteed AMC ends up costing the public money largely
money as it paid for them. It is difficult to predictex ante whether a non-performing asset held by an AMC
will become performing or can be sold for a particular value in the future. Governments with incentives to
minimise crisis costs, have incentives to take optimistic views of these probabilities.
It is important to emphasise that another component of why we would expect to see more revisions
during crises is that there are generally more instances during financial market stress where it is difficult to
determine how a policy affects the public debt. Thus, regardless of politicians’ incentives, we would expect
there to be a highernumber of revisions made to public debt statistics during higher financial market stress
than otherwise. However, if governments lack incentives to rule in their favour in these instances, then we
would expect revisions to sum to zero because there should be no bias one way or the other. On the other
hand, if they do have these incentives, then revisions should be positive (i.e. debts were higher than initially
reported).
Eurostat also has more incentive to monitor member states’ budget statistics during crises. The contagion
risks of fiscal profligacy for other member states, which the SGP is designed to limit, will be higher during
crises as more national budgets will be stressed. Therefore, Eurostat has more incentive to be vigilant so as
not to a miss fiscal risk that could harm other member states. 6
2.4
National control of fiscal accounting
An assumption of the previous discussion is that elected politicians have at least some control over budget
statistics. Is this a reasonable assumption? Given our focus on democratic European countries with advanced
economies, perhaps there are politically independent national statistical agencies that are primarily
responsi-ble for compiling and monitoring budget statistics and are unmotivated by elections. While such institutions
do indeed exist, there are a number of reasons to be skeptical that they fully control creation of public
finance data. First, research by the International Monetary Fund (?) finds that in our observation period
(2003-2013) only six EU member states had fiscal councils in place, which amount to national independent
debt rule monitoring institutions.7 Second, these bodies, as well as other domestic statistical agencies, react
to government figures and cannot prevent an initial act of interpreting rules in a highly favourable manner
for politicians. In practice, the process of applying statistical rules involves disagreements between domestic
political and non-political bureaucratic actors, as well as Eurostat. The result can be a Eurostat revision.
6While anecdotal, our interviews with Eurostat officials and our review of Eurostat’s official opinions from the early 2000s through the eurozone debt crisis indicates that Eurostat was much more vigilant in the crisis period and especially did not want to be blamed for missing another situation like Greece, where the numbers were found to be highly understated.
For example,? describe how in 2009–an election year–the German Ministry of Finance initially classified its
newly created AMC–Erste Abwicklungsanstalt (EEA) used to clean up the failed lender WestLB–as a
contin-gent liability. As such it did not impact the public debt. The German statistical agency–Destatis–disputed
this decision. In 2010 Eurostat, responding to the dispute, determined EEA counted as a liability against
the government’s debt.8 We further consider the characteristics of national budget institutions below.
3
Hypotheses
We will test the following hypotheses for explaining Eurostat’s upward revisions to member states’ debt
figures:
H1: Debt revisions will be larger for years closer to national government elections.
H2: Debt revisions will be greater for years when there are unscheduled elections.
H3: Debt revisions will be larger for EU countries with larger debts.
H4The effects predicted by H3 will be stronger when a country is in the eurozone.
H5: The effects predicted by the first three of these hypotheses will be stronger when a country
also has high financial market stress.
Please see the Online Appendix for a discussion of several alternative explanations which we also
inves-tigate in the empirical section.
4
Empirical tests: Set up
To test our hypotheses, we ran a series of linear regressions with cumulative debt revisions made by Eurostat
as the dependent variable and a number of relevant political and economic indicators on the right-hand side.
4.1
Dependent variable: Eurostat revisions
We gathered a data set of all revisions that Eurostat made to EU member state debt figures from 2003
through 2013.9 This sample includes debt data revisions for all EU member states as of 2016. Eurostat
8For more details see: http://ec.europa.eu/eurostat/documents/1015035/2993710/471529-let-WR-BMF-EAA.pdf/
a52a49df-0785-4dd3-a943-8d45fd4a847a. Accessed March 2016.
publishes revisions bi-annually–typically once at the end of April and again in late October. These revisions
cover government finance statistics released within the previous four years. For every year that government
statistics are revised, there are up to seven revisions: the first revision occurs in October of the initial
reporting year and continues bi-annually for three years thereafter.
We used this data to create a variable of cumulative debt revisions as a percent of GDP by at least the
final possible revision year. As such our unit of analysis is country-budget year and the sample was truncated
to the 2011 budget year so that we only include data that has been revised for three years. We used this as
our dependent variable. The variable ranged from -1.1 to 12.7 percent of GDP.10It is important to note that
these revisions were not due to corrections made to the denominator: GDP. Eurostat reports GDP revisions
separately from corrections made to debt data. As mentioned earlier and corroborated by? in a sample of
Eurostat data from the pre-financial crisis period, there is a clear tendency for fiscal statistics to be revised
such that, in the aggregate, policies are more expensive than governments initially reported.
This proxy for rule interpretation differences is related to the dependent variable that is most common in
work on ‘creative accounting’, namely stock-flow adjustments (e.g.,?,?; see also? on the technical details).
This term refers to the accounting difference between a country’s change in its debt burden and its budget
deficit, where positive numbers indicate that debts grew more than deficits. ? find that there are more such
adjustments when the deficit fiscal rule of 3 percent is in force in Europe, or after 1997. Our dependent
variable here represents an outside agency’s evaluation of the figures a given member state reports. One issue
on stock-flow adjustments that make them more problematic for our paper is how European accounting rules
consider equity injections into public companies, as well as transactions in financial assets. Both affect debts
but do not affect deficits. Stock-flow adjustments, therefore, would change significantly when governments
intervene in the financial sector–purchases of equity in banks as part of recapitalization or the nationalization
of banks. An advantage of our measure is that we can check whether governments made more favourable
interpretations than Eurostat even during times of high financial stress when governments took action.
Before moving onto the regression analysis let’s examine descriptive statistics of debt revisions over the
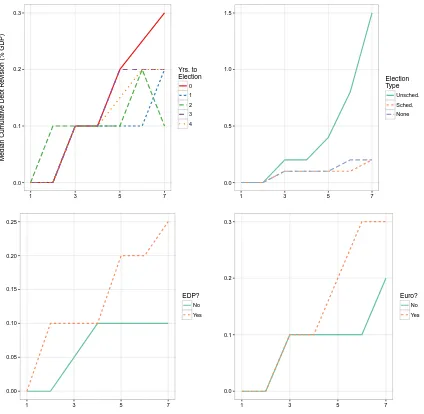
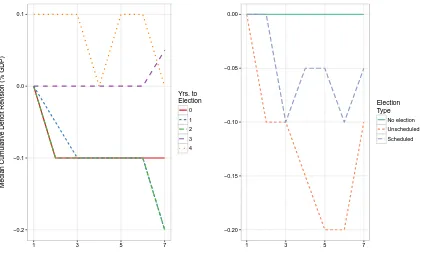
revision period under different conditions related to our non-interactive hypotheses. Figure 1 shows the
median cumulative Eurostat debt revisions in our sample under such conditions.11 The upper left-panel
indicates that revisions are slightly higher for budget data released in years with elections, though the
difference is small. Cumulative revisions are similar regardless of election timing until the fifth revision.
10For completeness, we did the same for deficit revisions. The cumulative deficit revisions variable ranged from -9.8 to 1.3 percent of GDP. Results from models with deficit revisions are in the Online Appendix.
Figure 1: MedianDebtRevisions for Data Released Under Various Domestic and External Audience Con-ditions
0.0 0.1 0.2 0.3
1 3 5 7
Median Cum
ulativ
e Debt Re
vision (% GDP)
Yrs. to Election
0 1 2 3 4
0.0 0.5 1.0 1.5
1 3 5 7
Election Type
Unsched. Sched. None
0.00 0.05 0.10 0.15 0.20 0.25
1 3 5 7
EDP?
No Yes
0.0 0.1 0.2 0.3
1 3 5 7
Euro?
No Yes
Over the next two revisions, the median cumulative revision for non-election years remains between 0.1
and 0.2 percent of GDP. In contrast, median debt revisions for election years increase to 0.3 percent of
GDP by the seventh revision. In the upper right-panel of Figure 1 we see that the median revision for
debt data released in years with unscheduled elections is much higher by the seventh revision (about 1.5
percent of GDP) than for years with scheduled elections or no elections (both are about 0.2 percent of GDP).
Again, the divergence in the magnitude of the data revisions largely begins from the fifth time that Eurostat
examines the numbers. These descriptive findings are indicative of politicians having more favourable debt
rule interpretations than Eurostat in election years with impromptu elections.
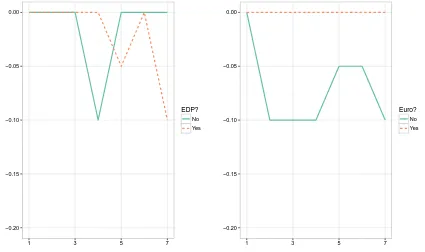
The lower panels of Figure1show median debt revisions for countries in and out of an Excessive Deficit
Procedure and euro membership. The ultimate median debt revision of 0.25 percent of GDP for countries in
EDP enforcement is more than double that for countries without EDP enforcement (lower left-panel). Euro
members have a higher median debt data revision than non-eurozone members (upper right-panel). These
descriptive findings suggest that the external audience may also be an important factor.
4.2
Right-hand variables
To examine the role of election timing on debt revisions, we use Gandrud’s (?) years to election variable.
The variable counts down from the year that is the furthest away from the next scheduled election. Election
years are recorded as zero, regardless of whether they were scheduled or not. To make the substantive
interpretation of the results more intuitive–so that a positive coefficient indicates that being closer to an
election is associated with an increase in debt data revisions–we reversed the direction of the election timing
scale for the regression models.12
We expect that member states should have more favourable assessments than Eurostat when they have
less time to act for a planned election in ways that would present themselves in the best fiscal light to voters,
as well as international institutions. As such, we also include a categorical variable indicatingelection type.
It codes country-years as having a scheduled election, unscheduled election, or no election. The variable is
based on?, which was updated and corrected by? through 2010. We updated it through 2013.13 Based on
our theoretical framework and what we saw in the descriptive statistics, we expect that the revisions will be
greater for years when there is an unscheduled election. See the Online Appendix for the list of country-years
in our sample with unscheduled elections.
12I.e. for each observed election timing valuexfor countryiand yeart: Max(X)−x
i,t.
13We used information from the NSD European Elections Database available athttp://www.nsd.uib.no/european_election_
One way we examined the role of external audiences on revisions was with a binary variable that was
one when a country was in an excessive deficit procedure and zero otherwise. The majority of this data
was from ?, which we updated from 2003 through 2004 and 2013 through 2015.14 Being in an Excessive
Deficit Procedure could have both a positive and/or negative effect on revisions. On the one hand, we may
expect countries in EDPs to make more favourable interpretations in order to lower their debts and get out.
Conversely, an important consideration in how to enforce the EDP is a government’s good faith in returning
to compliance. Data that is determined by Eurostat to be too optimistic may be viewed as a bad faith move.
As such countries subject to SGP enforcement may be less likely to make highly favourable interpretations.
There is a clear interactive possibility that we consider. Perhaps countries that have higher debts and
so are in threat of, or have actually breached the SGP’s limits will be more likely to make highly favourable
interpretations. We would expect that countries in the eurozone specifically would be more likely to do
this when their debts are close to and above the 60 percent of GDP limit. Presenting rosy numbers in this
situation may help them even if only in a marginal way, at least temporarily, stay or get under the SGP’s
60 percent debt to GDP limit. A such, we gathered data ongross central government debt as a percentage
of GDP reported by the World Bank’s Development Indicators.15 We then interacted this variable with
eurozone membership to see if being in the eurozone specifically gave governments added pressure to stay
under the SGP’s 60 percent limit.16 Note that the debt level data is revised data. Therefore, we expect
the effect of this variable on revisions to occur at higher observed levels on the revised data. Governments
should rule stretch more for years with debts somewhat above 60 percent of GDP in data that is ultimately
revised debt data.
To examine how responding to financial market stress may incline governments’ to have more favourable
rule interpretations, we included Gandrud and Hallerberg’s (?) ‘FinStress’ measure. Political economy
research has tended to rely on dichotomous financial crisis measures from ? and ? that are hand-coded
post hoc. Problems with these measures are well known (see ?). FinStress was constructed to overcome
many of these problems by measuring real-time perceptions of financial market stress using a text analysis
14We used information from the European Commission available at: http://ec.europa.eu/economy_finance/economic_
governance/sgp/corrective_arm/index_en.htm. Accessed February 2016.
15Available at: http://data.worldbank.org/data-catalog/world-development-indicators. Accessed December 2015. While the European Union targets are for general government, we intentionally use central government debt in the regres-sions. We assume that these are the figures the central government is most able to influence. They are also highly correlated with the general government figures.
of monthly Economist Intelligence Unit country reports on banking and financial systems. We converted
the monthly variable values into annual averages. In our sample it ranges from 0.19 through 0.76. To ease
interpretation, we multiplied these values by 100. As a robustness check, we alternatively measured stress
with Duprey et al.’s (?) measure of financial market stress. They found their indicator for 27 EU member
states by measuring co-movements in key financial market characteristics such as equity, bond market, and
foreign exchange volatility. Results from the two measures are substantively similar and so we show only
models with FinStress for simplicity.
We hypothesize that the eurozone membership and election effects on debt revisions will increase at
higher levels of financial market stress. So in the following discussion we include interactions between
financial market stress and these variables.
To measure fiscal transparency, we use a fiscal transparency index created by ?. They measure the
degree to which and what type of fiscal data is reported to the International Monetary Fund from 2003 to
2013. Their index ranged from zero to 100 (the maximum possible extent) in our sample of EU member
states. We also examined if economic growth as measured by year-over-year GDP growth (percentage) would
affect revisions.17 Perhaps governments facing broad economic shocks have incentives to more favourably
interpret the rules (?). We used the budgetcontracts institutions (as opposed to institutions that delegate
budget responsibility to a ministry of finance) variable from? and?. We may expect that more contractual
budgetary institutions have more accurate budget numbers the first time around. The variable ranges from
0.19 to 1 in our sample with higher values indicating more contractual institutions.
All EU countries have an independent supranational debt rule monitor–Eurostat. Six member states had
fiscal councils that played the role of additional national independent debt rule monitors during our sampling
period (see the Online Appendix). In some models we included a dummy variable which was one in years
a country had one of these institutions, zero otherwise.18 The variable was never significant and we do not
show results from models including it below. Finally, given the increased attention on government debts
from the start of the eurozone debt crisis in 2010, perhaps Eurostat scrutinized government numbers more
closely and so more revisions were made from 2010. To test this possibility, we included a dummy variable
that was one from 2010 onwards, and zero otherwise. This variable was never statistically significant, so we
do not report results from these models below.
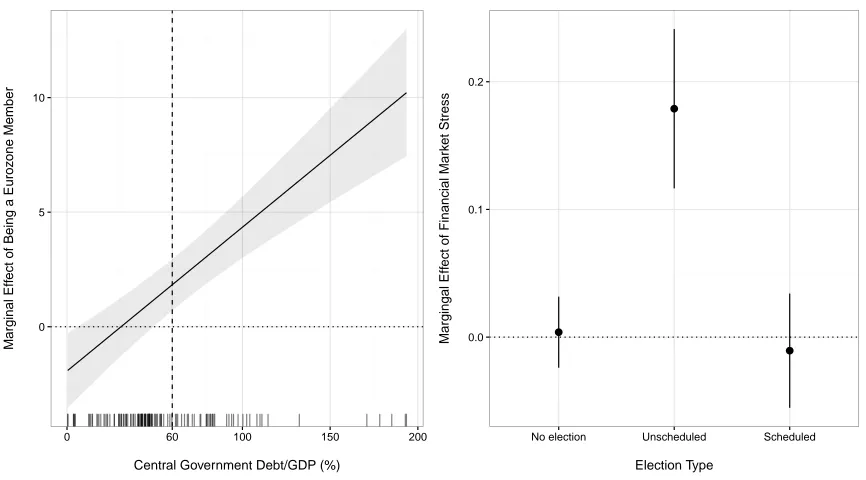
Figure 2: Marginal Effects of Various External and Domestic Audience Conditions on Debt Revisions
0 5 10
0 60 100 150 200
Central Government Debt/GDP (%)
Marginal Eff
ect of Being a Euroz
one Member
●
●
●
0.0 0.1 0.2
No election Unscheduled Scheduled
Election Type
Margingal Eff
ect of Financial Mar
k
et Stress
Shaded areas and solid vertical bars represent 95% confidence intervals.
The dashed vertical line in the left-panel indicates a debt level of 60% of GDP. This is the Stability and Growth Pact debt limit.
5
Empirical tests: results
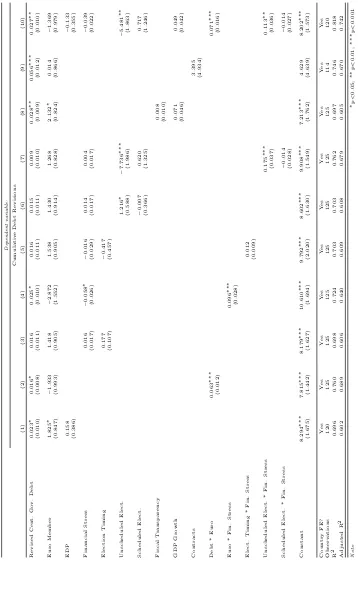
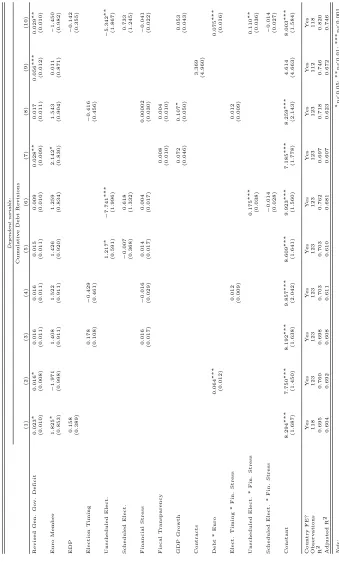
Table1 shows results from linear regressions with cumulative debt revisions as the dependent variable. All
models include country fixed effects to account for unobserved country variation. As a robustness check we
re-ran the key models without fixed effects, but including country clustered robust standard errors. The
results are substantively similar and so not shown. Because a number of the variables are logically highly
correlated with each other, we ran our models in a step-wise fashion.
Central government debt was associated with debt revisions in most models at at least the 10 percent
significance level. The direction of the effect is as expected: countries with higher debt levels were more
likely to have debt data that Eurostat revised upwards. Governments with high debts appear to be more
likely to interpret the accounting rules more favourably than Eurostat. This could be because they have
increased incentives–from voters and EU institutions–to decrease or at least slow the increase in their debts.
Given that we expect a non-linear relationship between debt and debt revisions, i.e. increasing around
the 60 percent of GDP SGP debt limit, we also examined a quadradic polynomial relationship. This results
Online Appendix). Due to the complexity of estimating and interpreting interactions with polynomial terms
and the broad substantive similarity between the linear and polynomial versions of the variable, below we
focus on interactions estimated with a linear debt term.
We expect that eurozone members with debt levels around or above the 60 percent of GDP SGP debt
limit would be more likely to have more favourable views of their budget than Eurostat ultimately has. The
left-panel of Figure2shows the marginal effect of eurozone membership at various debt levels. We can see
that the effect is positive–eurozone members with higher debt levels are more likely to have revised debt
numbers. Interestingly, this effect becomes statistically significant at the 5 percent level when debt is about
at the 60 percent SGP limit in the revised data.19
We did not find evidence that once countries are in an Excessive Deficit Procedure that they are
uncon-ditionally more likely to present debt figures that Eurostat revises upwards. This is possibly because of the
ambiguous benefit of making more favourable rule interpretations when under the EDP. Countries might be
able to get their debts under the SGP limit with such optimistic accounting, but once revealed, these actions
could be seen as bad faith efforts leading to further penalties.
Contrary to our expectations based on previous research, we did not find evidence of an election timing
effect on revisions. There is, however, evidence that having an unscheduled election has the hypothesized
non-interactive effect on debt revisions. We estimate that having an unscheduled election, but not a scheduled
election, is associated with larger cumulative Eurostat debt data revisions. The election type finding may
go some way to explaining why we found no election timing effect. If this optimistic budgeting is confined
to a subset of elections–those where governments have the least ability to affect real economic outcomes and
therefore have to rely on more marginal tactics such as favourable budgeting–we would be less likely to see
an overall election timing effect.
Using an interaction between euro membership and election timing (not shown) we examined if election
timing may have an effect mediated by being in the eurozone. These countries cannot use monetary policy
to boost the economy before elections. The interaction was not statistically significant at any standard level.
How does financial market stress impact debt revisions? We hypothesised that revisions should be larger
when there is more stress and the effect of unscheduled elections and eurozone membership should be stronger
at higher levels of stress. We did not find strong evidence of an unconditional relationship between financial
market stress and debt revisions, but did find consistent evidence for a relationship conditional on election
type and eurozone membership. In the right-panel of Figure 2 we see that the marginal effect of financial
market stress is positive on revisions when there is an unscheduled election.20 Similarly, more stress in
eurozone countries is associated with larger revisions.
Fiscal transparency and GDP growth were not associated with debt revisions in our models. We also did
not find evidence that ‘contract’ institutions impacted debt revisions.
Because Greece is a considerable outlier in terms of its debt revisions, we also ran our models with Greece
omitted from the sample. The results of these models are shown in the Online Appendix. Removing Greece
did not change the substantive significance of the findings, suggesting that the behavior we have identified
20Perhaps governments that face higher levels of financial market stress are more likely to call unscheduled elections. In the Online Appendix we investigate this possible endogeneity. We do not find evidence that unscheduled elections are more likely at higher levels of financial market stress.
is not confined to Greece, but is instead a wider phenomenon in the European Union.
6
Conclusion
We have sought to understand how governments interpret budget accounting rules compared to an external
third party with different incentives, especially during periods of financial market stress and crisis. The
European Union provides a unique opportunity for studying this behavior as it has a common set of statistical
rules–the ESA–and has a highly independent monitor–Eurostat–that regularly revisits and revises member
state balance sheet statistics to ensure that they are in line with these rules.
We significantly deepen findings in previous work that elections are associated with revisions to
gov-ernment finance figures. We did not find an unconditional effect between election timing and revisions, as
suggested by previous work, but did find that unscheduled elections, especially during periods of financial
market stress are associated with debt revisions. These are periods when budgets are under significant stress
and governments have few opportunities to affect economic fundamentals in time for voters to appreciate
it. We also explore how the European-level audience affects the interactions between member states and
Eurostat. We found that policy-makers in the eurozone are cognizant of the Stability and Growth Pact’s
60 percent of GDP debt limit and possibly use more favourable interpretations of the accounting rules in
attempts to be below it.
Future research could consider other ways in which politicians can improve the outward appearance of
their debt statistics in crucial periods, such as unscheduled elections or during financial crises. They may,
for example, be more likely to choose policies that create contingent liabilities that do not directly impact
the debt in unscheduled election years or during crises. Future work could examine how the relative share of
these sorts of policies change under certain conditions, possibly heading off some of the need to use optimistic
fiscal rule interpretations to improve budget figures in the short term.
A major takeaway from our work is that even among a group of developed economies with generally
strong economic policy institutions, it is common for political incentives to significantly affect our
knowl-edge about government spending and financial obligations. This is especially true during financial market
stress. European-level debt limits and the enforcement of these limits also appears to encourage more
opti-mistic budget interpretations in certain circumstances. As such, highly independent government accounting
agencies, such as Eurostat, are a crucial component of ‘getting the numbers right’, even if it takes a few
Online Appendix
Additional explanations of favourable fiscal rule interpretations
There are two alternative explanations that could be relevant here. Governments subject to higher fiscal
policy transparency could have less ability to make interpretations that are more favourable to them than
what Eurostat would decide (e.g. ?). There are reasons to be skeptical of this reasoning in this context.
The interpretations are of highly technical rules and possibly probabilistic outcomes that voters and even
sophisticated market actors likely do not know. This suggests that greater fiscal transparency either has
no effect on the behaviour we are interested in or it may even have a positive effect as politicians in more
transparent contexts use stealthier methods of improving the appearance of their budget in the short-term.
Regardless, this is an empirical question we address below.
A second alternative explanation to explore is an institutional one. ? find that European Union member
states that fit most closely a ‘fiscal contracts’ approach to budgeting have more conservative forecasts in their
Stability and Convergence Programmes than member states that delegated to a ‘strong finance minister’. ?
similarly find that ‘contract’ states have more prudent fiscal forecasts using a different data set, namely the
forecasts found under the Excessive Deficit Procedure. ? focus on actual forecasting errors. While countries
with fiscal contracts are less likely to miss their targets, it could be that such states are more active in making
sure they hit those targets through a more generous interpretation of the rules. If it turns out later that the
government missed the target, this is unlikely to bring down the government. At the same time, this logic
ignores the institutional structures that support such contracts. Precisely because there is a temptation to do
this one might have especially competent staff do the numbers. The Dutch largely outsource the production
of the figures to its fiscal council, the Netherlands Bureau of Economic Analysis, which, while technically
part of the executive, has established a reputation since the end of World War II as an independent body.
What may ultimately matter most, then, is the relative independence of the body that reports the data.
As we note above, there are few fiscal independent fiscal councils as of 2013, but we do not have data on
statistical agencies. Delegation to a strong finance minister may suggest that the finance ministry does the
numbers. This, too, can be checked, as happened in the United Kingdom, when frustration with habitually
optimistic figures led to pressure for an objective body, which was the inspiration for the Office of Budget
Responsibility created in 2010. Here, we consider the difference between ‘delegation’ and ‘fiscal contract’
countries a good proxy for these type of institutional distinctions. Supporting this argument is?, who find
to the ideal under ‘fiscal contracts’.
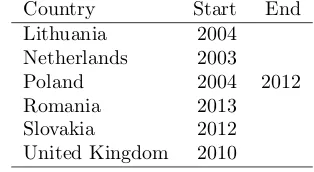
[image:23.612.225.382.162.248.2]Independent national debt rule monitors
Table A-1: Start and End Years (if any) of Independent National Debt Rule Monitors, from? Country Start End
Lithuania 2004 Netherlands 2003
Poland 2004 2012
Romania 2013
Slovakia 2012 United Kingdom 2010
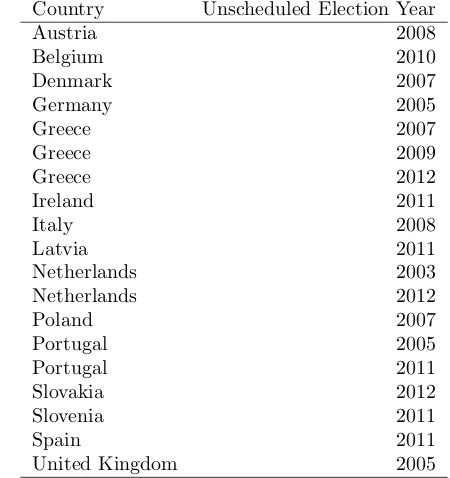
Crisis and the possibility of selection into unscheduled elections
We examined whether or not governments select into unscheduled elections according to the prevailing level
of financial market stress. TableA-2shows the list of country-years with unscheduled elections in our sample.
TableA-3shows results from a logistic regression where we tried to predict having an unscheduled election
in a year for our sample based on annual average stress level. We can see that there is a null result. We made
a similar finding when running a similar model with lagged financial market stress, a rare logistic regression,
and a multinomial logistic regression (not shown), with unscheduled and scheduled elections as categories
and no election as the reference category.
Estimated non-linear relationship between debt and debt revisions
Omitting Greece
Greece has very large debt revisions in our sample. For each year from 2007 through 2011 Greece’s debt
statistics were cumulatively revised upward by over 10 percentage points. To examine if this one country
was driving our election results, we reran our models omitting Greece. The results of this exercise are shown
in TableA-4. We can see that the substantive findings from reported from models in the full sample in Table
Figure A-1: Simulated Effect of Central Government Debt on Eurostat Debt Revisions Using a Quadradic Polynomial
5 10 15
0 50 100 150 200
Central Government Debt (% of GDP)
Expected Re
visions (% of GDP)
Estimated from a model that include a quadradic polynomial, eurozone membership, financial market stress, and country fixed effects.
The shaded area represents the central 95 percent interval of 1,000 simulations per integer value of the x-axis drawn from the multivariate
Table A-2: Country-years With Unscheduled Elections in Our Sample Country Unscheduled Election Year
Austria 2008
Belgium 2010
Denmark 2007
Germany 2005
Greece 2007
Greece 2009
Greece 2012
Ireland 2011
Italy 2008
Latvia 2011
Netherlands 2003
Netherlands 2012
Poland 2007
Portugal 2005
Portugal 2011
Slovakia 2012
Slovenia 2011
Spain 2011
United Kingdom 2005
Table A-3: Logistic Regression Estimation of Having an Unscheduled Election
Dependent variable:
Unscheduled Election
Financial Stress 0.985 (2.395)
Constant −2.595
(1.647)
Country FE? Yes
Observations 245
Log Likelihood −47.124 Akaike Inf. Crit. 152.248
[image:25.612.195.418.475.641.2]Deficit Revisions
In addition to debt revisions explored in the main text, we also explored deficit revisions in a similar manner.
First we examine deficit revisions descriptively. FigureA-2(similar to construction to Figure1 in the main
text) shows the cumulative Eurostat deficit revisions in our sample under different electoral conditions. The
electoral pattern is somewhat less clear for deficit revisions than debt revisions discussed in the main paper
though the effect is in the same theoretical direction as we found in the debt revisions. In the left-panel
of FigureA-2 years far away from a scheduled election–i.e. three and four years from the election–deficits
are generally either not revised or slightly revised upwards such that the government ran a slight surplus
relative to the original data. Conversely, data for years closer to an election are revised somewhat downward.
In other words, governments spent more relative to their income than they had originally reported. The
right-panel of Figure A-2 indicates that both scheduled and unscheduled election years see larger median
downward deficit revisions. There appears to be a small cumulative difference between these two types of
elections with unscheduled elections having somewhat larger downward revisions by the seventh revision.
We see a broadly similar story in the left-panel of Figure A-3 for countries in an EDP as with the debt
data. By the end of the revision period, on average downward deficit revisions are higher for countries in an
EDP. Interestingly, non-eurozone members had larger deficit revisions than eurozone members. This is the
opposite direction of what we found in the debt revisions data.
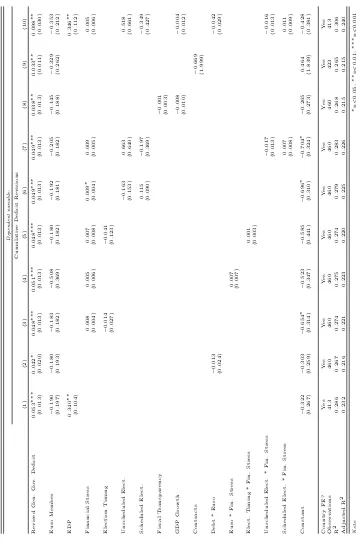
We then ran similar models as those found in Table1with cumulative deficit revisions as the dependent
variable. A difference is that we use deficits rather than debts on the right-hand side. Also, rather than
interacting euro membership with debts, in these models we made the more relevant interaction: deficit levels
interacted with euro membership. These results are shown in TableA-5. Having larger deficits is associated
with larger deficit revisions, likely as governments use fiscal rule stretching to contain their reported deficits.
Figure A-2: MedianDeficitRevisions for Data Released Under Various Electoral Conditions
−0.2 −0.1 0.0 0.1
1 3 5 7
Median Cum
ulativ
e Deficit Re
vision (% GDP) Yrs. toElection
0 1 2 3 4
−0.20 −0.15 −0.10 −0.05 0.00
1 3 5 7
Election Type
No election Unscheduled Scheduled
Figure A-3: MedianDeficitRevisions for Data Released Under Various EDP and eurozone conditions
−0.20 −0.15 −0.10 −0.05 0.00
1 3 5 7
EDP?
No Yes
−0.20 −0.15 −0.10 −0.05 0.00
1 3 5 7
Euro?
No Yes