City, University of London Institutional Repository
Citation
:
Ctori, I. ORCID: 0000-0003-1523-4996, Mahroo, O. A., Williams, K. M.,
Hammond, C. J. and Huntjens, B. ORCID: 0000-0002-4864-0723 (2018). Repeatability of
the macular pigment spatial profile: A comparison of objective versus subjective
classification. Acta Ophthalmologica, 96(7), e797-e803. doi: 10.1111/aos.13725
This is the published version of the paper.
This version of the publication may differ from the final published
version.
Permanent repository link:
http://openaccess.city.ac.uk/20344/
Link to published version
:
http://dx.doi.org/10.1111/aos.13725
Copyright and reuse:
City Research Online aims to make research
outputs of City, University of London available to a wider audience.
Copyright and Moral Rights remain with the author(s) and/or copyright
holders. URLs from City Research Online may be freely distributed and
linked to.
City Research Online:
http://openaccess.city.ac.uk/
[email protected]
Repeatability of the macular pigment spatial
profile: A comparison of objective versus subjective
classification
Irene Ctori,
1Omar A. Mahroo,
2,3,4,5Katie M. Williams,
2,3Christopher J. Hammond
2,3and
Byki Huntjens
11
Applied Vision Research Centre, City, University of London, Northampton Square, London, UK 2
Department of Twin Research and Genetic Epidemiology, King’s College London, St Thomas’ Hospital Campus, London, UK 3
Department of Ophthalmology, King’s College London, St Thomas’ Hospital Campus, London, UK 4
Retinal Service, Moorfields Eye Hospital, London, UK 5
UCL Institute of Ophthalmology, London, UK
ABSTRACT.
Purpose: Classification of macular pigment (MP) spatial profile phenotypes varies and is often based on subjective visualisation. We investigated repeata-bility of MP optical density (MPOD) comparing an objective versus subjective profiling system.
Methods: The coefficient of repeatability (CoR) was calculated for point MPOD values (0–3.8°) obtained by dual-wavelength fundus autofluorescence (FAF) from two scans obtained in a single visit of 40 healthy individuals (399 years). For each individual’s dataset, the MP profile was classified as exponential, ring-like or central dip using an objective method (based on deviations away from an exponential fit), as well as by subjective visual profiling. Existing FAF images of 88 monozygotic (MZ) and 69 dizygotic (DZ) twin pairs were reanalysed using the objective profiling method and concordance and heritability of ring-like profiles determined.
Results: The CoR was 0.23 at 0° and 0.06 at 0.8°. Agreement of objective profiling between scans was excellent (j = 0.85, 95% CI 0.69 to 1.00; p < 0.0005). Subjective profiling showed moderate agreement between scans (j = 0.48, 95% CI 0.23 to 0.73; p< 0.0005). Agreement between objective and subjective classification was low (j = 0.23, 95% CI 0.04 to 0.42; p= 0.02). Concordance for the ring-like profile using objective profiling was 0.74 for MZ compared to 0.36 for DZ twins. Heritability was calculated as 81.5% (95% confidence interval 61.1–93.1%).
Conclusion: Compared to visual assessment, objective MP profiling is a more reliable method and should be considered in future observational and interventional studies. In addition, MP profile phenotypes showed high heritability.
Key words:fundus autofluorescence – heritability – macular pigment optical density – repeata-bility – spatial profile
Acta Ophthalmol. 2018: 96: e797–e803
ª2018 The Authors. Acta Ophthalmologica published by John Wiley & Sons Ltd on behalf of Acta Ophthalmologica Scandinavica Foundation.
This is an open access article under the terms of the Creative Commons Attribution License, which permits use, distribution and reproduction in any medium, provided the original work is properly cited.
doi: 10.1111/aos.13725
Introduction
been shown that the overall amount of MP present varies according to its density distribution pattern (Tri-eschmann et al. 2003).
The spatial profile phenotype of MP across the retina may play a role in the protection of the eye against age-related macular degeneration (AMD) (Tri-eschmann et al. 2003). In particular, the presence of an annulus of increased MPOD was reported to be three times less common in eyes with the presence of AMD compared to healthy eyes (Dietzel et al. 2011). Although the different tech-niques for measuring MPOD may cause inconsistencies when comparing data between studies (Delori et al. 2001; Canovas et al. 2010), the presence of a ring-like structure or a secondary peak within the MP spatial profile has been demonstrated by HFP (Hammond et al. 1997; Kirby et al. 2009, 2010) and also by imaging using two-wavelength FAF (Berendschot & van Norren 2006; Delori et al. 2006; Dietzel et al. 2011; Tariq et al. 2014). However, the classi-fication of spatial profile phenotypes varies across the literature and there is currently no universal consensus on a single classification system. Various techniques have been described includ-ing objective analysis of secondary max-ima–minima pairs (Delori et al. 2006) and mathematical analysis of a combi-nation of an exponential and Gaussian fit to the data distribution (Berendschot & van Norren 2006). Quantification analysis of MP derived from FAF images has been used to characterize different MP spatial profile phenotypes (Trieschmann et al. 2003), as has sub-jective visual assessment of two-wave-length FAF scan images (Tariq et al. 2014). As well as inconsistencies with nomenclature, classification of a ring-like spatial profile may be affected by measurement error, noise in the data or a product of an artefact of the MPOD measurement method (Delori 2004). While it has been shown that repeata-bility of point MPOD measurements is dependent on the instrument employed (Snodderly et al. 2004; Tang et al. 2004; de Kinkelder et al. 2010), test–retest repeatability of MPOD measurements is often carried out only at a single 0.5° location for HFP methods (Snodderly et al. 2004; Tang et al. 2004; Bartlett et al. 2010; de Kinkelder et al. 2010; Iannaccone et al. 2016) or at 0.5°and 2° eccentricity using two-wavelength FAF (Trieschmann et al. 2006). If MP spatial
profile classification is based on devia-tions from an exponential fit to the data (Berendschot & van Norren 2006; Nolan et al. 2008; Huntjens et al. 2014; Ctori & Huntjens 2017) or an increase relative to central MPOD (Nolan et al. 2012), it is important to consider the reliability of the MPOD measurement not only according to the instrument used but also the repeatabil-ity of the MPOD measurement at each of the different retinal eccentricities tested.
The aim of this study was to inves-tigate the repeatability of individual point MPOD measurements (between 0° and 4° retinal eccentricities) using two-wavelength FAF imaging. In addi-tion, we investigated the agreement of spatial profile phenotype obtained between scans using an objective clas-sification method as well as a visual classification method. The intervisit agreement of the objective classifica-tion method has not previously been described. We also determined the heritability of spatial profiles as estab-lished by objective profiling and com-pared this with the previously obtained estimate using subjective profile assess-ment. Finally, we tested the hypothesis that a single central MPOD measure is a poor predictor of the amount of MP present.
Patients and Methods
Two-wavelength FAF imaging for heritability study
Two-wavelength FAF imaging was carried out as part of a twin heritability study described in detail elsewhere (Hammond et al. 2012) that included 314 healthy Caucasian female twin volunteers (aged 16–50 years) recruited from the TwinsUK registry at St Thomas’ Hospital (London, UK) (Liew et al. 2005). All participants had healthy retinas and clear crys-talline lenses. In brief, following mydri-asis, two-wavelength FAF imaging was performed on both eyes of each partic-ipant using a modified confocal scan-ning laser ophthalmoscope (Heidelberg Engineering, Heidelberg, Germany) providing high-resolution images at 488 and 514 nm wavelengths. The intensity of a greyscale map, generated by digital subtraction of the images obtained at the two wavelengths, was proportional to the MPOD at each
retinal location. The instrument’s soft-ware generates a plot of MPOD against eccentricity by averaging MPOD mea-surements at each retinal location in concentric rings according to the dis-tance from the foveal centre (Wuste-meyer et al. 2003). The right eye of each twin was included in the analysis.
Repeatability study
Approval to reanalyse the previously acquired two-wavelength FAF images (Hammond et al. 2012) was obtained from the TwinsUK Resource Executive Committee of St Thomas’ Hospital, London. Data analysis for this study took place at the Department of Twin Research and Genetic Epidemiology, Kings College London, St Thomas’ Hospital Campus, London. Subjects that had two scans on the same eye taken within a single visit were eligible for inclusion into the repeatability study.
Analysis of FAF images
The MPOD profile for each subject was generated using the automated ‘find fovea’ function available within the instrument’s software. This was performed as an attempt to have a consistent approach to locating the fovea (Sasamoto et al. 2010) rather than manually placing the cursor at the perceived centre of the fovea. Point MPOD values at 0°, 0.1°, 0.8°, 1.8°, 2.8° and 3.8°were extracted from the instrument’s software for each scan. Eccentricity values were selected on the basis of a previous investigation by our research group (Huntjens et al. 2014; Ctori & Huntjens 2017) in which MPOD was measured by HFP at predefined eccentricities at 0°, 0.8°, 1.8°, 2.8° and 3.8° (with the average of MPOD at 6.8°and 7.8°used as the reference value).
Classification of MP spatial profile phenotypes
exponential function to float, rather than assuming a fixed negligible value at the peripheral reference location (Putnam & Bassi 2015; Ctori & Hunt-jens 2017). An exponential profile was assigned if the measured MPOD value at 0°, 0.8° and 1.8° was within one coefficient of repeatability (CoR) (i.e. the average within-subject SD) of the value predicted by the fitted exponential curve (Table 2). Profiles with MPOD values deviating greater than one CoR above the exponential fit at 0.8° were assigned a ring-like classification (Ham-mond et al. 1997). It has been shown that ring-like structures occur at approximately 0.7–0.8° eccentricity from the fovea as determined by HFP (Hammond et al. 1997; Kirby et al. 2009; Huntjens et al. 2014) or FAF methods (Hammond et al. 1997; Delori et al. 2006). A deviation more than one CoR below the expected value at 0°was classified as a central dip (Huntjens et al. 2014; Ctori & Huntjens 2017). For subjective classification, experi-enced investigator (OM) visually inspected both FAF images of each participant for the presence of a ring-like pattern or central dip as described elsewhere (Tariq et al. 2014). Each FAF image was inspected in a random order, blind to the results of the first scan and blind to the objective classification.
Intervisit agreement of MP spatial profile phenotypes
Agreement of MP spatial profile phe-notype between scans obtained in a single visit using objective classification (Huntjens et al. 2014) versus a subjec-tive visual classification method (Diet-zel et al. 2011; Tariq et al. 2014) was determined.
Heritability study
Concordance of the ring-like profile for monozygotic (MZ) and dizygotic (DZ) twin pairs was determined from previ-ously obtained two-wavelength FAF data for 157 twin pairs (Hammond et al. 2012). The heritability of spatial profiles as established by objective profiling was quantified and compared with the previously obtained estimate using subjective profile assessment.
Calculation of integrated MPOD
It has been shown that an exponential function describes the MP spatial profile well (Hammond et al. 1997). A measure
of the integrated MPOD (MPODint) based on the area under the MPOD distribution curve was calculated by integrating the area under the best fit curve. This was calculated for each participant’s MPOD data set using the MPOD values at 0°, 0.8°, 1.8°, 2.8°and 3.8°. The trapezium rule was used in a two-dimensional coordinate system to calculate the area under the curve from 0°to 3.8°(i.e. MPODint), based on the same approach detailed by Kirby et al. (2010). We tested the hypothesis that a single central MPOD measure is a poor predictor of the overall amount of MP present, with MPODint used as a proxy.
Statistical analysis
All statistical analyses were performed using SPSS version 22.0 for Windows
(SPSS Inc., Chicago, USA). Values in
the text and tables are presented as meanstandard deviation (SD). MPOD measurements are in log units. The CoR was calculated as CoR= 1.96s, where s is the SD of the difference between pairs of MPOD measurements between visits one and two (Bland & Altman 1986). Limits of agreement (LoA) were determined as the mean difference between pairs of MPOD measurementsCoR. The LoA indicate the range within which 95% of the differences between mea-surements will lie (Bland & Altman 1986, 1999; McAlinden et al. 2011). Agreement of classification of the MP spatial profile was evaluated by the overall percentage of agreement between visits or scans and by the Kappa measure of agreement,j (Lan-dis & Koch 1977; Sim & Wright 2005). Case-wise concordance for the presence of a ring-like or central dip profile was calculated separately for MZ and DZ twins as 2C/(2C+ D), whereC is the number of twin pairs concordant and D the number discordant (Tariq et al. 2014). Heritability calculation for pig-ment profiles was performed as described previously (Tariq et al. 2014) with maximum likelihood struc-tural equation twin modelling, using the OpenMx package (http://openmx. psyc.virginia.edu) in R (http://www.r-project.org).
Results
The demographics of the participants included in the repeatability and
heritability studies are presented in Table 1.
Repeatability study
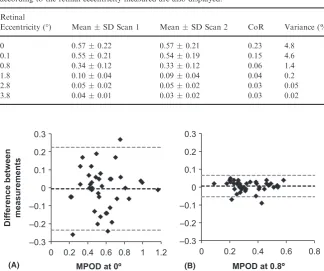
Mean MPOD at 0°was 0.57 0.22 for the first scan and 0.570.21 for the second (t(39)= 0.18, p=0.86), with a CoR of 0.23 calculated. At 0.1°, the CoR was 0.15 and reduced to ≤0.06 from 0.8° and beyond (Table 2). Bland–Altman plots for the 0° and 0.8°locations are shown in Fig. 1.
Repeatability of spatial profiling
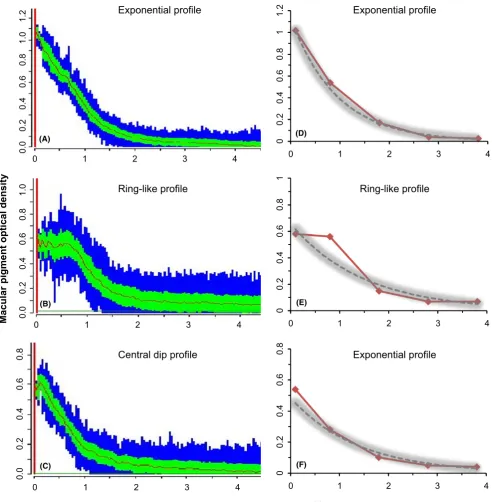
Examples of spatial profiles are shown in Fig. 2. FAF images were visually classified as an exponential (A), ring-like (B) or central dip (C) profile. The data were extrapolated to complete objective classification as described in the methods (Fig. 2D-F). According to the objective profile classification, (D) shows an exponential profile; (E) shows a ring-like profile (whereby MPOD at 0.8 is more than 1 CoR above the exponential fit line) and (F) shows that while image (C) was visually classified as a central dip, central MPOD is not more than 1 CoR below the exponen-tial fit line and is therefore objectively classified as an exponential profile.
The frequency distribution of the three different spatial profile types is presented in Table 3. Overall percent-age of agreement of objective classifi-cation of the MP spatial profile between each pair of FAF scans was 93% with a j-value of 0.85 (95% confidence interval 0.69–1.00, p<0.0005). Subjective visual classifi-cation of the MP spatial profile between FAF scans resulted in 73% overall percentage of agreement, and a j-value of 0.48 (95% confidence inter-val 0.23–0.73, p<0.0005). The agree-ment between the objective and subjective classification for all 80 FAF scans resulted in overall percentage agreement of 60%, with a j-value of 0.23 (95% confidence interval 0.04 to 0.42, p= 0.02).
Heritability study
methods was calculated as 0.74 for MZ and 0.36 for DZ twins. Formal calcu-lation of heritability of the ring-like macular pigment profile as established by the objective methods yielded an estimate of 81.5% of the variance being attributable to additive genetic factors (95% confidence interval 61.1– 93.1%).
According to visual subjective pro-filing, 64% presented with an exponen-tial profile while 27% had ring-like and 9% central dip profiles. Case-wise concordance for subjective profile clas-sification resulted in 0.80 for MZ and 0.41 for DZ twins.
Correlation between single point MPOD and integrated MPOD
The correlation between single point measures of MPOD with MPODint (0–
3.8) was calculated to test how well a single measure of MPOD describes the overall amount of MP present (Table 4).
Discussion
Repeatability study
The results of the present investigation demonstrate a large variation in the CoR for central MPOD measurements quantified from FAF scans (Table 2). Feasibility of MP quantification using a grey scale analysis of FAF images obtained from two different instru-ments (HRA2 and S3300 Spectralis HRA-OCT; Heidelberg Engineering, Heidelberg, Germany) was evaluated in an investigation including 34 normal subjects (Delori et al. 2011). Several
technical modifications were suggested to reduce measurement errors, includ-ing implementinclud-ing new alignment soft-ware as well as correction of the data to compensate for the absorption of the ocular media. Although such a correc-tion algorithm was not applied to the absolute measure of MPOD in the current study, the prevalence of signif-icant lens opacity in the study cohort would be expected to be low given the average age of the participants. In addition, the incident radiation would be absorbed similarly between 0° and 3.8° eccentricity and is therefore unli-kely to be a significant factor in com-putations of relative MPOD. We propose that the poor CoR at 0° is most likely to be due to the algorithm used by the inbuilt ‘find fovea’ soft-ware, possibly because the fovea is defined according to a single pixel and therefore more likely influenced by noise. Nevertheless, there was a good within-session repeatability of around 0.05 optical density units from 0.1°and beyond, consistent with previous inves-tigations (Trieschmann et al. 2006; Delori et al. 2011). These findings indicate that measurement error has little influence on MPOD measure-ments quantified from the two-wave-length FAF imaging technique employed in the current study at eccen-tricities beyond 0°. That being said, we propose that several (more than 2) measurements of MPOD may be needed to ensure robust values (Lough-man 2010).
Repeatability of spatial profiling
Our results show that the methods employed for measurement and classi-fication of the MP spatial profile are robust to test–retest variability. This is in accordance with a previous study based on sixteen individuals in which the profile type was shown to persist on repeated testing (Kirby et al. 2009). The objective method of classification of the MP spatial profile used in the current investigation is based on devi-ations away from an exponential fit to the data distribution taking into account the measurement error of the instrument according to the location at which MPOD is being measured (Hun-tjens et al. 2014). The intervisit agree-ment of this classification method has not previously been described. There was excellent repeatability (93%; j= 0.85, p<0.0005) of profiling by
Table 2. Mean MPODSD for the repeatability study (n=40). Repeatability measures according to the retinal eccentricity measured are also displayed.
Retinal
Eccentricity (°) MeanSD Scan 1 MeanSD Scan 2 CoR Variance (%)
0 0.570.22 0.570.21 0.23 4.8
0.1 0.550.21 0.540.19 0.15 4.6
0.8 0.340.12 0.330.12 0.06 1.4
1.8 0.100.04 0.090.04 0.04 0.2
2.8 0.050.02 0.050.02 0.03 0.05
3.8 0.040.01 0.030.02 0.03 0.02
–0.3 –0.2 –0.1 0 0.1 0.2 0.3
0 0.2 0.4 0.6 0.8 1 1.2
Difference between
measurements
(A)
–0.3 –0.2 –0.1 0 0.1 0.2 0.3
0 0.2 0.4 0.6 0.8
[image:5.595.47.380.100.156.2](B)
[image:5.595.47.372.196.467.2]Fig. 1.Bland–Altman plots to show repeatability of MPOD measurements. Plots show the difference in MPOD measurements between scans (A) at 0°and (B) at 0.8°. Black dashed line represents the mean of the two measurements. Grey dashed lines indicate the upper and lower limits of agreement indicating the range within which 95% of the differences between measurements are expected to lie.
Table 1. Demographics of the participants included in the repeatability and heritability studies. Number of
participants
Number of eyes
Age (meanSD,
years) Gender Ethnicity
Repeatability study 40 40 398.6 Female Caucasian
objective analysis; whereas repeatabil-ity of profiling by subjective visual analysis between scans was lower (73%;j=0.48; p< 0.0005). This find-ing implies that the objective method is a more reliable method of MP spatial profiling. Notably, in the original twin study (Tariq et al. 2014), the kappa measure of agreement between two graders of ‘ring versus no-ring’ was
reported as 0.705 (p-value not given), illustrating that although this is a fast method, variability could arise with subjective profiling classification. Fur-thermore, our results indicate poor agreement between the objective and subjective classification method applied to the same FAF scan image (60%; j=0.23, p =0.02), illustrating how the same data can give rise to different
phenotype classifications depending on the classification system that is applied. Indeed, while only three profiles were identified as central dips by visual inspection in the present study (Fig. 2C), objectively, these deviations were smaller than the CoR and there-fore classified objectively as exponen-tial (Fig. 2F). This, in turn, highlights the difficulties in comparing studies
0 0.2
0.4
0.6
0.8 1 1.2
0 1 2 3 4 0 1 2 3 4
0 1 2 3 4
0 1 2 3 4
0
0.2 0.4 0.6 0.8
1
0 1 2 3 4
0
0.2 0.4 0.6 0.8
0.0 0.2 0.4 0.6 0.8 1.0 1.2
0.0 0.2 0.4 0.6 0.8 1.0
0.0 0.2 0.4 0.6 0.8
0 1 2 3 4
Central dip profile Exponential profile Exponential profile Exponential profile
Ring-like profile Ring-like profile
Macular pigment optical density
(A) (D)
(B)
(C)
(E)
[image:6.595.49.542.85.588.2](F)
that have employed different classifica-tion techniques.
Heritability study
Although it is possible to extract MPOD values from FAF scans corresponding to several retinal eccen-tricities between 0°and 0.8°, this is a time-consuming task when performed manually. Nonetheless, among the 314 twin participants, prevalence of the ring-like profile (29%) determined objectively compares well with the 26% reported in the original study (Tariq et al. 2014). This suggests that ring-like MP structures can be identi-fied by objective classification based on the limited eccentricities used in our analysis. In the present investigation, a consistent method to identify the cen-tral MPOD measurement utilizing the ‘find fovea’ function of the Heidelberg software was incorporated, whereas the original study (Tariq et al. 2014) had identified the centre of the scan as the location where MPOD was maxi-mal. Despite this variation in method-ology, case-wise concordance of nonexponential MP profiles was 0.74 for MZ twins; approximately double that for DZ twins based on our objec-tive MP profiling. This is in accordance with the original study in which it was shown that there was greater concor-dance of a ring-like profile in MZ compared to DZ twins (Tariq et al. 2014). Similarly, in the present study,
the objective profiling method yielded a similar high estimate of heritability, 81.5% (95% CI, 61.1–93.1%), com-pared to heritability for the ring-like profile determined by subjective visual assessment of 84.0% (95% CI, 63.7– 96.4%) (Tariq et al. 2014) confirming that genetic factors appear to be important in determining spatial pig-ment profiles.
Correlation between single point MPOD and integrated MPOD
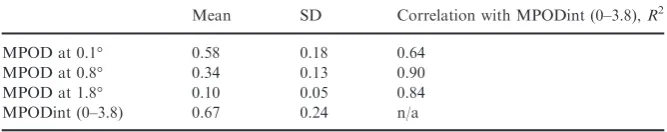
We calculated the MPODint (0–3.8) and used this value as a proxy for the overall amount of MP. It should be noted that the central 3.8° is likely to underestimate the total complement of MP, as a substantial component is located beyond this eccentricity (low MPOD but a large area in comparison with the central macula) (Degli Esposti et al. 2012). Nonetheless, although there was a strong correlation between the central MPOD measurement and MPODint, this relationship was signif-icantly stronger for single MPOD mea-surements at 0.8° (Table 4). The advantage of an integrated measure is that it allows comparisons to be drawn between individuals regardless of the MP spatial distribution phenotype. We propose that an integrated measure is a better indicator of the amount of MP present as opposed to a single central MPOD measurement and may be a more appropriate parameter to report in future studies.
Limitations
Using the automated ‘find fovea’ fea-ture may lead to an inaccurate deter-mination of 0° eccentricity. An investigation on the difference between finding the fovea manually versus automatically would be of benefit. It is worth noting that the FAF scans generated in this investigation were not available to view in 3D. Further investigation of classification based on 3D profiles would be of interest. According to the objective classifica-tion method, none of the 314 twins showed a central dip. A limitation of the present study is the definition of the different spatial profiles. Until an agreed system has been established, the varying peak widths, including broad-shaped MP without a central peak and ring-shaped patterns, could be considered instead (Elsner et al. 1998; Sharifzadeh et al. 2006, 2008). While our study focused on the dis-tribution of macular pigment in a healthy cohort, MP profiles of unhealthy eyes (for example in AMD or in macular telangiectasia type 2) should be considered in future studies.
Conclusion
[image:7.595.46.380.111.215.2]The repeatability of single MPOD measurements varies according to reti-nal eccentricity. Based on the two-wavelength FAF technique, MPOD fluctuations greater than 0.23 at 0°, 0.12 at 0.1° and 0.06 at 0.8° can be considered as clinically significant per-turbations in the data as opposed to instrument noise. Therefore, taking several measurements of MPOD may be needed to ensure robust values. Our findings demonstrate that apply-ing an objective classification system provides a reliable method of MP spatial profiling that is robust to test–retest variability. Although cur-rently there are limitations in obtain-ing this output manually from FAF scans, automated quantification of MP spatial profiles may serve in future as a powerful objective parameter of macular structure, which may be a useful biomarker in epidemiological studies and also in understanding what factors may confer protection or vulnerability to macular diseases. In addition, we confirmed that genetic factors appear to be important in determining MP profile phenotypes.
Table 3. Frequency of MP spatial profile types determined by objective and subjective classification (n=40). Results presented as %, with the actual number in brackets.
Exponential Ring-like Central dip
% (n) % (n) % (n)
Objective spatial profiling
Scan 1 52.5 (21) 47.5 (19) 0 (0)
Scan 2 60.0 (24) 40.0 (16) 0 (0)
Subjective visual profiling
Scan 1 62.5 (25) 30 (12) 7.5 (3)
Scan 2 57.5 (23) 35 (14) 7.5 (3)
Table 4. Correlation of MPOD at single central eccentricities with integrated MPODint (0–3.8°) among the participants of the twin study (n=314). P<0.0005 for all.
Mean SD Correlation with MPODint (0–3.8),R2
MPOD at 0.1° 0.58 0.18 0.64
MPOD at 0.8° 0.34 0.13 0.90
MPOD at 1.8° 0.10 0.05 0.84
[image:7.595.46.380.265.331.2]References
Barker FM, Snodderly DM, Johnson EJ, Schalch W, Koepcke W, Gerss J & Neuringer M (2011): Nutritional manipulation of primate retinas, V: effects of lutein, zeaxanthin, and n-3 fatty acids on retinal sensitivity to blue-light-induced damage. Invest Ophthalmol Vis Sci52: 3934– 3942.
Bartlett H, Acton J & Eperjesi F (2010): Clinical evaluation of the MacuScope macular pigment densitometer. Br J Ophthalmol94: 328–331. Berendschot TTJM & van Norren D (2006):
Macular pigment shows ringlike structures. Invest Ophthalmol Vis Sci47: 709–714. Bland JM & Altman DG (1986): Statistical
methods for assessing agreement between two methods of clinical measurement. Lancet 1: 307–310.
Bland JM & Altman DG (1999): Measuring agreement in method comparison studies. Stat Methods Med Res8: 135–160.
Canovas R, Lima VC, Garcia P, Morini C, Prata TS & Rosen RB (2010): Comparison between macular pigment optical density measurements using two-wavelength autofluorescence and heterochromatic flicker photometry techniques. Invest Ophthalmol Vis Sci51: 3152–3156. Ctori I & Huntjens B (2017): The association
between foveal morphology and macular pig-ment spatial distribution: an ethnicity study. PLoS ONE12: e0169520.
Degli Esposti S, Egan C, Bunce C, Moreland JD, Bird AC & Robson AG (2012): Macular pigment parameters in patients with Macular Telangiectasia (MacTel) and normal subjects: implications of a novel analysis. Invest Oph-thalmol Vis Sci,53(10): 6568–6575.
Delori FC (2004): Autofluorescence method to measure macular pigment optical densities fluorometry and autofluorescence imaging. Arch Biochem430: 156–162.
Delori FC, Goger DG, Hammond BR, Snodderly DM & Burns SA (2001): Macular pigment density measured by autofluorescence spec-trometry: comparison with reflectometry and heterochromatic flicker photometry. J Opt Soc Am18: 1212–1230.
Delori FC, Goger DG, Keilhauer C, Salvetti P & Staurenghi G (2006): Bi-modal spatial distribution of macular pigment: evidence of a gender relation-ship. J Opt Soc Am23: 521–538.
Delori F, Greenberg JP, Woods RL, Fischer J, Duncker T, Sparrow J & Smith RT (2011): Quantitative measurements of autofluorescence with the scanning laser ophthalmoscope. Invest Ophthalmol Vis Sci52: 9379–9390.
Dietzel M, Zeimer M, Heimes B, Pauleikhoff D & Hense HW (2011): The ringlike structure of macular pigment in age-related maculopathy: results from the Muenster Aging and Retina Study (MARS). Invest Ophthalmol Vis Sci52: 8016–8024.
Elsner AE, Burns SA, Beausencourt E & Weiter JJ (1998): Foveal cone photopigment distribu-tion: small alterations associated with macular pigment distribution. Invest Ophthalmol Visual Sci39: 2394–2404.
Hammond BR, Wooten BR & Snodderly DM (1997): Individual variations in the spatial profile of human macular pigment. J Opt Soc Am14: 1187–1196.
Hammond CJ, Liew SHM, Van Kuijk FJ, Beatty S, Nolan JM, Spector TD & Gilbert CE (2012): The heritability of macular response to supple-mental lutein and zeaxanthin: a classic twin study. Invest Ophthalmol Vis Sci 53: 4963– 4968.
Huntjens B, Asaria TS, Dhanani S, Konstanta-kopoulou E & Ctori I (2014): Macular pigment spatial profiles in South Asian and white subjects. Invest Ophthalmol Vis Sci55: 1440– 1446.
Iannaccone A, Mura M, Gallaher KT et al. (2007): Macular pigment optical density in the elderly: findings in a large biracial midsouth population sample. Invest Ophthalmol Vis Sci
48: 1458–1465.
Iannaccone A, Carboni G, Forma G, Mutolo MG & Jennings BJ (2016): Macular pigment optical density and measures of macular func-tion: test-retest variability, cross-sectional cor-relations, and findings from the Zeaxanthin Pilot Study of Response to Supplementation (ZEASTRESS-Pilot). Foods5: 32.
Junghans A, Sies H & Stahl W (2001): Macular pigments lutein and zeaxanthin as blue light filters studied in liposomes. Arch Biochem391: 160–164.
de Kinkelder R, van der Veen RLP, Verbaak FD, Faber DJ, van Leeuwen TG & Berendschot TTJM (2010): Macular pigment optical density measurements: evaluation of a device using heterochromatic flicker photometry. Eye 25: 105–112.
Kirby ML, Galea M, Loane E, Stack J, Beatty S & Nolan JM (2009): Foveal anatomic associ-ations with the secondary peak and the slope of the macular pigment spatial profile. Invest Ophthalmol Vis Sci50: 1383–1391.
Kirby ML, Beatty S, Loane E, Akkali MC, Connolly EE, Stack J & Nolan JM (2010): A central dip in the macular pigment spatial profile is associated with age and smoking. Invest Ophthalmol Vis Sci51: 6722–6728. Landis JR & Koch GG (1977): The measurement
of observer agreement for categorical data. Biometrics33: 159–174.
Liew SHM, Gilbert CE, Spector TD et al. (2005): Heritability of macular pigment: a twin study. Invest Ophthalmol Vis Sci46: 4430–4436. Loughman J (2010): The statistical interpretation
of the coefficient of repeatability. Br. J Oph-thalmol94: 753–756.
McAlinden C, Khadka J & Pesudovs K (2011): Statistical methods for conducting agreement (comparison of clinical tests) and precision (repeatability or reproducibility) studies in optometry and ophthalmology. Ophthalmic Physiol Opt31: 330–338.
Nolan JM, Stringham JM, Beatty S & Snodderly DM (2008): Spatial profile of macular pigment and its relationship to foveal architecture. Invest Ophthalmol Vis Sci49: 2134–2142. Nolan JM, Akkali MC, Loughman J, Howard
AN & Beatty S (2012): Macular carotenoid supplementation in subjects with atypical spa-tial profiles of macular pigment. Exp Eye Res
101: 9–15.
Putnam CM & Bassi CJ (2015): Macular pigment spatial distribution effects on glare disability. J Optom8: 258–265.
Robson AG, Moreland JD, Pauleikhoff D, Mor-rissey T, Holder GE, Fitzke FW, Bird AC & van Kuijk FJGM (2003): Macular pigment
density and distribution: comparison of fundus autofluorescence with minimum motion pho-tometry. Vision Res43: 1765–1775.
Sasamoto Y, Gomi F, Sawa M, Tsujikawa M & Hamasaki T (2010): Macular pigment optical density in central serous chorioretinopathy. Invest Ophthalmol Vis Sci51: 5219–5225. Sharifzadeh M, Bernstein PS & Gellermann W
(2006): Nonmydriatic fluorescence-based quan-titative imaging of human macular pigment distributions. J Opt Soc Am23: 2373–2387. Sharifzadeh M, Zhao DY, Bernstein PS &
Gellermann W (2008): Resonance Raman imaging of macular pigment distributions in the human retina. JOSA A,25(): 947–957. Sim J & Wright CC (2005): The Kappa statistic in
reliability studies: use, interpretation, and sam-ple size requirements. Phys Ther85: 257–268. Snodderly DM, Mares JA, Wooten BR, Oxton L,
Gruber M & Ficek T (2004): Macular pigment measurement by heterochromatic flicker pho-tometry in older subjects: the Carotenoids and Age-Related Eye Disease Study. Invest Oph-thalmol Vis Sci45: 531–538.
Tang CY, Yip H, Poon M, Yau W & Yap MKH (2004): Macular pigment optical density in young Chinese adults. Ophthalmic Physiol Opt24: 586–593.
Tariq A, Mahroo OA, Williams KM, Liew SHM, Beatty S, Gilbert CE, Van Kuijk FJ & Ham-mond CJ (2014): The heritability of the ring-like distribution of macular pigment assessed in a twin study. Invest Ophthalmol Vis Sci 55: 2214–2219.
Trieschmann M, Spital G, Lommatzsch A, van Kuijk E, Fitzke F, Bird AC & Pauleikhoff D (2003): Macular pigment: quantitative analysis on autofluorescence images. Graefes Arch Clin Exp Ophthalmol241: 1006–1012.
Trieschmann M, Heimes B, Hense HW & Pauleikhoff D (2006): Macular pigment optical density measurement in autofluorescence imag-ing: comparison of one- and two-wavelength methods. Graefes Arch Clin Exp Ophthalmol
44: 1565–1574.
Wolf-Schnurrbusch UEK, R€o€osli N, Weyermann E, Heldner MR, H€ohne K & Wolf S (2007): Ethnic differences in macular pigment density and distribution. Invest Ophthalmol Vis Sci48: 3783–3787.
Wustemeyer H, Moessner A, Jahn C & Wolf S (2003): Macular pigment density in healthy subjects quantified with a modified confocal scanning laser ophthalmoscope. Graefe’s Arch Clin Exp Ophthalmol241: 647–651.
Received on March 22nd, 2017. Accepted on January 21st, 2018.
Correspondence:
Irene Ctori, Applied Vision Research Centre, City, University of London,
Northampton Square, London EC1V 0HB, UK
Tel: +44 20 7040 0132 Email: [email protected]