City, University of London Institutional Repository
Citation
:
Black, R., Tsanakas, A., Smith, A., Beck, M. B., Maclugash, I. D., Grewal, J.,
Witts, L., Morjaria, N., Green, R. & Lim, Z. (2017). Model risk: illuminating the black box.
British Actuarial Journal, doi: 10.1017/S1357321717000150
This is the published version of the paper.
This version of the publication may differ from the final published
version.
Permanent repository link:
http://openaccess.city.ac.uk/18426/
Link to published version
:
http://dx.doi.org/10.1017/S1357321717000150
Copyright and reuse:
City Research Online aims to make research
outputs of City, University of London available to a wider audience.
Copyright and Moral Rights remain with the author(s) and/or copyright
holders. URLs from City Research Online may be freely distributed and
linked to.
City Research Online:
http://openaccess.city.ac.uk/
[email protected]
unrestricted re-use, distribution, and reproduction in any medium, provided the original work is properly cited. doi:10.1017/S1357321717000150
Model risk: illuminating the black box
R. Black*, A. Tsanakas, A. D. Smith, M. B. Beck, I. D. Maclugash,
J. Grewal, L. Witts, N. Morjaria, R. J. Green and Z. Lim
[Institute and Faculty of Actuaries, By the Integrated Risk Management Working Party]
Abstract
This paper presents latest thinking from the Institute and Faculty of Actuaries’Model Risk Working Party and follows on from their Phase I work,Model Risk: Daring to Open the Black Box. This is a more practical paper and presents the contributors’ experiences of model risk gained from a wide range offinancial and non-financial organisations with suggestions for good practice and proven methods to reduce model risk. After a recap of the Phase I work, examples of model risk commu-nication are given covering commucommu-nication: to the Board; to the regulator; and to external stakeholders. We present a practical framework for model risk management and quantification with examples of the key actors, processes and cultural challenge. Lessons learned are then presented from other industries that make extensive use of models and include the weather forecasting, software and aerospace industries. Finally, a series of case studies in practical model risk management and mitigation are presented from the contributors’own experiences covering primarilyfinancial services.
Keywords
Model risk; Model; Model error; Model uncertainty; Risk culture
1. Model Risk: Daring to Open the Black Box
1.1.1. The Model Risk Working Party’s Phase 1 paper,Model Risk: Daring to Open the Black Box, was well received and was awarded the Institute and Faculty of Actuaries (IFoA) Peter Clark prize for best paper, 2015. As a result a Phase 2 of the working party was established to take forward some of the ideas presented in Phase 1 and these are presented in this paper. We begin by summarising the main themes from the Phase 1 paper including the core notion of a Model Risk Management Framework.
1.1.2. First, we recap the definition of a model. In the words of the Board of Governors of the Federal Reserve System (2011):
1.1.3. [T]he term model refers to a quantitative method, system, or approach that applies statistical, economic,financial, or mathematical theories, techniques, and assumptions to process input data into quantitative estimates. A model consists of three components: an information input component, which delivers assumptions and data to the model; a processing component, which transforms inputs into estimates; and a reporting component, which translates the estimates into useful business information.
1.1.4. The concept of model risk is therefore twofold:
∙
models may have fundamental errors and may produce inaccurate outputs when viewed against the design objectives and intended business uses; and∙
a model may be used incorrectly or inappropriately.1.1.5. The Phase I paper summarised a number of high-profile examples of model error that serve as salutary case studies, including the well-documented Long-Term Capital Management Hedge Fund collapse (1997), the bidding for the West Coast Rail Franchise (2012) and the JP Morgan“London whale”trading event (2012).
1.1.6. We highlighted that model risk is not as well defined and established as other more traditional risks, so the identification, understanding and communication of model risk is crucial.
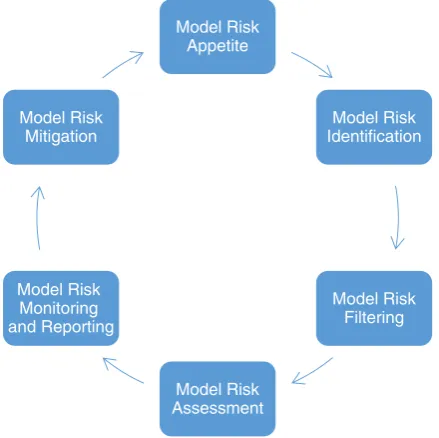
[image:3.493.145.365.395.614.2]1.1.7. The paper proposed a Model Risk Management Framework consisting of a cycle as shown in Figure 1 –and elements of this are explored further in this paper. Such a framework should be applied to those models which are most business-critical for the purposes of decision-making,
financial reporting, etc.
1.1.8. Each part of the Model Risk Management Framework was explored in some detail and suggestions made as to how such a framework could have prevented or mitigated some of the case studies documented. It is worth recalling here the main features of each part of the framework.
1.1.9.Overall model risk governance:In order to put in place appropriate governance around model risk, an organisation should establish an overarching Model Risk Policy which sets out the roles and responsibilities of the various stakeholders in the model risk management process, accompanied by
Model Risk Appetite
Model Risk Identification
Model Risk Filtering
Model Risk Assessment Model Risk
Monitoring and Reporting
Model Risk Mitigation
more detailed modelling standards which set out specific requirements for the development, vali-dation and use of models.
1.1.10.Model risk appetite: The Board’s appetite for model risk needs to be defined and articulated into a risk appetite statement. Specifically, the Board has to establish the extent of its willingness, or otherwise, to accept results from complex models, and its tolerance for accuracy around the results from these models. As with any risk, the risk appetite for model risk should be articulated in the form of appetite statements or risk tolerances, translated into specific metrics with associated limits for the extent of model risk the Board is prepared to take. Examples of metrics that could be considered in a model risk appetite statement are:
∙
Extent to which all models have been identified and risk assessed; extent to which models are compliant with Standards applicable to their materiality rating; number of high residual risk models; number of high risk limitations/findings; duration of outstanding or overdue remediation activities; key person dependencies around high materiality models.∙
The company’s position against the model risk appetite should be monitored by the individual or body responsible for the risk management of models on a regular basis, and should allow management to identify where actions are needed to restore positions within risk limits.1.1.11.Model risk identification: We need to identify the model risks to which the company is exposed. In order to do this, it is necessary to identify all existing models and key model changes or new developments. For existing models, an inventory should be created in which each team or department lists all models in use. All modelsfitting the definition in section 1.1.2 should be considered. Models should be listed by usage/purpose, in order to ensure consistency in approach and a pragmatic usable inventory. The data collected on each model should be sufficiently detailed to allow a risk rating to be determined for each model and hence the extent to which the Model Risk Management Framework needs to be applied.
1.1.12.Model riskfiltering: The model risk identification step will likely identify a large number of models and model developments in an organisation. A materialityfilter should therefore be applied (in line with thefirm’s model risk appetite) to identify those models which present a material risk to the organisation as a whole and which need to be robustly managed.
1.1.13.Model risk assessment: Having identified the material models, the next step is to assess the extent of model risk for each material model or model development. This can be attempted as a quantitative or a qualitative assessment. For example, sensitivities to key assumptions, outcomes of model validations/audits, or where it cannot be evidenced that model components have been through a recognised testing process then the models and output will generally be accepted as more risky.
1.1.14.Model risk mitigation: As a result of monitoring, thefirm should know whether it is within or outside its model risk appetite. If outside then relevant actions to bring the company back into its appetite within an appropriate timeframe should be proposed. For example, model changes to remediate known material issues; additional model validation may be appropriate; an overlay of expert judgement should be applied to the model output to address the uncertainty inherent in the model; applying additional prudence to model assumptions; or explicitly holding additional operational risk capital.
Example content might include: the organisation’s overall model risk profile compared with its agreed appetite; recommended actions to restore model risk profile back to within appetite; outcomes of key model validations highlighting any issues or areas of weakness; any emerging trends or risks with model risk whether within the organisation or from regulatory/industry developments.
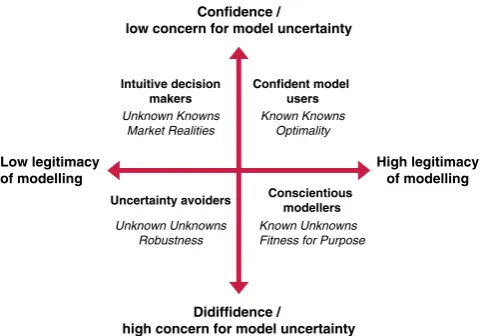
1.1.16. Central to any model risk governance framework is the acceptance that different cultures and user perspectives co-exist within any organisation. We identified four prevalent types or“cultures” of users of models all with valid perspectives on model risk, as shown in Figure 2:
∙
confident model users believe that good decision-making can and should be driven by models;∙
conscientious modellers are primarily concerned with the technical validity of a model;∙
uncertainty avoiders view all risks that matter as ever-changing and interconnected and doubt that any model can truly be“fit for purpose”; and∙
intuitive decision-makers make decisions based on instinct and just use models to justify their intuition.1.1.17. Recognising that the four perspectives above are all valid viewpoints, the paper argued that governance and controls to manage model risk often do not consider the different perspectives on the model that can exist in an organisation. Suggestions were made as to how to correct this. In particular, the inclusion of non-technical, commercially oriented perspectives in model governance is necessary, even though this might be uncomfortable for technical model reviewers.
1.1.18. The paper concluded by focussing on model risk measurement and made attempts to quantify model risk, where possible, in the areas of proxy modelling, longevity andfinancial planning models. Finally, parallels were found in non-financial models such as those used for environmental protection.
1.1.19.Phase 2: In response to feedback from Phase 1, the Working Party was sponsored to continue to develop thought leadership on the subject of model risk through a second phase, with the remit to focus specifically on expanding on the following areas:
∙
further case studies and their relevance to the actuarial world;∙
model risk communication–internally to the Board and externally to regulators, investors and other third parties;Intuitive decision makers Unknown Knowns
Market Realities
Confident model users Known Knowns
Optimality
Uncertainty avoiders
Unknown Unknowns Robustness
Conscientious modellers Known Unknowns Fitness for Purpose
Confidence /
low concern for model uncertainty
Didiffidence /
high concern for model uncertainty
High legitimacy of modelling Low legitimacy
[image:5.493.134.375.57.225.2]of modelling
∙
how practically to implement a model risk management framework;∙
a standard approach to model risk assessment/quantification;∙
insights on good model risk management practices that can be learned from other industries; and∙
application for actuaries working in variousfields (Insurance, Pensions and Banking, etc.).1.1.20. We therefore look to address each of these areas in this paper although we donotattempt to set out any explicit (new) quantitative evidence to support our thinking.
1.1.21. In particular, we present a number of further case studies where model risk has raised itself in the public consciousness (section 2). We then consider what effective communication around model risk to a company’s Board, the regulator and external stakeholders might look like, recognising that all have different perspectives and levels of understanding around the model risk that a company runs (section 3). We then present how to practically implement a model risk management framework (section4) by assigning key model roles and most effectively leveraging a central model inventory, and addressing specifically how third party software risks, model reviews and cultural challenges around models, can be practically managed. In addition, we propose a framework for model risk quantification based on different sources of data. In section 5 we consider lessons learned from other (non-financial) industries including Weather Forecasting and Software. In section 6 we present some practical applications of reducing model risk for actuaries working in variousfields based on the authors’own experiences, andfinally in section 7 we conclude with some summary remarks.
2. Further Model Risk Case Studies
Following feedback from Phase 1, we provide further real world case studies of models “badly behaving”, helping bring to life sources of model risk and its management, and we highlight the relevant considerations for actuarial modelling.
We present three examples below: NASA’s loss of its Mars Climate Orbiter (MCO) in 1999; modelling of the Cumbriafloods in 2015; and the seminal paper“Growth in a Time of Debt”that was used by policy-makers to promote an austerity agenda following the 2007–2008financial crisis.
2.1. Loss of NASA
’
s MCO (1999)
2.1.1.Background: In 1998, NASA launched the MCO with the aim of collecting information to enable better understanding of the Martian climate. In September 1999, the space probe was“lost” (NASA, 2000b). The trajectory of the spacecraft had been incorrectly calculated, which meant that the spacecraft had actually been orbiting much closer to Mars than had been targeted causing the space probe to disintegrate in the planet’s atmosphere (NASA, 2009).
2.1.2.Detail: An investigation was conducted by the MCO Mishap Investigation Board to under-stand what had caused the error which lead to the destruction of the $125 million space probe. The initial report (NASA, 1999b) released following the investigation described the root cause and other significant factors that contributed to the space probe loss.
Specification (SIS)–which detailed that the results should be supplied in metric units. The navigation team at NASA’s Jet Propulsion Laboratory mistook this data as being in the required metric units of Newton-seconds. This led to the errors in the spacecraft’s trajectory calculations.
2.1.4. The root cause, although important, was not deemed to be the sole factor causing the MCO loss. This was because“sufficient processes are usually in place on projects to catch these mistakes before they become critical to mission success. Unfortunately for MCO, the root cause was not caught by the processes in-place in the MCO project”.
2.1.5. Other contributing factors that “allowed this error to be born, and then let it linger and propagate to the point where it resulted in a major error in our understanding of the spacecraft’s path as it approached Mars”included:
∙
inadequate consideration of the entire mission and its post-launch operation as a total system;∙
inadequate training;∙
lack of complete end-to-end verification and validation of navigation software and related computer models;∙
inadequate communication between the different teams; and∙
absence of a fault-tree analysis process for determining “what could go wrong” during the mission.2.1.6. In addition, a second report prepared by the MCO Mishap Investigation Board discussed lessons learned from the MCO failure as well as failures from other failed missions (NASA, 2000a).
2.1.7. One key theme that ran through the second report was the need for a shift in culture. The MCO mission had been created under NASA’s“Faster, Better, Cheaper” philosophy and did not “adequately instil a mission success culture that would shore up the risk introduced by these cuts”. It was felt that there had been too much emphasis placed on cost and schedule reduction. The graph below has been taken from page 11 of the second report. It highlights how the board felt that a balance needed to be struck against cost cutting and risk identification and management.
intended that Risk“becomes the‘fourth dimension’of project management— treated equally as important as cost and schedule”.
2.1.9.Lessons NASA learnt from the MCO loss: The initial report outlined a number of recom-mendations including:
∙
the use of consistent units as well as audits for all data being transferred between teams;∙
models should be validated and a comparison of different navigation methods considered;∙
additional training and specific information should be provided which should include face-to-face meetings between teams. Team members should be trained in software processes but also in the use and the importance of following the documentation;∙
the number of new and relatively inexperienced members should be balanced with the addition of more experienced personnel. Contingency plans should also be prepared for backing up key personnel for mission-critical functions;∙
roles, responsibilities and accountabilities should be defined clearly;∙
it should be stressed to staff that communication is critical and that team members should feel empowered to forcefully elevate any concerns;∙
an increase in the amount of formal and informal face-to-face communications as well as a “routine forum for informal communication between all team members at the same time so everyone can hear what is happening (eg, a 15 minute stand-up tag-up meeting every morning)”. Co-locations of key project team members could also enable this;∙
a“Mission Safety First”attitude should be adopted;∙
independent peer reviews of mission critical events; and∙
a more robust verification and validation process of the software development and testing. The Board recommended that a“system verification matrix for all project requirements”be developed which should be reviewed at all major reviews.2.1.10.Considerations for actuarial models: The issues highlighted in this case study could arguably be just as easily found in the models used by a wide range of industries. The issues uncovered related to inadequate external data quality and validation as well as inappropriate model methodology and governance.
2.1.11. First, this case study highlights the need for care when dealing with models; the simplest of errors can have a detrimental impact. This can be thought to hold true for most models – inappropriate data are a common source of model risk.
2.1.12. It was undisputed that the root cause of the MCO loss was the human error of the navigation data not being converted into the correct units. However, as was mentioned throughout the Investigation Board’s reports, it was believed that this simple error itself was the not main issue. The main issue was the fact that the error had gone unnoticed despite a number of quality control processes being in place.
2.1.13.“Our inability to recognize and correct this simple error has had major implications”, said Dr Edward Stone, director of NASA’s Jet Propulsion Laboratory, NASA (1999a).
most models and this case study raises a number of questions relating to model risk in other industries such as insurance.
2.1.15. As we have seen through work recently done in response to Solvency II, there is a vast amount of process documentation and data directories now in place to support model use. But can we ensure that such documentation is being used effectively and not just being ignored (similar to the treatment of the SIS in this case study)?
2.1.16. Interestingly, members of the operations navigation team did have concerns about the trajectory of the space probe before the spacecraft was lost. However, these concerns were not effectively communicated to the other teams. The Board found the operation navigation team to be “somewhat isolated”to other teams by“inadequate communication”. Are we using communication effectively as part of our model risk mitigation procedures?
2.1.17. Furthermore, theFaster, Better, Cheaperphilosophy may arguably be a philosophy adopted naturally by many companies. Models are increasingly being put to greater use and increasingly being used to inform business decisions. This increase in model use is not always necessarily backed by an increase in resource. This case study emphasises the importance of ensuring that an appro-priate culture and mind set is maintained despite cost and time constraints.
2.1.18. Finally, another key lesson to keep in mind is the risk of becoming over-comfortable and complacent when using models. Just before the loss of the MCO space probe, it was perceived that “Orbiting Mars is routine”(NASA, 2000b) since the navigation of such spacecraft had been carried out successfully for several decades. This led to insufficient focus on identifying and mitigating risks relating to spacecraft navigation. The following statement, a recommendation made by the Investigation Board, should be kept in mind:
2.1.19.“Personnel should question and challenge everything—even those things that have always worked”.
2.2. Cumbria Flooding (2015)
2.2.1. Background: Northwest England experienced record rainfall during 5–6 December 2015, claiming two lives and resulting in an estimated 5,200flooded houses and £500 million of damage across Cumbria, the worst affected area.
2.2.2. Details: Over 5,000 homes were leftflooded and 50,000+ left without power after Storm Desmond wreaked havoc in parts of the United Kingdom on 5 and 6 December 2015. Storm Desmond was an extra tropical cyclone and the fourth named storm of the 2015–2016 UK and Ireland windstorm season. Desmond directed a plume of moist air, known as an atmospheric river, in its wake, bringing in moist air from the Caribbean to the British Isles, and meaning that rainfall from Desmond was unusually heavy.
2.2.4. The devastation resulted in criticism of the government after multimillion-pound defences built followingfloods in Cumbria in 2005 failed to keep the deluge out from people’s homes. However, Environment Agency officials said the Cumbriaflood defences did work, but no matter how sub-stantial any defences are,“you can always get water levels higher than that, in which case it will go over the top”. The Met Office said Storm Desmond had more impact because the “exceptional” levels of rain fell on already saturated land.
2.2.5. On the other hand, Sandtable, a modelling consultancy, commented:“…investments inflood protection since the last majorfloodings in 2009 could not be expected to deal with something as unprecedented as 300 mm of rain within 24 hours because it is such a rare event (the monthly average rainfall for Cumbria in December is 146.1 mm). But it is a rare event that has happened three times in the last 10 years”(Sandtable, 2015).
2.2.6.Considerations for actuarial models: The above statements highlight that, in the wake of such a disaster, two alternative interpretations of events can be plausible: (a) that there was a failure of prediction, possibly due to modellingflaws; or (b) that there was no failure of prediction, but the event that occurred was so rare that it was reasonable that no precautions to fully mitigate it were in place.
2.2.7. In the context of extreme events, it is difficult to decide which of those two interpretations more closely reflects reality. Which interpretation is accepted as the dominant narrative of events matters, as it relates to apportioning of blame: to modellers (for not predicting the event) or to decision-makers (for not taking suitable precautions). The argument that it was reasonable to not be fully prepared for an event that did eventually materialise is not easily accepted by the public.
2.2.8. Furthermore, the difficulty of communicating the risk of extreme events is highlighted in this case study. Return periods (“1-in-200 years”) are easier to communicate than probabilities (“probability of 1-in-200 over the next year”). However, the use of return periods implies that the frequency of the phenomenon described is stable over time. For some things like earthquakes that may well be true, but for pretty much anything else, includingfinancial markets and rainfall patterns (in the context of climate change), it most likely is not: the language we use is not neutral, it makes implicit epistemological assumptions.
2.2.9. Additionally, information expressed through return periods and probabilities may be ambiguous to the public, if the reference class of probability statements is not given, that is, the population“out of which”frequencies are evaluated (Gigerenzer & Edwards, 2003). For example, if weather patterns were stationary, a 1-in-200 year storm at a particular location would be expected to be exceeded with a probability of 1/200 in any given year. But there is a much higher probability of observing such an extreme storm at some location within a given territory. The more the relevant locations, the higher the frequency of observed“1-in-200 year”events.
2.3. Growth in a Time of Debt (2010)
2.3.2. The key policy question the paper attempted to answer was: Is it better to let debt increase in the hope of stimulating economic growth to get out of a slump, or is it better to cut spending and raise taxes aggressively to get public debt under control?
2.3.3. The paper attracted a lot of interest, including from the economics department at the Uni-versity of Massachusetts Amherst. Professors Michael Ash and Robert Pollin set a graduate student, Thomas Herndon, the task of picking an economics paper and seeing if he could replicate the results, framed as a good exercise for aspiring researchers.
2.3.4. Herndon’s attempts to replicate the results proved unsuccessful. After Herndon contacted the authors, Reinhart and Rogoff provided him with the actual working spreadsheet they had used to obtain their results. Herndon discovered a number of issues, including:
∙
the authors had accidentally only included 15 of the 20 countries under analysis in their key calculation (having excluded Australia, Austria, Belgium, Canada and Denmark);∙
for some countries, some data were missing altogether; and∙
the methodology to average out performance of countries of different sizes was called into question. For example, 1 bad year for New Zealand, was weighted equally with the United Kingdom, a more global economy with nearly 20 years of high public debt.2.3.5. After correcting for the above issues, the basic conclusion that countries with indebtedness rates above 90% of GDP have lower growth rates still held, but the most spectacular results disappeared, the relationship was much gentler and there were numerous exceptions to the rule (Herndonet al., 2014). Thesefindings substantially weaken the role of Reinhart and Rogoff’s (2010) contribution to arguments in favour of adopting of austerity policies in countries with various levels of public debt.
2.3.6.Considerations for actuarial models: The errors in the original paper by Reinhardt and Rogoff could be classified as rather major“blunders”, which should have been discoverable even by an elementary spreadsheet check. So the question of relevance is less how these errors were made, but more how they found their way into thefinal paper.
2.3.7. We note that Reinhart and Rogoff have made consistently the case for controlling public debt, both before and after publication of their 2010 paper (Cassidy, 2013). While Reinhart and Rogoff admitted (to an extent) to errors in the original paper, they were quite clear that their views of the related policy issues have not changed. This indicates that the results of the 2010 paper were in line with a wider set of beliefs held by the authors.
2.3.8. The importance of this is illustrated by a counterfactual. Let us assume that the spreadsheet errors had been such that no result was found that supports the thesis of high public debt being associated with low growth. In that case, we can reasonably speculate that the researchers would have been surprised by thefindings and may have actively looked for (and eventually discovered) the spreadsheet errors.
2.3.10. Furthermore, central to this case study is the reproducibility of model results and the openness that Reinhart and Rogoff demonstrated in sharing their spreadsheets with the Amherst researchers. It is exactly this transparency, common in some (though not all) areas of academic research, that allowed the errors to be discovered. Such transparency is not easily attainable for many models deployed within thefinancial industry. Consequently, one can only speculate as to the number and impact of errors that sit undetected.
2.4. Summary
2.4.1. The three case studies presented in this chapter illustrate a number of important points that can be applied to actuarial models. From the Mars Orbiter loss we learn the value of a“challenge everything”culture and the importance of good and timely communication especially when applied to large modelling teams. The Cumbriaflooding case study shows the difficulty of communicating extreme risk events to the public and defending models in light of these events. Finally, the“Growth in a Time of Debt”case shows us the importance of independent model reviews and of providing transparency around key assumptions and methodology.
3. Model Risk Communication
Since model risk is not as well defined and established as other more traditional risks, the identifi -cation, understanding and communication of model risk is crucial. We consider here how best to communicate to key internal stakeholders (the Board and Senior Management) and key external stakeholders (regulators and analysts/investors). As an example, a recent paper by the Lloyd’s Market Association (LMA) Exposure Management Working Group (2017) offers a structured way of explaining model risk in practical circumstances to a Board-level audience, in that case offering examples of catastrophe modellers working in the Lloyd’s market.
3.1. Internal Stakeholders
3.1.1. Overall responsibility for managing model risk must lie with the Board (or equivalent). This is because model risk events can impact thefinancial strength of the company and because the Board is ultimately responsible for the results and decisions of the organisation which are built upon, potentially, multiple layers of models.
3.1.2. It is therefore important that members of the Board, and where applicable the Risk and Audit Committees, are presented with clear, succinct information on model risk which enables them to understand how well model risk is being managed by the organisation and the key model risks of which they should be aware, as well as any actions that are being taken or proposed in order to restore model risk exposures to positions with which the Board is comfortable (within the Board’s risk appetite).
3.1.3. In particular, we would expect communications to these internal stakeholders to cover:
∙
any breaches of model risk appetite limits, and high-level commentary on the causes of the breach (es) and the path and timeline to return to within appetite;∙
any key High risk model limitations or weaknesses in model risk governance, identified by thefirst (Model Owners), second (model reviewers) or third (internal audit) lines of defence, and how they may impact the respective results; and3.1.4. For the next level down (e.g. for sub-committees or accountable individuals responsible for model risk management), more granular MI on model risk should be presented to enable the indi-vidual, or body, to manage all aspects of model risk. We would therefore expect communications to these internal stakeholders to cover:
∙
the organisation’s overall model risk profile compared with its agreed appetite;∙
any proposed management actions to be taken where necessary to manage the company’s model risk within appetite;∙
key model developments in progress or recently completed;∙
outcomes of recent model validations, reviews or audits, highlighting any medium or high risk issues or areas of weakness identified;∙
actions being taken by management to address these issues, along with associated timelines and progress to date;∙
any breaches of Model Risk Policy or non-compliance with modelling standards, and associated timelines to remediate; and∙
any emerging model risks, whether associated with regulatory, market or other internal developments.3.1.5. In addition, specific deep-dives on material models may be appropriate, covering:
∙
scope and purpose of model;∙
fitness for purpose of model;∙
key model limitations/findings;∙
key expert judgements/assumptions underlying the model, and sensitivities to these judgements;∙
extent of review/challenge/validation of the model; and∙
quality of data underlying the model.3.1.6. This will allow the individual or body to more holistically understand the nature of and risks associated with each of the key models, and to be able to opine and challenge more robustly in order to effectively meet their responsibilities.
3.2. External Stakeholders
3.2.1. There are two key groups of external stakeholders to which to consider communicating on model risk–regulators and analysts/investors.
3.2.2. Communicating to external stakeholders brings challenges. Internal stakeholders are a known quantity, and will have an understanding of the background and context of the model risks of the business. Regulators will also have a degree of understanding of the context and of the topic of model risk and industry issues; however, other external audiences will have an unknown range of purposes, expertise and cultures.
3.2.4. However, without knowledge of the purpose of the recipient it is hard to make the call on their behalf that what is accepted internally as an acceptable level of risk is still acceptable to them, given their potentially different context and criteria.
3.2.5. This leads us on to explore further the types of recipient and the purposes for which an institution’s modelling may be important.
3.2.6.To whom are we communicating externally on model risk?: For any institution, in addition to regulators, investors are likely to be the primary external parties with which we are concerned. The security offinancial institutions, such as banks and insurance companies, is inherently reliant on their balance sheets which, in turn, rely upon the veracity of the underlying models. When deciding whether to invest it is reasonable that a potential investor should have some knowledge of the reliance on particular modelling decisions. For example, should a different model turn out to have been more appropriate would this have made a significant difference to the investment decision or made very little change?
3.2.7. Investors may rely upon comment from other parties such as analysts, journalists or ratings agencies. For such comment and analysis to be informed and useful, particularly in carrying out comparisons between different organisations, it is important to understand whether the institution’s results are stable whatever model is used or whether they could vary significantly or contain some heroic assumptions.
3.2.8. Clients, customers, suppliers, etc. are also likely to all be concerned with thefinancial strength of an institution and the level to which this strength is built onfirm foundations, or is impacted by modelling decisions.
3.2.9. There may also be other parties who are making decisions impacted by the model outcomes.
3.2.10. Thus the authors are of the view that it is necessary to convey a sense of the risk inherent in the modelling. However, detailed checks and tests carried out on the models, which may be relevant for internal or regulator communications, would not be possible or appropriate. Finding the balance is key.
3.2.11.What do we need to communicate externally on model risk?: When communicating exter-nally it is generally not likely to be appropriate to use the same approach as for internal commu-nications on model risk. There should be more focus on the company’s model risk management practices, and particularly for communications to investors/analysts we need to convey the infor-mation in a more succinct, less technical manner.
3.2.12. For regulators and investors, the key questions we expect they will be asking, particularly as model risk continues to grow in profile, are as follows:
∙
Does thefirm have a well-understood definition of model risk? Does this have broader reach than just the modelling department?∙
Does model risk have prominence with the Board? Is it a principal risk? Is it included in the Board’s risk appetite?∙
Does consideration of model risk feed into decision-making in an appropriate way?∙
Does thefirm apply sufficient resources, tools and independence to modelling and the assessment of model risk? and3.2.13. We therefore expect that external communication on model risk should directly address these questions.
3.2.14. How should we communicate externally on model risk?: The Own Risk and Solvency Assessment or equivalent, the Annual Report and Accounts, the Solvency and Financial Condition Report and the Regular Supervisory Report, are the primary external documents. These contain information on the principal risks intrinsic in the business. Historically model risk was seen as one of many operational risks. However, we would argue model risk is wider than just the risk of accidentally using wrong parameters. As such, we would now expect to see specific consideration of model risk, which, at the least, would confirm that processes have been undergone to ensure the model is appropriate and applied correctly, and that this has been verified by senior responsible individuals other than the Model Owner.
3.2.15. For some institutions model risk will be sizeable enough to be a principal risk in its own right, for others it will remain a subset of another risk such as operational risk or governance risk, albeit with more prominence.
3.2.16. As the documentation gets more detailed so the granularity on model risk should follow. For example, a bondholder’s prospectus might be expected to contain more detail on model risk than the Annual Report and Accounts.
3.2.17.Why should we communicate externally on model risk?: The concern to date with com-municating externally on model risk is that it could carry more downside risk than upside. Because we cannot properly communicate the uncertainty inherent in the models, does it give a false sense of security? Can it leave the Company unreasonably exposed when things go wrong?
3.2.18. However, this is not different from most other risk types, and ultimately good commu-nication adds value and promotes confidence; particularly as model risk events become more pre-valent in the media and because model risk relates directly to the results on which regulators and investors rely. This may give an institution competitive advantage. It also makes comparisons against others easier and more valid. And, ultimately, as it becomes industry standard practice to commu-nicate on model risk management the recipients will start to expect the information.
3.2.19. Overall, it is the view of the authors that there is a need for more disclosure on model risk, both to regulators and publicly, as the profile and level of understanding of model risk as a risk type is increasing, as is the complexity and importance of actuarial models. It is also valuable to highlight the risk management practices in place around actuarial models as these are in general strong relative to model risk management in many otherfields, due to disciplines instilled through a combination of actuarial standards and regulations such as Solvency II. However, there needs to be additional care when making disclosures around model risk to explain their context, given that precedents at this stage are still limited.
4. Practical Implementation of a Model Risk Management Framework
framework which merit fuller explanation. There are similar remarks made in the recent Macpherson Report (HM Treasury, 2013) which we recommend to the reader. That paper reviews the quality assurance of UK Government analytical models and makes recommendations and best practice guidelines with the objective of ensuring all models are of sufficiently high quality, and that their end users–Ministers and, ultimately, the public–can place their trust in them.
4.1. Central Inventory of Core Models
4.1.1. As defined by the Federal Reserve in section 1.1.3, the term model refers to a quantitative method, system or approach that applies statistical, economic,financial or mathematical theories, techniques and assumptions to process input data into quantitative estimates of outcomes or behaviours which are used for a particular business purpose. Models typically rely on approxima-tions, simplifications and judgements to represent a more complex reality.
4.1.2. This said, we recognise that any large business, especially infinancial services, typically has a great number of “models” that are often much simpler and do not meet the definition above especially by involving little judgement. Such“calculator”models might include, for example, those used for data manipulation (data in are manipulated to data out by following robust and pre-defined rules) or well-defined validation checks which aggregate and summarise data for review.
4.1.3. Model risk for these models can be greatly reduced through appropriate processes and controls. For example: testing the code before release; version controlling the production versions of each models and ensuring staff only use the most up-to-date version; maintaining detailed documentation around each model from the perspective of both developers and users; analysis of the model results using rules-of-thumb; and checking integrity and reasonableness of model inputs and outputs.
4.1.4. For the smaller subset of models within an organisation that do genuinely meet the definition of section 1.1.3, the authors recommend the maintenance of a central inventory, maintained at either a department or business unit level, or at a global level across a company’s entire operation. The inventory should be kept up-to-date, for example, in sync with the reporting cycle, and for good practice might contain the following for each model:
∙
model’s name and version number ideally with a unique reference number;∙
drive location;∙
Model Owner/team responsible for model;∙
a categorisation of the model (see section 4.6) into High/Medium/Basic control risk;∙
when model was last reviewed and by whom;∙
link to user documentation;∙
link to model testing documentation;∙
link to model specification documentation; and∙
link to model methodology/appropriateness review notes and who conducted the review.4.2. Assigning Key Model Roles
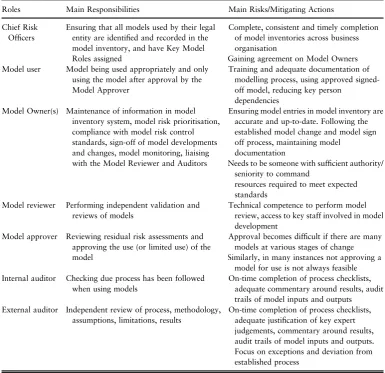
4.2.1. Once models have been identified, the most important step is to assign the key roles around each model. The need to put specific named people in these roles is heightened by the introduction in the United Kingdom of the Senior Insurance Managers’ Regime in March 2016 which requires named individuals to be accountable for key models (Table 1).
4.2.2. The Financial Conduct Authority and Prudential Regulation Authority (PRA) introduced the Senior Managers and Certification Regime (SMR) for banking and the Senior Insurance Managers Regime (SIMR) on 7 March 2016. There is a proposal to introduce this for all FSMA (Financial Services and Markets Act 2010) authorisedfirms during 2018. SMR/SIMR focusses on the most senior individuals in
[image:17.493.61.447.255.628.2]firms who hold key roles or have overall responsibility for whole areas of relevantfirms and reinforces the importance of individual accountability at the most senior level of organisations (see https://www.fca.org. uk/firms/senior-managers-certification-regime).
Table 1. Key Model Roles and Responsibilities
Roles Main Responsibilities Main Risks/Mitigating Actions
Chief Risk Officers
Ensuring that all models used by their legal entity are identified and recorded in the model inventory, and have Key Model Roles assigned
Complete, consistent and timely completion of model inventories across business organisation
Gaining agreement on Model Owners Model user Model being used appropriately and only
using the model after approval by the Model Approver
Training and adequate documentation of modelling process, using approved signed-off model, reducing key person
dependencies Model Owner(s) Maintenance of information in model
inventory system, model risk prioritisation, compliance with model risk control standards, sign-off of model developments and changes, model monitoring, liaising with the Model Reviewer and Auditors
Ensuring model entries in model inventory are accurate and up-to-date. Following the established model change and model sign off process, maintaining model
documentation
Needs to be someone with sufficient authority/ seniority to command
resources required to meet expected standards
Model reviewer Performing independent validation and reviews of models
Technical competence to perform model review, access to key staff involved in model development
Model approver Reviewing residual risk assessments and approving the use (or limited use) of the model
Approval becomes difficult if there are many models at various stages of change Similarly, in many instances not approving a
model for use is not always feasible Internal auditor Checking due process has been followed
when using models
On-time completion of process checklists, adequate commentary around results, audit trails of model inputs and outputs External auditor Independent review of process, methodology,
assumptions, limitations, results
4.2.3. As part of SMR,firms need to:
∙
ensure each Senior Manager has a Statement of Responsibilities setting out the areas for which they are personally accountable; and∙
produce a Firm Responsibilities Map that knits these together.4.2.4. We expect that any such Statement of Responsibilities must include those models within the business unit for which the Senior Manager has responsibility.
4.2.5. Furthermore, we would expect the Key Model Roles to potentially align to SMR/SIMR roles.
4.3. Third Party Software
4.3.1. Discussions in this paper so far have focussed on those models for which the user has sole responsibility, either as the model developer, or as the user of a model that has been developed in-house. However, many modelling suites are reliant on core software and models provided by third parties. For example, most UK life insurers use the same well-known provider for the economic scenario generators (ESGs) that drive their stochastic modelling. Similarly, software from external providers is frequently used to value derivatives and other exotic instruments for asset modelling, and for investment portfolio risk analysis/management.
4.3.2. The working party submits that a third party software provider is akin to“another team, in a separate room” –integral to the success of our business but working remotely from it. As such, all the standards that we hold our own modelling to must equally apply to any third party software that we use–or else we are explicitly acknowledging an unacceptable“weakest link”in our Model Risk Management Framework.
4.3.3. The following advice is given for management of all third party software:
∙
Ensure you have done enough due diligence. Is the third party software you are using really appropriate for the task and how have you gained comfort with this decision? A consensus view should be established before software is installed and incorporate into your modelling suite.∙
Record all third party software alongside your regular models in your central inventory–with the same triage categories of High/Medium/Basic risk.∙
Ensure that there are personnel in your organisation with sufficient knowledge to use and, where required, parametrise the software appropriately. Further, can you challenge the assumptions and methodology in sufficient depth that any limitations can be communicated as they would be with an in-house model?∙
Keep your versions of third party software up-to-date unless there is good reason not to do so. This can often drive your in-house model development cycle, with software lifetimes and support being communicated months and years ahead. (As an example: 90% of UK National Health Service (NHS) Trusts are still using Windows XP despite Microsoft having withdrawn support for this version in April 2014 (Inquirer, 2016).) (This comment was made before the high-profile ransomware cyberattacks on the NHS and other global organisations in May 2017.)change and do they by an acceptable amount. Record UAT tests and outcomes as you would for your own models.
4.3.5. Insist on sufficient and up-to-date user documentation. For technical models, ask for white papers to enable personnel to gain a solid understanding of what is“under the bonnet”.
4.4. Independent Review and Frequency
4.4.1. Models with a“High” control level, as defined in section 4.6, are likely to be ones which would have a large financial impact if they are materially “wrong” or used inappropriately, or which are complex and/or involve a significant amount of judgement in assumptions or methodology.
4.4.2. For these models, we recommend a systematic programme ofindependentreview, as is now standard in the banking industry following thefinancial crisis. Throughout this paper, whenever we refer to validation, we mean independent validation by people who have no involvement in the design and operations of the particular model being validated. The frequency of review will be at management’s discretion but we suggest as a minimum each High risk model being reviewed at least once every 3 years on a rolling basis.
4.4.3. All reviews should be evidenced and recorded in the central inventory (see section 4.1.4) alongside the model being reviewed. We suggest reviews should cover the following:
∙
Model review date; the model and version being reviewed as shown in the inventory.∙
Is it clear what is the purpose of the model, and has it been used for that purpose?∙
Review of model user documentation to ensure its adequacy and a judgement made on whether it could be followed by a“technically competent third party”.∙
Is there clarity around all model inputs and outputs, and the key judgements used in the model?∙
Is there evidence of requirements and testing documentation, and recent model sign-off?∙
Based on the above, are there any action points that should implemented and, if so, is there an agreed date for their completion?4.4.4. It is our view that such review evidence, if maintained regularly and held alongside the central inventory, will serve to greatly reduce model risk around an organisation’s key High risk models.
4.5. The culture challenge
4.5.1. Developing, testing and running models, as well as using their outputs in decision-making, are complex endeavours that can involve many different participants across an organisation. As such, we must recognise that a company’s culture plays an important part in the ways model risk emerges and the ways it can be managed.
perceptions of models. Here we outline some of the practical challenges that model governance faces. They revolve around:
∙
opening up the model to a wider set of stakeholders;∙
social pressures relating to the difficulty of expressing dissenting views; and∙
balancing model change and innovation.4.5.3.Opening up the model: The complexity of some models can lead to a lot of power resting in the hands of experienced developers and technical experts, with models seen as black boxes by other stakeholders. This means that there may be insufficient opportunity for the technical judgements made to be challenged by a wider set of experts, such as model users and the Board. An obvious risk is that substantial weaknesses in a model may remain unidentified.
4.5.4. Key person dependencies, especially if adequate technical and user model documentation are lacking, is a related source of risk.
4.5.5. The lack of opportunities to challenge and discuss a model’s structure, assumptions and output, can also prevent the building of confidence in the model. Model users oftenfind it hard to trust the output of black boxes. As a result, the lack of wider challenge can lead to a very different type of risk: that a good model is insufficiently deployed and the insights it may provide are passed by.
4.5.6. The above risks can be mitigated by making a model’s methodology and key judgements as transparent as possible–with parallels to good and timely communication and collective account-ability for models and their appropriate use, as described in the NASA satellite example in section 2.1.
4.5.7. In practice, it is not possible to“open”the full model specification for debate–apart from constraints on people’s time, some aspects may be too technical and others too uncontroversial to merit wider challenge. Therefore, it is important to decide what are the key judgements that need wider discussion. The Model Risk Triage discussed in section 4.6 can be a useful tool for that purpose.
4.5.8.Social pressures: Another issue arises when arguments highlighting theflaws or limitations of a model are not welcome within the organisation. For example, if regulatory approval of a model has substantial economic implications, arguments that may be seen to undermine the chances of such approval may be seen as damaging to the company’s interests.
4.5.9. Technical experts can experience conflicting incentives. On the one hand, in-depth under-standing of their models means that they can be the people most capable of identifying limitations. On the other hand, technical experts often play a leading role in championing model use within their organisations. This means that technical experts may have an incentive to self-censor when com-municating limitations of a model.
aid of actuarial models, routinely informs decisions. But there is typically no process for translating insights about the impact of uncertainty on model outputs into meaningful action.
4.5.11. Social pressures also manifest themselves in problems of group-think and herding. Most actuaries and other finance professionals follow very similar education and training paths. Furthermore, the dissemination of“best practices”, through formal and informal channels, means that the ways of approaching modelling problems can be very similar across professionals and companies.
4.5.12. This is compounded by the use of proprietary models, such as catastrophe models, ESGs, or investment portfolio risk models, and perceived external pressures towards conformity of modelling approaches across the market. The strength of this perception manifests itself in the marketing materials of model vendors. For example, a promotional brochure for Moody’s ESG contains the quotation:“If an insurer tells its regulator that it’s using the [Moody’s] ESG, that would probably mean only one meeting. If the insurer says that it’s going for a less widely used ESG that might mean seven meetings”(Moody’s Analytics, 2014).
4.5.13. There are systemic risk implications to the social pressures discussed above. First, if technical experts are wrong about a particular modelling aspect, they are likely to be wrong in the same way. Second, coordinated behaviour across the market, facilitated by the use of similar models can have an impact on market conditions and structure. Thus, the act of measuring risk changes the very nature of the risk being measured: systemic risk arisesendogenously(Danielsson & Shin, 2003).
4.5.14. It is not easy to mitigate such risks. At the organisational level, we would expect documented evidence of peer review of key judgements and methodology–with challenge–to be evidenced on a rolling basis, for example, by realising the independent review framework described in section 4.4. The broader challenge, not specific to model risk management, is to maintain a culture that encourages the expression of substantiated dissent and does not seek to suppress discomfiting views.
4.5.15. Addressing model risk at a market level is even harder and certainly beyond the reach of any individual company. We would hope that key stakeholders, such as regulators, do not provide incentives for further homogenisation of modelling approaches across the market.
4.5.16.Balancing model change and innovation: Insurance processes have to a great degree changed to meet Solvency II reporting timescales. This has also affected the modelling development lifecycle. To meet more rigourous control standards, models can now only be changed following an agreed and resourced development pipeline.
4.5.17. This sometimes conflicts with the urge of well-meaning developers, who, brought up in a culture of “Agile” development, might be tempted to proceed with what they see as small but necessary changes (“fixing a bug”), without going through a formal process. More broadly, the need to follow time-consuming processes for approving and reporting model changes can lead to disincentives for model improvement.
4.6. Model Risk Assessment/Quantification
4.6.1. The model risk management effort should be proportionate to the risk a model poses. It is easy to warn against under-investment in model risk management, leaving afirm exposed to the risk of
financial and reputational losses; on the flip side, it is also possible to over-invest in model risk controls, with benefits, in terms of reducing model risk, that are limited and/or hard to measure.
4.6.2. The aim of triage is to assess/quantify the risk associated with models, as well as material components of those models.
4.6.3. The materiality of model risk is a function of the uncertainty in the model (i.e. likelihood of error) and the resulting monetary/reputational impact (i.e. severity). Materiality can be assessed with various degrees of accuracy and effort depending on the level of data available. It is worth bearing in mind that part of the purpose of triage is to reduce the amount of effort for the less material models. Typical data sources are:
∙
Meta data–model attributes that are known before the model is run (e.g. purpose, methodology, number of developers, etc.);∙
Scheduled run data–information from model runs already executed for a purpose different to model risk management; and∙
Test run data–information from model runs executed specifically for the purpose of model risk management.Meta data Scheduled
run data Test run data
Increased triage accuracy but increased effort
4.6.4.Meta data: In terms of availability and effort required, model meta data provide a reasonably straightforward way to determine the risk associated with a model. These model attributes should usually be accessible and should be stored as part of the central model inventory.
4.6.5. Good meta data act as proxies to the likelihood of model error. A non-exhaustive list of examples, categorised under each stage in a model lifecycle, is provided in Table 2.
4.6.6. Each attribute and/or a combination of attributes can be scored based on pre-defined rules. An extreme example of a“High” control level model would be one that uses“cutting-edge” metho-dology and has only one in-house developer. The rules should ensure that the number of models in each control level classification is appropriate and aligns to available resource.
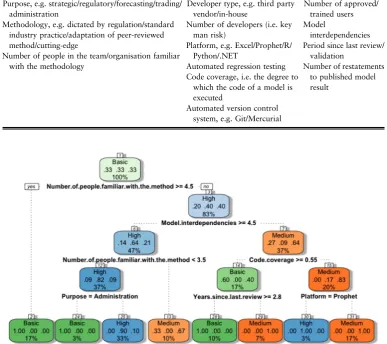
4.6.7. If a sizeable inventory of manually classified models (based on expert judgement) is available, supervised machine learning technique(s) can be used to formalise and/or check the classification rules. An illustrative classification (“High”, “Medium”, “Basic”) flowchart generated using the “Decision Tree”method is provided in Figure 3. Once trained and validated,1such a model can automate the classification of new or other models in the inventory.
4.6.8.Scheduled run data: Scheduled run data comes from model information available for a pur-pose different to model risk management, such as a business application. This typically includes
1
input data and output data, perhaps under a variety of scenarios. Scheduled run data should be easy to access but it is not usually stored within the model inventory.
4.6.9. The periodical analysis of change carried out to attribute the movement in published income or balance sheet items (e.g. European Embedded Value, Solvency Capital Requirement (SCR), etc.) is an obvious source of scheduled run data. Movements due to“model restatements”or“out-of-model adjustments”would provide a monetary amount to quantify the materiality of model risk. A risk level classification can then be assigned based on pre-defined thresholds.
4.6.10. Quantitative triage techniques that rely only on other scheduled run data include:
∙
back-testing; and [image:23.493.59.448.75.235.2]∙
reverse sensitivity testingTable 2. Meta Data as a Proxy for Likelihood of Model Error.
Design Stage Development Stage Deployment Stage
Purpose, e.g. strategic/regulatory/forecasting/trading/ administration
Methodology, e.g. dictated by regulation/standard industry practice/adaptation of peer-reviewed method/cutting-edge
Number of people in the team/organisation familiar with the methodology
Developer type, e.g. third party vendor/in-house
Number of developers (i.e. key man risk)
Platform, e.g. Excel/Prophet/R/ Python/.NET
Automated regression testing Code coverage, i.e. the degree to
which the code of a model is executed
Automated version control system, e.g. Git/Mercurial
Number of approved/ trained users Model
interdependencies Period since last review/
validation
Number of restatements to published model result
[image:23.493.60.448.99.443.2]4.6.11.Back-testing: In the context of predictive/forecast models, model output can be compared to the actual historical outcome; the divergence between the two provides an estimate of the likelihood of model error.
4.6.12. However, it should be noted that the past may not be representative of the future especially if the model is concerned with rare events. To complement the back-testing result, the model could be calibrated and tested against artificial data generated by known processes (see section 4.6.30 for “Ersatz model test”).
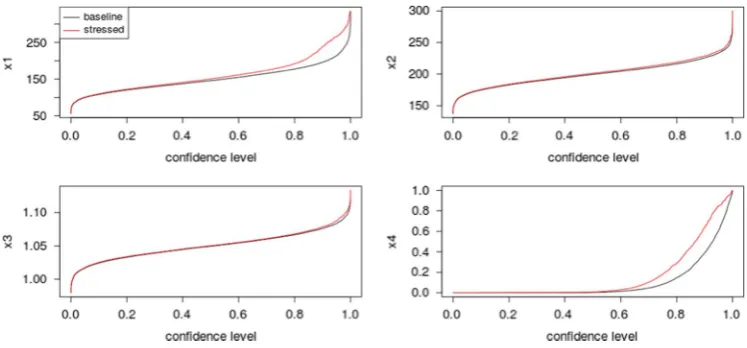
4.6.13. Reverse sensitivity testing: In models that use Monte-Carlo simulation, pseudo-random scenarios are generated from a number of risk factors and are subsequently fed into an aggregation function that may represent, for example, a portfolio structure. The output of the aggregation function consists of a large number of random scenarios pertaining to a variable of interest, for example, Net Asset Value. Repeated evaluations of the aggregation function for each scenario can be computationally expensive, which is the reason behind the long runtimes of Monte-Carlo models such as ones used in some SCR calculations.
4.6.14. The reverse sensitivity testing method (Pesenti et al., 2017) employs ideas from importance sampling, to re-weight scenarios in order to stress the distribution of inputs or outputs. Such re-weighting allows the exploration of the alternative model specifications from a scheduled model run, without the need to generate new scenarios and evaluate the aggregation function again.
4.6.15. As an example, consider a simplified insurance risk model with four input risk factors (X1, X2, X3 and X4). A re-weighting scheme is devised such that the 90%-value at risk of the output is scaled up by 20%. Distributions derived with those weights correspond to a stressed model. Figure 4 shows the percentile functions of the four risk factors, according to the baseline model (in black) and the stressed model (in red).2
4.6.16. Where there is a substantial difference between the input distributions under the baseline and stressed models (as is the case here for thefirst and fourth risk factors), a high sensitivity to inputs is indicated. When there is also uncertainty around the distribution of those same inputs, a cause for concern can beflagged. By using statistical deviation measures to quantify such differences between distributions, the numbers offlags raised for a particular model can be used as a metric for model risk management.
4.6.17.Test run data: Test run data is model information created specifically for the purpose of model risk management. This data should be available as part of model implementation and testing.
4.6.18. Sensitivity tests requiring test runs are typically performed by varying a particular aspect of the model and analysing the resulting change in model output. Without employing more advanced methods, each sensitivity test requires a separate model test run. Sensitivity tests may be derived from varying estimated model parameters or changes in methodology.
4.6.19. Sensitivity to estimated parameters can provide a measure of the potential impact of statistical uncertainty on the model output. If changes in a parameter, for example, a volatility or a
2 An interactive application demonstrating this example can be found at https://tsanak.shinyapps.io/
correlation coefficient, lead to substantial changes in output and if, additionally, the parameter is subject to high estimation error, then an area of model risk is indicated.
4.6.20. In practice, there are several challenges with the above approach:
∙
First, one needs to decide the extent to which parameters should be changed in sensitivity tests. This should reflect statistical uncertainty, for example, by setting parameters to their confidence limits.∙
Second, one has to decide whether parameters will be varied one at a time or all at once. The latter approach may be too conservative, but reflects situations where parameters are set using consistent expert judgements.∙
Third, it remains a challenge to derive clear conclusions from the data that such exercises produce. For example, many insurers observe that increasing correlations between risk factors can lead to large changes in SCR. This observation on its own does not indicate a meaningful course of model risk mitigation.4.6.21. Where alternative methodological choices to those employed in a model are plausible, the impact of method changes on model outputs can also be tested. In some cases that is relatively straightforward to implement, for example, when changing the family of distribution for a risk factor (e.g. from Gamma to LogNormal). However, other methodological changes (e.g. a change in dependence structure or valuation method) are too time-consuming to implement for test purposes. One needs to remain mindful that the methodological choices made are often subject to contingent factors such as modelling legacy or software capabilities.
4.6.22.Types of error to test: When attempting to classify models according to their risks, it must be recognised that an attempt at modelling could fail for several different classes of reasons. A model could be rated as high risk at the triage stage for several different reasons.
[image:25.493.67.441.57.231.2]4.6.23. Conceptually, the simplest type of model errors are the typographical errors, programming bugs or formula mistakes which should, in principle, be detectable by expert inspection of a model’s internal formulas. We refer to these human errors as blunders.
4.6.24. Next to these errors are those arising from various forms of statistical uncertainty. These include uncertainties in models and parameters because of data being limited. An example of this is the peso effect (which actuaries sometimes call Events not in Data), where a rare event such as peso devaluation is over-represented if it occurs in the analysed data and under-represented if it does not.
4.6.25. There are also errors associated with broader, non-statistical uncertainties, such as whether the data are accurate, whether favourable points have been cherry picked or arbitrary points have been censored.
4.6.26. A further source of errors can arise when some problem aspects are not captured either in the
fitted model or in the reference model. For example, financial models may treat market prices as statistical processes unaffected by the decisions to be taken, when in reality afirm’s decision to buy or sell an asset might change the market price of that asset. Behaviour of customers or competitors may be described statistically when in fact a part of those behaviours is a response to afirm’s own strategy. Part of model triage should then consider whether a model has overlooked material feedback loops.
4.6.27.Ersatz Model tests: The idea of model triage is to classify models according to their level of risk while controlling the cost of performing the classification. Subsequent review and validation are then more intensive but applied only to the depth required by the triage stage.
4.6.28. As technology and model governance processes continue to develop, firms are able to automate more of what is currently classified as validation and review. This reduces the cost of those activities, potentially allowing some of them to fall in future within the triage stage.
4.6.29. The automation of model runs potentially allows models to be tested not just on data stressed in one direction, but rather on large numbers of randomly generated data sets. On each of those randomly generated datasets, model parameters are estimated and, subsequently, model outputs are evaluated. For this to work, the precise data input format needs to be specified, and also a reference method for generating the random data. The Ersatz test measures how well the model output replicates the reference process that generated the data, in a suitably defined average sense across multiple simulated data sets.
4.6.30. Ersatz tests are a straightforward way for detecting material model blunders. A model based on a stated set of assumptions should at least perform according to its specification if the reference method produces data confirming to those assumptions. Where even those tests fails, a logical or programming error is the likely culprit.
4.6.31. Ersatz tests can also give valuable insights into model limitations. They can highlight the characteristics of reference data sets which the model does and does not capture. Ersatz tests can also reveal the amount of statistical variability that can be expected in model output as a consequence of thefiniteness of data. The materiality of both these sources of uncertainty can be factored into a triage process.