Global Matrix 3.0 Physical Activity Report Card Grades for
Children and Youth: Results and Analysis From 49 Countries
Salomé Aubert, Joel D. Barnes, Chalchisa Abdeta, Patrick Abi Nader, Ade F. Adeniyi, Nicolas Aguilar-Farias, Dolores S. Andrade Tenesaca, Jasmin Bhawra, Javier Brazo-Sayavera, Greet Cardon, Chen-Kang Chang, Christine Delisle Nyström, Yolanda Demetriou, Catherine E. Draper, Lowri Edwards, Arunas Emeljanovas, AlešGába, Karla I. Galaviz, Silvia A. González, Marianella Herrera-Cuenca, Wendy Y. Huang, Izzeldin A.E. Ibrahim, Jaak Jürimäe, Katariina Kämppi, Tarun R. Katapally, Piyawat Katewongsa, Peter T. Katzmarzyk, Asaduzzaman Khan, Agata Korcz, Yeon Soo Kim, Estelle Lambert, Eun-Young Lee, Marie Löf, Tom Loney, Juan Lo´pez-Taylor, Yang Liu,
Daga Makaza, Taru Manyanga, Bilyana Mileva, Shawnda A. Morrison, Jorge Mota, Vida K. Nyawornota, Reginald Ocansey, John J. Reilly, Blanca Roman-Vinas, Diego Augusto Santos˜ Silva, Pairoj Saonuam, John Scriven, Jan Seghers, Natasha Schranz, Thomas Skovgaard, Melody
Smith, Martyn Standage, Gregor Starc, Gareth Stratton, Narayan Subedi, Tim Takken, Tuija Tammelin, Chiaki Tanaka, David Thivel, Dawn Tladi, Richard Tyler, Riaz Uddin, Alun Williams,
Stephen H.S. Wong, Ching-Lin Wu, Paweł Zembura, and Mark S. Tremblay
Background: Accumulating sufficient moderate to vigorous physical activity is recognized as a key determinant of physical, physiological, developmental, mental, cognitive, and social health among children and youth (aged 5–17 y). The Global Matrix 3.0 of Report Card grades on physical activity was developed to achieve a better understanding of the global variation in child and youth physical activity and associated supports.Methods: Work groups from 49 countries followed harmonized procedures to develop their Report Cards by grading 10 common indicators using the best available data. The participating countries were divided into 3 categories using the United Nations’human development index (HDI) classification (low or medium, high, and very high HDI).Results: A total of 490 grades, including 369 letter grades and 121 incomplete grades, were assigned by the 49 work groups. Overall, an average grade of“C−,” “D+,”and“C−”was obtained for the low and medium HDI countries, high HDI countries, and very high HDI countries, respectively.Conclusions: The present study provides rich new evidence showing that the situation regarding the physical activity of children and youth is a concern worldwide. Strategic public investments to implement effective interventions to increase physical activity opportunities are needed.
Keywords: global comparison, sedentary behavior, health promotion, international, sport, active transportation
Physical inactivity, defined as engaging in insufficient levels of physical activity and not meeting the current physical activity recommendations,1 has been identified as the fourth leading risk
factor of premature mortality in adulthood.2In contrast, accumu-lating sufficient moderate- to vigorous-intensity physical activity (MVPA) is recognized as a key determinant of physical, mental,
Aubert, Barnes, Delisle Nyström, González, Manyanga, and Tremblay are with Healthy Active Living and Obesity Research Group, CHEO Research Institute, Ottawa, Ontario, Canada. Abdeta is with Hiwot Fana Specialized Hospital, Haramaya University, Harar, Ethiopia. Abi Nader is with the Centre de formation médicale du Nouveau-Brunswick, Université de Moncton, Moncton, New Nouveau-Brunswick, Canada; and Centre de Recherche du Centre Hospitalier de l’Université de Montréal, Montréal, Québec, Canada. Adeniyi is with College of Medicine, University of Ibadan, Ibadan, Nigeria; and Nigerian Heart Foundation, Lagos, Nigeria. Aguilar-Farias is with the Department of Physical Education, Sports and Recreation, Universidad de La Frontera, Temuco, Chile; and UFRO Actívate Research Group, Universidad de La Frontera, Temuco, Chile. Andrade Tenesaca is with the Departamento de Biociencias, Universidad de Cuenca, Cuenca, Ecuador. Bhawra is with the School of Public Health and Health Systems, University of Waterloo, Waterloo, Ontario, Canada. Brazo-Sayavera is with the Instituto Superior de Educacio´n Física, Universidad de la República, Rivera, Uruguay; and the Polos de Desarrollo Universitario EFISAL, Universidad de la República, Rivera, Uruguay. Cardon is with the Department of Movement and Sports Sciences, Ghent University, Ghent, Belgium. Chang is with the Department of Sport Performance, National Taiwan University of Sport, Taichung, Taiwan. Delisle Nyström is also with the Department of Biosciences and Nutrition, Karolinska Institutet, Huddinge, Sweden. Demetriou is with the Department of Sport and Health Sciences, Technical University of Munich, Munich, Germany. Draper is with the University of the Witwatersrand, Johannesburg, South Africa; and the University of Cape Town, Cape Town, South Africa. Edwards, Stratton, and Tyler are with the Applied Sport Technology Exercise and Medicine Research Centre, Swansea University, Swansea, Wales, United Kingdom. Emeljanovas is with Lithuanian Sports University, Kaunas, Lithuania. Gába is with the Faculty of Physical Culture, Palacký University Olomouc, Olomouc, Czech Republic. Galaviz is with Emory Global Diabetes Research Center, Hubert Department of Global Health, Rollins School of Public Health, Emory University, Atlanta, GA, USA. González is also with the School of Medicine, Universidad de los Andes, Bogotá, Colombia. Herrera-Cuenca is with the Centro de Estudios del Desarrollo, Universidad Central de Venezuela, Caracas, Venezuela; Fundacio´n Bengoa para la Alimentacio´n y Nutricio´n, Caracas, Venezuela; and Observatorio Venezolano de la Salud, Caracas, Venezuela. Huang is with the Department of Sport and Physical Education, Hong Kong Baptist University, Hong Kong, China. Ibrahim is with Aspetar Orthopedic and Sports Medicine Hospital, Doha, Qatar. Jürimäe is with the Institute of Sport Sciences and Physiotherapy, Faculty of Medicine, University of Tartu, Tartu, Estonia. Kämppi and Tammelin are with the LIKES Research Centre for Physical Activity and Health, Jyväskylä, Finland. Katapally is with Johnson Shoyama Graduate School of Public Policy, University of Regina, Regina, Saskatchewan, Canada. Katewongsa is with the Institute for Population and Social Research, Mahidol University, Salaya,
S251
Journal of Physical Activity and Health,2018, 15(Suppl 2), S251-S273 https://doi.org/10.1123/jpah.2018-0472
social, and environmental health.3,4 Among children and youth (aged 5–17 y), several systematic reviews have reported physical activity benefits on physical, physiological, developmental, men-tal, cognitive, and social health, as well as academic achievement.5–
10Despite these benefits, it has been estimated that 80% of youth (11–17 y old) worldwide do not reach the minimum recommenda-tion of 60 minutes of MVPA per day.11This is alarming given that physical inactivity among school-aged children and youth has been found to be associated with adverse physical, mental, social, and cognitive health outcomes,5,8,12,13 lower physical fitness,14 and lower physical activity levels in later life.15
To achieve a better understanding of the global variation in child and youth physical activity and its correlates, the Global Matrix of Report Card grades on physical activity was launched for the first time in 2014.16 Physical activity Report Cards were developed based on the Canadian Report Card model,17using a harmonized process for data gathering, assessing, and assigning grades to indicators. For over a decade, the Canadian Report Card has been successful in raising awareness and influencing policies for childhood physical activity promotion. However, these efforts have not yet translated into improving the physical activity levels of Canadian children and youth.18Fifteen countries in 2014 (Global Matrix 1.0) and 38 countries in 2016 (Global Matrix 2.0) developed and launched Report Cards presenting grades for 9 physical activity indicators, allowing for international comparisons and offering insights from global data.16,19Thefirst 2 Global Matrices enabled the identification of several gaps in surveillance and research practice. Also, a paradox of higher physical activity and lower sedentary behavior in countries reporting poorer infrastructure, and lower physical activity and higher sedentary behavior in countries reporting better infrastructure was highlighted.16,19Although par-ticipation in the Global Matrices 1.0 and 2.0 facilitated capacity building, professional networking, research collaborations, and
international comparisons, the Global Matrix framework still needs to be continuously expanded, improved, replicated, and widely disseminated.19
The Global Matrix initiative is led by the Active Healthy Kids Global Alliance (AHKGA), which is an incorporated not-for-profit organization consisting of researchers, health professionals, and stakeholders who collaborate to advance physical activity in children and youth from around the world.20In 2017, the AHKGA invited previous participating countries and called for new coun-tries to register for the Global Matrix 3.0. As a result, work groups from 49 countries completed the full registration process and followed the harmonized procedures to develop their Report Cards by grading 10 common indicators (Overall Physical Activity, Organized Sport and Physical Activity, Active Play, Active Trans-portation, Sedentary Behaviors, Physical Fitness, Family and Peers, School, Community and Environment, and Government) using the best available data.
Countries in different development stages may have different challenges and priorities to inform strategies to improve physical activity among children and youth. Countries involved in the Global Matrix 3.0 were classified within 3 categories using the human development index (HDI): low and medium HDI (<0.70), high HDI (≥0.70 to<0.80), and very high HDI (≥0.80). The HDI, ranging from 0 to 1, is a composite index calculated using data on education, life expectancy, and income per capita,21 and was created by the United Nations Development Programme to rank countries on a scale of human development conceptualized in terms of capabilities of humans within the countries to function.22Nine of the participating countries were classified as low or medium HDI (Bangladesh, Botswana, Ethiopia, Ghana, India, Nepal, Nigeria, South Africa, and Zimbabwe), 10 as high HDI (Brazil, Bulgaria, China, Colombia, Ecuador, Lebanon, Mexico, Thailand, Uruguay, and Venezuela), and 30 countries and territories as very high HDI
Phutthamonthon, Nakhon Pathom, Thailand. Katzmarzyk is with Pennington Biomedical Research Center, Baton Rouge, LA, USA. Khan and Uddin are with the School of Health and Rehabilitation Sciences, The University of Queensland, St Lucia, QLD, Australia. Korcz is with the Department of Didactics of Physical Activity, Poznan´ University of Physical Education, Poznan´, Poland. Kim is with the Department of Physical Education, Seoul National University, Seoul, Republic of Korea; and the Institute of Sports Science, Seoul National University, Seoul, Republic of Korea. Lambert is with the Faculty of Health Sciences, University of Cape Town, Cape Town, South Africa. Lee is with the School of Kinesiology and Health Studies, Queen’s University, Kingston, Ontario, Canada. Löf is with the Department of Biosciences and Nutrition, Karolinska Institutet, Group MLÖ, Huddinge, Sweden; and the Department of Medicine and Health, Linköping University, Linköping, Sweden. Loney is with the College of Medicine, Mohammed Bin Rashid University of Medicine and Health Sciences, Dubai, United Arab Emirates. Lo´pez-Taylor is with the Instituto de Ciencias Aplicadas a la Actividad Física y Deporte, Centro Universitario de Ciencias de la Salud, Universidad de Guadalajara, Guadalajara, Mexico. Liu is with the School of Physical Education and Sport Training, Shanghai University of Sport, Shanghai, China; and the Shanghai Research Center for Physical Fitness and Health of Children and Adolescents, Shanghai University of Sport, Shanghai, China. Makaza is with the National University of Science and Technology, Bulawayo, Zimbabwe. Mileva is with BG be Active Association, Plovdiv, Bulgaria. Morrison is with the Faculty of Health Sciences, University of Primorska, Izola, Slovenia. Mota is with the Centro de Investigação em Atividade Física, Saúde e Lazer (CIAFEL-FADEUP), University of Porto, Porto, Portugal. Nyawornota is with the School of Education and Leadership, University of Ghana, Accra, Ghana. Ocansey is with the University of Ghana, Accra, Ghana. Reilly is with the Physical Activity for Health Group, University of Strathclyde, Glasgow, Scotland. Roman-Vinas is˜ with the Nutrition Research Foundation, Barcelona, Spain; the School of Health and Sport Sciences (EUSES), Universitat de Girona, Salt, Spain; and the CIBER Physiopathology of Obesity and Nutrition (CIBEROBN), Instituto de Salud Carlos III, Madrid, Spain. Silva is with the Research Center of Kinanthropometry and Human Performance, Federal University of Santa Catarina, Florianopolis, Santa Catarina, Brazil. Saonuam is with the Promotion of Healthy Lifestyle Section, Thai Health Promotion Foundation (ThaiHealth), Bangkok, Thailand. Scriven is with Jersey Sport Foundation, Jersey, Channel Islands, United Kingdom. Seghers is with the Department of Movement Sciences, KU Leuven, Leuven, Belgium. Schranz is with the Alliance for Research in Exercise, Nutrition and Activity, School of Health Sciences, University of South Australia, Adelaide, South Australia, Australia. Skovgaard is with the Research and Innovation Centre for Human Movement and Learning and Research Unit for Active Living, Department of Sports Science and Clinical Biomechanics, University of Southern Denmark, Odense, Denmark. Smith is with the School of Nursing, The University of Auckland, Auckland, New Zealand. Standage is with the Department for Health, Centre for Motivation and Health Behaviour Change, University of Bath, Bath, United Kingdom. Starc is with the Faculty of Sport, University of Ljubljana, Ljubljana, Slovenia. Subedi is with Maharajgunj Medical Campus, Institute of Medicine, Tribhuvan University, Maharajgunj, Nepal. Takken is with Wilhelmina Children’s Hospital, University Medical Center Utrecht, Utrecht, The Netherlands. Tanaka is with the Division of Integrated Sciences, J. F. Oberlin University, Machida, Japan. Thivel is with the Laboratory of Metabolic Adaptations to Exercise Under Physiological and Pathological Conditions (AME2P), Research Center for Human Nutrition (CRNH Auvergne), Université Clermont Auvergne, Clermont-Ferrand, France. Tladi is with the Department of Physical Education, Health and Recreation, University of Botswana, Gaborone, Botswana. Uddin is also with the Department of Pharmacy, Stamford University Bangladesh, Dhaka, Bangladesh. Williams is with Guernsey Education Services, Sir Charles Froissard House, St Peter Port, Guernsey. Wong is with the Department of Sports Science and Physical Education, The Chinese University of Hong Kong, Hong Kong, China. Wu is with the Graduate Institute of Sports and Health Management, National Chung Hsing University, Taichung, Taiwan. Zembura is with the Robert B. Zajonc Institute of Social Science, Social Challenges Unit, University of Warsaw, Warsaw, Poland. Tremblay ([email protected]) is corresponding author.
JPAH 15 Supplement 2, 2018
S252 Aubert et al
(Australia, Belgium [Flanders], Canada, Chile, Chinese Taipei [Taiwan], Czech Republic, Denmark, England, Estonia, Finland, France, Germany, Guernsey, Hong Kong, Japan, Jersey, Lithuania, The Netherlands, New Zealand, Poland, Portugal, Qatar, Scotland, Slovenia, South Korea, Spain, Sweden, United Arab Emirates, United States, and Wales).
This special issue of the Journal of Physical Activity and Health includes 49 extended abstracts documenting the main Report Cardfindings from each participating country. In addition to this current paper, 3 papers were developed to present and discuss results from the Report Cards by predetermined HDI categories as follows:
—“The Indicators of Physical Activity among Children and Youth in Nine Countries with Low and Medium Human Development Indices: A Global Matrix 3.0 Paper”23; —“Report Card Grades on the Physical Activity of Children and
Youth from 10 Countries with High Human Development Index—Global Matrix 3.0”24;
—“Report Card Grades on the Physical Activity of Children and Youth Comparing 30 Very High Human Development Index Countries.”25
The aim of this integrated article is to combine and compare thefindings from each of the HDI (low and medium, high, and very high) papers and present, compare, and discuss further analyses of the results from the 49 countries participating in the Global Matrix 3.0.
Methods
Creating the Global Matrix 3.0
In April 2017, the AHKGA invited interested countries to partici-pate in and register for the Global Matrix 3.0 through an open call that was distributed via established networks. Between April 2017 and January 2018, 49 countries from 6 different continents (Africa, Asia, Europe, North America, Oceania, and South America) registered and paid a registration fee based on their HDI classifi -cation to cover costs associated with the Global Matrix 3.0 initia-tive. Three different tiers of registration fees ($500 USD for the low HDI countries, $750 USD for the medium HDI countries, $1000 USD for the high HDI countries, and $1500 USD for the very high HDI countries) were offered to encourage equitable participation from around the world. Individuals who registered on behalf of their country were responsible for leading the effort to form a multidisciplinary Report Card work group of national physical activity experts and stakeholders. Furthermore, 1 to 3 Report Card leaders/coleaders per country were designated officially to manage the national Report Card development, and to ensure effective communication between the AHKGA Executive Committee and the Report Card work group.
A mentoring system was developed for the Global Matrix 3.0. New Report Card leaders and teams were paired with an experi-enced Report Card leader from a country who participated in the Global Matrix 2.0. In addition, 6 members of the Executive Committee of AHKGA were assigned to be regional mentors for each involved continent to provide help and guidance to the countries when needed and report their progress to the AHKGA Executive Committee. Finally, the AHKGA Executive Committee served as the coordinating center of the Global Matrix development and provided information including back-ground papers, previous Report Cards and Report Card papers,
fundraising suggestions, and a theoretical framework to support the preparation of grant proposals, scholarship, and funding applica-tions. The AHKGA Executive Committee also provided guidance through monthly e-blasts by sharing milestones and upcoming deadlines.
Harmonized Report Card Development
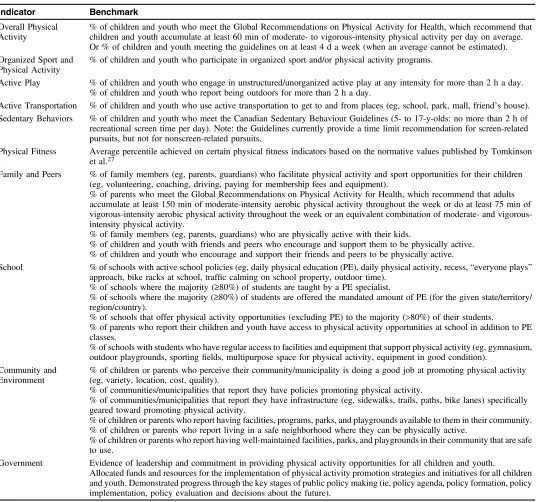
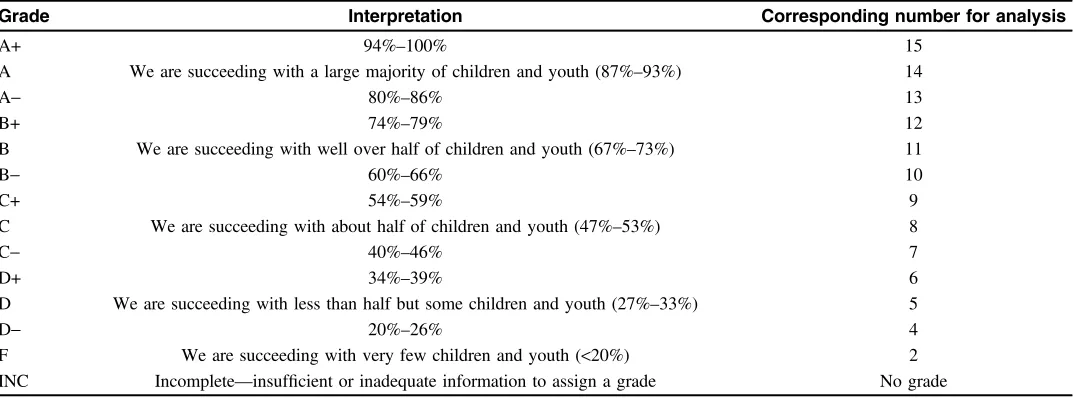
An updated list of indicators (to which grades would be assigned) and corresponding benchmarks were created based on the previ-ous Global Matrix methods,19 and feedback received during a workshop after the Global Matrix 2.0 launch in Bangkok, Thai-land (November, 2016). A new indicator, Physical Fitness, and its corresponding benchmarks were added to the list. The benchmark for Overall Physical Activity was modified in accordance with the new Canadian 24-Hour Movement Guidelines for Children and Youth,26 where “at least 60 minutes of MVPA per day” was changed to“at least 60 minutes of MVPA per dayon average.” Further modifications to the benchmarks were made during the development of the Global Matrix 3.0 to address several issues that were reported by Report Card leaders to the AHKGA Executive Committee. Thefinal version of the benchmarks for the 10 indicators is presented in Table1. A more detailed grading scheme using positive (+) and negative (−) mathematical symbols was also developed (Table2). In some countries, because of the modifications of the benchmarks from previous Global Matrices, grades for some indicators have changed while in fact, the situation was relatively the same. Consequently, while the Report Card work groups reported grades based on the revised bench-marks for the Global Matrix 3.0, some countries reported different grades in their national Report Grades (ie, to be consistent with their previous methods). For example, in Colombia, with the new benchmark, a “D+” was assigned to Overall Physical Activity for the Global Matrix 3.0, whereas a“D−”is reported in the Colombian country Report Card, based on the previous benchmark.28
Each country work group identified and complemented the list of indicators to be graded (ie, the 10 common indicators and potentially additional ones that would be included in their national Report Card but not in the Global Matrix 3.0) and gathered the highest quality of published and unpublished evi-dence, or in some cases, collected data prospectively. Due to the lack of data concerning physical activity among children in the early years (0–4 y) observed in the previous Global Matrices, consensus was reached among the AHKGA Executive Committee that the 10 indicator grades should only be informed by data from school-aged children and youth (∼5–17 y old) for the Global Matrix 3.0 to ensure consistency across countries. Where possi-ble, countries were also advised to consider and synthesize the best available evidence from approximately the past 5 years for each indicator. Through a harmonized and transparent Report Card development process, each country’s work group collected and collated the best available evidence from local, national, or international studies, national surveys, official reports, and nor-mative documents, and then synthesized findings and reached consensus for the grading of each indicator. A draft of each country Report Card grades were submitted along with their rationale by Report Card leaders and were audited by members of the AHKGA Executive Committee to ensure that the grades were consistent with the harmonized benchmarks and grading scheme. This audit process led to minor changes of the grades or rationale for most of the countries.
JPAH 15 Supplement 2, 2018
Global Matrix 3.0 Physical Activity Report Card Grades S253
Data Analysis
For analysis purposes, the 49 participating countries and regions were divided into 3 categories using the United Nations’ HDI classification (low or medium, high, and very high HDI) described above. Sociodemographic data that are available online were compiled to identify the characteristics of the participating coun-tries. Descriptive statistics (average grade and standard deviation) were calculated after converting categorical variables (letter grades) to interval variables (see corresponding numbers in Table 2), and the incomplete (INC) grades were converted into null values, which were treated as missing values. Averages were calculated by country, indicator, and category of HDI from the
[image:4.612.41.581.77.579.2]interval values, and the floor (the number rounded down) was converted back to a letter grade. Three scores were generated for the analysis: (1) overall score computed as the sum of interval values for all indicators, (2) behavioral score (the sum of Overall Physical Activity, Organized Sport and Physical Activity, Active Play, Active Transportation, and Sedentary Behaviors interval values), and (3) sources of influence score (the sum of Family and Peers, School, Community and Environment, and Government interval values).“INC”grades were removed, and the scores were reweighted accordingly (ie, the missing grade was replaced by the sum of the interval values divided by the number of letter grades included in the score). Categorical variables (letter grades) were grouped into 4 (“A–B,” “C,” “D–F,”and“No Grade”) based on the
Table 1 Global Matrix 3.0 Indicators and Benchmarks Used to Guide the Grade Assignment Process
Indicator Benchmark
Overall Physical Activity
% of children and youth who meet the Global Recommendations on Physical Activity for Health, which recommend that children and youth accumulate at least 60 min of moderate- to vigorous-intensity physical activity per day on average. Or % of children and youth meeting the guidelines on at least 4 d a week (when an average cannot be estimated). Organized Sport and
Physical Activity
% of children and youth who participate in organized sport and/or physical activity programs.
Active Play % of children and youth who engage in unstructured/unorganized active play at any intensity for more than 2 h a day.
% of children and youth who report being outdoors for more than 2 h a day.
Active Transportation % of children and youth who use active transportation to get to and from places (eg, school, park, mall, friend’s house).
Sedentary Behaviors % of children and youth who meet the Canadian Sedentary Behaviour Guidelines (5- to 17-y-olds: no more than 2 h of
recreational screen time per day). Note: the Guidelines currently provide a time limit recommendation for screen-related pursuits, but not for nonscreen-related pursuits.
Physical Fitness Average percentile achieved on certain physicalfitness indicators based on the normative values published by Tomkinson
et al.27
Family and Peers % of family members (eg, parents, guardians) who facilitate physical activity and sport opportunities for their children
(eg, volunteering, coaching, driving, paying for membership fees and equipment).
% of parents who meet the Global Recommendations on Physical Activity for Health, which recommend that adults accumulate at least 150 min of moderate-intensity aerobic physical activity throughout the week or do at least 75 min of intensity aerobic physical activity throughout the week or an equivalent combination of moderate- and vigorous-intensity physical activity.
% of family members (eg, parents, guardians) who are physically active with their kids.
% of children and youth with friends and peers who encourage and support them to be physically active. % of children and youth who encourage and support their friends and peers to be physically active.
School % of schools with active school policies (eg, daily physical education (PE), daily physical activity, recess,“everyone plays”
approach, bike racks at school, traffic calming on school property, outdoor time).
% of schools where the majority (≥80%) of students are taught by a PE specialist.
% of schools where the majority (≥80%) of students are offered the mandated amount of PE (for the given state/territory/
region/country).
% of schools that offer physical activity opportunities (excluding PE) to the majority (>80%) of their students.
% of parents who report their children and youth have access to physical activity opportunities at school in addition to PE classes.
% of schools with students who have regular access to facilities and equipment that support physical activity (eg, gymnasium,
outdoor playgrounds, sportingfields, multipurpose space for physical activity, equipment in good condition).
Community and Environment
% of children or parents who perceive their community/municipality is doing a good job at promoting physical activity (eg, variety, location, cost, quality).
% of communities/municipalities that report they have policies promoting physical activity.
% of communities/municipalities that report they have infrastructure (eg, sidewalks, trails, paths, bike lanes) specifically
geared toward promoting physical activity.
% of children or parents who report having facilities, programs, parks, and playgrounds available to them in their community. % of children or parents who report living in a safe neighborhood where they can be physically active.
% of children or parents who report having well-maintained facilities, parks, and playgrounds in their community that are safe to use.
Government Evidence of leadership and commitment in providing physical activity opportunities for all children and youth.
Allocated funds and resources for the implementation of physical activity promotion strategies and initiatives for all children and youth. Demonstrated progress through the key stages of public policy making (ie, policy agenda, policy formation, policy implementation, policy evaluation and decisions about the future).
JPAH 15 Supplement 2, 2018
S254 Aubert et al
overall score. These categories were then used to rank countries by the letter grade/score and category level in scatter plots. Correla-tional analyses between the 10 common indicators and socio-demographic indicators were performed using Spearman’s rank correlation coefficients. Only significant moderate to strong corre-lations were considered for the discussion in this analysis (r≥.30 or r≤ −.30,P<.05).29Pairwise deletion was used to treat missing data (INC grades) in order to minimize the number of cases excluded from the analysis. All statistical analyses were performed, and maps were created in R version 3.4.1 (The R Foundation for Statistical Computing, Vienna, Austria). Several packages were loaded to extend base R including corrplot,30ggplot2,31UpSetR,32 and VIM.33
Results
A total of 52 countries responded to the AHKGA and showed interest in participation in the Global Matrix 3.0, but only 51 fully registered on time, and later on 2 countries withdrew. Sociodemo-graphic characteristics of the 49 countries participating in the Global Matrix 3.0 are presented in Table3. The HDI scores ranged from 0.448 (Ethiopia) to 0.985 (Jersey). Ethiopia also scored the lowest for the following: growth national income per capita ($1523 USD), mean years of schooling (2.6 y), global food security index (33.3), urban population percentage (17.2%), and prevalence of people using improved drinking water sources (44%). Qatar scored highest in the growth national income per capita ($129,916 USD) and the gender inequality index (0.542). Public health expenditure in percentage of Gross Domestic Product was the highest in Sweden (10.0%) and the lowest in Venezuela (1.5%). Life expec-tancy at birth ranged from 53.1 years in Nigeria to 84.2 years in Hong Kong. Hong Kong also had the highest urban population percentage (100%) and the highest population density (6987 peo-ple/km2 of land area). The lowest Gini index (least income inequality) was observed in Slovenia (25.4) and the highest (great-est income inequality) in Botswana (60.5).
The physical activity grades for the 10 common indicators are organized by country in alphabetical order (Table4). A total of 490 grades, including 369 letter grades and 121“INC”grades, were assigned by the 49 Report Card work groups. A“not applicable”
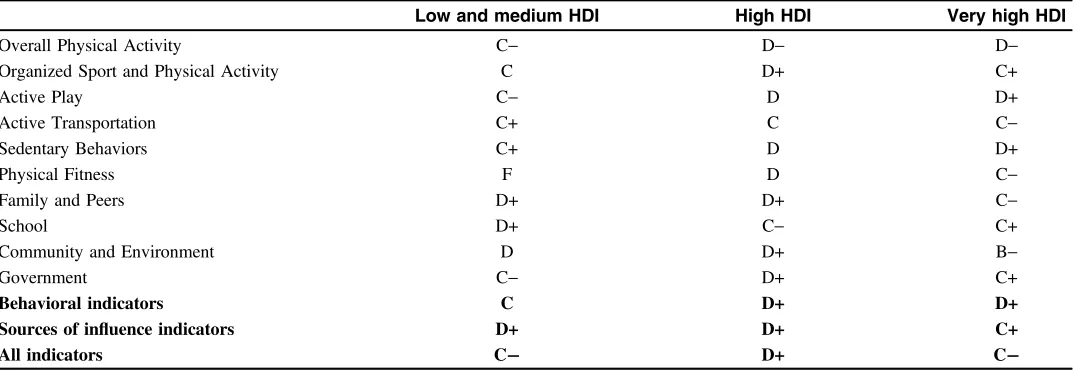
grade was assigned to Active Transportation by Qatar’s Report Card work group because of unsafe road conditions and a hot climate during most of the year.45 The grade count, number of “INC”grades, mean number grade, SD, and mean letter grade by indicator and group of indicators are presented in Table 5. The indicators with the lowest number of “INC”grades were Overall Physical Activity and Active Transportation (n = 2), whereas the indicator with the highest number of“INC”grades was Active Play (n = 29), followed by Physical Fitness (n = 27), and Family and Peers (n = 22). The mean letter grades ranged from“D”for Overall Physical Activity to“C”for Organized Sport and Physical Activity, Active Transportation, School, Community and Environment, and Government. An average grade of “C−” was obtained for the behavioral indicators, “C”for the sources of influence indicators, and“C−”was the overall average grade for the 369 letter grades. The average letter grades by indicator and group of indicators for the low or medium, high, and very high HDI countries are presented in Table6. For the low or medium HDI countries, an average of“C”was obtained for the behavioral indicators and“D+” for the source of influence indicators, whereas for the very high HDI countries, an average of“D+”was obtained for the behavioral indicators and“C+”for the sources of influence indicators. For the high HDI countries, an average of “D+” was obtained for the behavioral indicators and for the sources of influence indicators. Overall, an average grade of“C−,” “D+,”and“C−”was obtained for the low and medium HDI countries, high HDI countries, and very high HDI countries, respectively.
[image:5.612.40.577.81.280.2]A plot for the estimated overall score of each country from the 10 indicators is presented in Figure 1, and the behavioral and sources of influence scores are shown in Figures2and3, respec-tively. Slovenia ranked first, whereas China ranked 49th for the overall score (full rankings are shown in Figure1); Nepal ranked first, and Estonia ranked last for the behavioral score (complete rankings are shown in Figure2); and Slovenia rankedfirst, whereas Venezuela ranked last for the source of influence score (see all country rankings in Figure 3). The Supplementary Material 1 (available online) presents the correlation coefficients and their associated P values between and within the 10 core physical activity indicators and the sociodemographic indicators. It showed that there were no statistically significant relationships between the
Table 2 Global Matrix 3.0 Grading Rubric
Grade Interpretation Corresponding number for analysis
A+ 94%–100% 15
A We are succeeding with a large majority of children and youth (87%–93%) 14
A− 80%–86% 13
B+ 74%–79% 12
B We are succeeding with well over half of children and youth (67%–73%) 11
B− 60%–66% 10
C+ 54%–59% 9
C We are succeeding with about half of children and youth (47%–53%) 8
C− 40%–46% 7
D+ 34%–39% 6
D We are succeeding with less than half but some children and youth (27%–33%) 5
D− 20%–26% 4
F We are succeeding with very few children and youth (<20%) 2
INC Incomplete—insufficient or inadequate information to assign a grade No grade
JPAH 15 Supplement 2, 2018
Global Matrix 3.0 Physical Activity Report Card Grades S255
Table 3 Sociodemographic Information of the 49 Countries in the Global Matrix 3.0 Co untry (in alpha betical ord er) HDI a GNI per capita, a USD Public health expenditure (% of GDP) a GII a Life expectancy at bir th, a y Mean years of scho oling, a y Gini index b
Global food security index
c Urban population perce ntage d Improved drinking water coverage, d % Popula tion density (people/km 2 of land area) e
Summer Olympic med
al count f Distance to the equa tor, g km Australia 0.939 42,822 6.3 0.12 82.5 13.2 34.7 83.3 89.4 100 3 497 2796 Bang ladesh 0.579 334 1 3.7 0.52 72 5.2 32.4 39.7 28.9 81 1252 0 2620 Belgium (Flanders) 0.896 41,243 8.3 0.073 81 11.4 27.7 79.8 97.5 100 374 148 5597 Botswana 0.698 14,663 5.1 0.435 71.7 11.9 60.5 59.4 62.3 96 4 1 2470 Brazil 0.754 14,145 3.8 0.414 74.7 7.8 51.3 67.7 84.9 98 25 128 1574 Bulgaria 0.794 16,261 4.6 0.223 74.3 10.8 37.4 62.9 73.7 100 66 218 4733 Cana da 0. 92 42,582 7.4 0.098 82.2 13.1 34 82.2 80.8 100 4 302 6223 Chile 0.847 21,665 3.9 0.322 82 9.9 47.7 74.7 89.4 96 24 13 3949 China 0.738 13,345 3.1 0.164 76 7.6 42.2 63.7 51.9 91 147 546 3970 Colomb ia 0.727 12,762 5.4 0.393 74.2 7.6 50.8 60.1 75.6 92 44 28 505 Czec h Repu blic 0.878 28,144 6.3 0.129 78.8 12.3 25.9 75.8 73.4 100 137 56 5521 Denmark 0.925 44,519 9.2 0.041 80.4 12.7 28.2 80.3 87.1 100 136 194 6238 Ecua dor 0.739 10,536 4.5 0.391 76.1 8.3 45 55.2 68 94 66 2 202 Engla nd 0.909 37,931 7.6 0.131 80.8 13.3 33.2 84.2 79.7 100 271 NA 5803 Est onia 0.865 26,362 5 0.131 77 12.5 32.7 NA 69.5 98 31 34 6498 Ethiopia 0.448 152 3 4.7 0.499 64.6 2.6 39.1 33.3 17.2 44 102 53 1011 Fin land 0.895 38,868 7.3 0.056 81 11.2 27.1 81 83.8 100 18 303 6868 Franc e 0.897 38,085 9 0.102 82.4 11.6 32.7 82.3 86.4 100 122 716 5121 Germany 0.926 45,000 8.7 0.066 81.1 13.2 31.7 82.5 74.1 100 236 1346 5671 Ghana 0.579 383 9 4.8 0.547 61.5 6.9 42.4 47.9 52.6 86 124 4 879 Guer nsey Chan nel Islands* 0.975 NA NA NA 82.6 NA 40 NA 31.7 NA 850 NA 5481 Hong Kong 0.917 54,265 NA NA 84.2 11.6 NA NA 100 NA 6987 3 2478 Ind ia 0.624 566 3 3.9 0.53 68.3 6.3 35.1 48.9 31.6 92 445 28 2278 Jap an 0.903 37,268 8.6 0.116 83.7 12.5 32.1 79.5 91.9 100 348 439 4008 Jersey** 0.985 NA NA NA 81.9 NA 41 NA 31.7 NA 845 NA 5453 Leba non 0.763 13,312 3 0.381 79.5 8.6 31.8 NA 87.4 100 587 4 3748 Lithuania 0.848 26,006 4.4 0.121 73.5 12.7 37.4 NA 67.2 92 46 25 6116 Me xico 0.762 16,383 3.3 0.345 77 8.6 43.4 65.8 78.4 96 66 69 2615 Nepal 0.558 233 7 5.4 0.497 70 4.1 32.8 44.5 17.3 89 202 0 3142 The Netherlands 0.924 46,326 9.5 0.044 81.7 11.9 29.3 82.8 83.6 100 506 285 5778 New Zealand 0.915 32,870 9.1 0.158 82 12.5 NA 81 86.3 100 18 117 4530 Nigeria 0.527 544 3 5.3 NA 53.1 6 4 3 38.4 50.3 58 204 25
1004 (continued)
S256 JPAH 15 Supplement 2, 2018
Table 3 (continued) Co untry (in alpha betical ord er) HDI a GNI per capita, a USD Public health expenditure (% of GDP) a GII a Life expectancy at bir th, a y Mean years of scho oling, a y Gini index b
Global food security index
c Urban population perce ntage d Improved drinking water coverage, d % Popula tion density (people/km 2 of land area) e
Summer Olympic med
al count f Distance to the equa tor, g km Po land 0.855 24,117 4.5 0.137 77.6 11.9 31.8 74.1 60.8 NA 124 284 5754 Po rtugal 0.843 26,104 6.2 0.091 81.2 8.9 35.5 79 61.6 99 113 24 4363 Qatar 0.856 129,916 1.9 0.542 78.3 9.8 NA 73.3 98.9 100 221 5 2805 Scotlan d 0.909 37,931 7.6 0.131 80.8 13.3 33.2 84.2 79.7 100 271 NA 6263 Slo venia 0. 89 28,664 6.6 0.053 80.6 12.1 25.4 NA 49.8 99 103 23 5113 So uth Africa 0.666 12,087 8.5 0.394 57.7 10.3 63 64 62.4 91 46 86 3382 So uth Korea 0.901 34,541 4 0.067 82.1 12.2 31.6 NA 83.5 98 526 267 3975 Sp ain 0.884 32,779 6.4 0.081 82.8 9.8 36.2 78.1 77.6 100 93 150 4481 Sweden 0.913 46,251 10 0.048 82.3 12.3 29.2 81.7 85.4 100 24 494 6668 Taiwan *** 0.885 45,582 NA NA 80.2 NA 33.6 NA NA NA NA 24 2622 Thailand 0. 74 14,519 5.6 0.366 74.6 7.9 37.8 58.3 34.4 96 135 33 1755 United Arab Emirates 0. 84 66,203 2.6 0.232 77.1 9.5 NA 70.9 84.7 100 111 2 2592 United States 0. 92 53,245 8.3 0.203 79.2 13.2 41.5 84.6 82.6 99 35 2522 4107 Urug uay 0.795 19,148 6.1 0.284 77.4 8.6 39.7 69.7 92.6 100 20 10 3600 Venezu ela 0.767 15,129 1.5 0.461 74.4 9.4 46.9 50.2 93.7 93 36 15 710 Wales 0.909 37,931 7.6 0.131 80.8 13.3 33.2 84.2 79.7 100 271 NA 5778 Zimbabwe 0.516 158 8 N A 0.54 59.2 7.7 43.2 NA 39.1 80 42 8 2103 Abb reviations: GDP, Gross Domestic Pro duct; GII, gende r ineq uality inde x; GNI, gros s natio nal income; HDI , huma n develo pme nt inde x; NA, no t av aila ble. Note: For Engla nd, Scotland , and Wales , the of fi cial data fo r U K were repo rted. Sou rce s o f inform ation : a Unite d Natio ns Deve lopment Pro gramme 21 ; b and e the World B ank 34 , 35 ; c the Econ omist Inte lligenc e Unit 36 ; d Uni ted Nations, D epartment o f E conom ic and Soc ial Aff airs 37 ; f the Wikimedia Fou ndation 38 ; an d gthe dis tance to the Equ ator was calc ulated from the latitude and longi tude from LatLo ng.net . 39 *Fo r Guer nsey, the HDI sour ced from the Unite d Natio ns Econom ic an d Socia l Comm ission for Asi a and the Paci fi c 40 ; the life expec tancy at birth , popu lation size, and the po pulation dens ity sourced from the United St ates Centr al In telligen ce Agen cy 41 ; and the Gin i index sour ced fr om the State of Guer nsey. 42 ** For Je rsey, the HDI sour ced from the Unite d N ations Econ omic and Socia l Comm ission fo r Asi a and the Paci fi c 40 ; the life expec tancy at birth , po pulation siz e, and the popu lation density sourced from the Unite d Stat es Central Intelligence Agen cy 41 ; and the Gini inde x sour ced from the Stat e o f Jersey . 43 ***Fo r Taiwa n, the HDI, the GNI per cap ita, the life expec tancy at bir th, an d the Gin i inde x come from the Nationa l Stat istics, Republic of China (Taiw an). 44
JPAH 15 Supplement 2, 2018 S257
Table 4 Grades Assigned to the 10 Core Physical Activity Indicators for the 49 Countries of the Global Matrix 3.0 PA SP AP AT SB PF FAM SCH COM GOV AVG Australia D − B − INC D+ D − D+ C+ B+ A − DC − Bangladesh C − INC INC C − A − INC INC INC INC C − C Belgium (Flanders) F B INC C+ C INC C+ B − BB C Botswana INC INC D − CB − INC INC C − INC C C − Brazil D C + D + C D − DC − CC − D+ D+ Bulgaria D+ C+ C+ B − D INC D C C INC C − Canada D+ B+ D D − D+ D C + B − B+ C+ C − Chile D − D − INC F C − DF D B B − D China F D − D+ C+ F D D+ D+ F F D − Colombia D+ C INC B D + D − INC D B − BC − Czech Repu blic D B − D − C+ D − C+ C+ B+ B C + C Denmark D − A − INC B+ D+ INC INC A − B+ A − B − Ecuador D INC INC C − C INC F INC D+ INC D England C − D+ INC C − D+ C − INC B+ C INC C − Estonia D − C F D F INC D C + B B D + Ethiopia D C B C F INC F D F D D Finland D C + C B+ D − CB − AB + A − C+ France D C − INC C − D − B − INC B INC C C − Germany D − BD − C − D − INC B − B+ B+ INC C Ghana C C + B − C+ INC INC F D D+ D D + Guernsey D C + INC D C INC INC INC INC D D + Hong Kong C − C INC B+ C − DD − CB C C − India D INC C − B − C − F D INC D D D Japan INC B − INC A − C − AC − B+ B − BB − Jersey D − INC INC D+ C D C B − CD D + Lebanon D F INC D C − INC INC D INC C+ D Lithuania C − C INC C − C − C+ D C + C C C − Mexico D+ C INC C+ D − INC INC D+ D+ C D + Nepal D+ INC INC A − B+ INC A INC C − INC B − The Netherlands C B B B − C − INC INC C INC INC C+ New Zealand D − BC + C − D INC C − B − BB + C Nigeria C C − CB B − INC INC C − INC B C Poland D − D INC C D C − C − B C C+ C − Portugal D B − INC C − C − CC A B B C + Qatar D D + INC N/A D+ INC INC C INC B+ C − Scotland F B INC C F INC INC INC B − CD + Slovenia A − C+ D C B+ A − B+ A B A B South Africa C D INC C INC INC C − D − C − CD + (contin ued)
S258 JPAH 15 Supplement 2, 2018
Table
4
(continued)
PA
SP
AP
AT
SB
PF
FAM
SCH
COM
GOV
AVG
South
Korea
F
C
INC
B+
D
D
+
INC
D+
INC
D
D
+
Spain
D
B
C
−
B
−
B+
INC
INC
C+
INC
INC
C+
Sweden
D+
B+
INC
C
C
+
INC
INC
C+
A
B
C+
Taiwan
F
D
−
INC
C
−
C
−
B
−
INC
B+
B+
B+
C
Thailand
D
−
C
−
FC
D
−
INC
B
B
B
−
B+
C
−
United
Arab
Emirates
F
INC
INC
INC
C
−
INC
INC
D
−
INC
B+
D+
United
States
D
−
C
INC
D
−
DC
−
INC
D
−
C
INC
D
Uruguay
D
F
INC
C
C
−
C
−
INC
C
−
INC
D
D
Venezuela
D
D
INC
B
−
INC
INC
INC
INC
D
−
FD
Wales
D+
C+
C
−
D+
F
INC
D
INC
INC
C+
D+
Zimbabwe
C+
B
D
+
A
−
B
INC
INC
C
D
C
−
C
Abbr
eviatio
ns:
AP,
Activ
e
Play;
AT,
Activ
e
Transp
ortation;
AVG
,
Aver
age;
COM,
Comm
unity
and
Envir
onmen
t;
FA
M,
Fam
ily
and
Peers
;
GOV
,
Gove
rnmen
t;
INC
,
inco
mplete
grade
;
N/A
,
n
o
t
appl
icable
;
PA,
Physica
l
A
ctivity;
PF,
Phy
sical
Fi
tness;
SB,
Sed
entary
Beha
viors
;
SCH,
School;
SP,
Organized
Sport
and
Physica
l
A
ctivity.
JPAH 15 Supplement 2, 2018 S259
Overall Physical Activity grade and the other core indicator grades with the exception of Sedentary Behaviors for which a statisti-cally significant positive moderate correlation was observed (r = .39,P<.05). Finally, presented in theSupplementary Material 2 (available online) is the distribution of the grades (“A–B,” “C,” “D– F,”or“INC”grades) for the 10 common indicators and the average grades per country. Slovenia was the only country out of 49 with a very high grade for Overall Physical Activity (“A−”), whereas most of the other countries had“D–F”(n = 38). A greater variability in grades was observed for Sedentary Behaviors, but poor grades (“D– F”) were observed in most of the very high HDI countries.
Discussion
[image:10.612.42.577.93.278.2]As a result of the efforts of the Report Card work groups, the Global Matrix 3.0 allowed us to present physical activity-related indicators for children and youth assembled across 49 countries with varying levels of human development (9 low or medium HDI, 10 high HDI, and 30 very high HDI countries). While the average grades calcu-lated for the indicators were all between“D”and“C”(Table5), a great variety of grades was observed within and across the countries (Table4), showing that every country is facing unique challenges and can learn from the successes or difficulties experienced by
Table 5 Descriptive Statistics of the Grades by Indicator and Groups of Indicators for the 49 Countries of the Global
Matrix 3.0
Grade count Incomplete grades Mean number grade SD Mean letter grade
Overall Physical Activity 47 2 5.2 2.1 D
Organized Sport and Physical Activity 42 7 8.2 2.7 C
Active Play 20 29 6.5 2.7 D+
Active Transportation 47 2 8.3 2.5 C
Sedentary Behaviors 46 3 6.4 2.8 D+
Physical Fitness 22 27 7.1 2.9 C−
Family and Peers 27 22 7.0 3.1 D+
School 41 8 8.8 3.0 C
Community and Environment 36 13 8.9 3.0 C
Government 41 8 8.6 3.1 C
Behavioral indicators 49 0 7.0 1.6 C−
Sources of influence indicators 49 0 8.3 2.5 C
All indicators 49 0 7.5 1.6 C−
Note: Behavioral indicators = average of Overall Physical Activity, Organized Sport and Physical Activity, Active Play, Active Transportation, and Sedentary Behavior indicator grades; sources of influence indicators = average of Family and Peers, School, Community and Environment, and Government indicator grades. Physical Fitness was not included in the behavioral indicators cluster. There are no missing grades for the bottom 3 rows (bolded) because these scores are adjusted for missing grades.
Table 6 Average Grades by Indicator and Group of Indicators for the 3 HDI Categories (Low or Medium, High, and
Very High)
Low and medium HDI High HDI Very high HDI
Overall Physical Activity C− D− D−
Organized Sport and Physical Activity C D+ C+
Active Play C− D D+
Active Transportation C+ C C−
Sedentary Behaviors C+ D D+
Physical Fitness F D C−
Family and Peers D+ D+ C−
School D+ C− C+
Community and Environment D D+ B−
Government C− D+ C+
Behavioral indicators C D+ D+
Sources of influence indicators D+ D+ C+
All indicators C− D+ C−
Abbreviation: HDI, human development index. Note: Behavioral indicators = average of Overall Physical Activity, Organized Sport and Physical Activity, Active Play, Active Transportation, and Sedentary Behavior indicator grades; sources of influence indicators = average of Family and Peers, School, Community and Environment, and Government indicator grades. Physical Fitness was not included in the behavioral indicators cluster. There are no missing grades for the bottom 3 rows (bolded) because these scores are adjusted for missing grades.
JPAH 15 Supplement 2, 2018
S260 Aubert et al
[image:10.612.40.577.369.554.2]Figure
1
—
Plot
of
the
overall
score
estimated
for
the
10
core
indicators
for
the
49
countries
of
the
Global
Matrix
3.0.
Note:
The
overall
score
was
adjusted
for
mis
sing
and
incomple
te
grades.
The
number
in
parenthesis
shows
the
number
of
grades
available
for
the
calculation
of
the
score.
JPAH 15 Supplement 2, 2018 S261
Figure
2
—
Plot
of
the
behavioral
score
estimated
for
the
49
countries
o
f
the
Global
Matrix
3.0.
Note:
The
behavioral
score
was
adjusted
for
missing
and
incomplet
e
grades.
The
number
in
parenthesis
shows
the
num
ber
of
grades
available
for
the
calculation
of
the
score.
S262 JPAH 15 Supplement 2, 2018
Figure
3
—
Plot
of
the
source
of
in
fl
uence
indicators
score
for
the
49
countries
of
the
Gl
obal
Matrix
3.0.
Note:
The
source
of
in
fl
uence
score
was
adjusted
for
missing
and
incomplete
grades.
The
number
in
par
enthesis
shows
the
num
ber
of
grades
available
for
the
calculation
of
the
score.
These
estimates
of
sources
of
in
fl
uence
sco
re
are
interpreted
with
a
high
degree
of
caution
as
they
are
likely
imprecise
estimates
of
sources
of
in
fl
uence
due
to
the
level
of
missing
data
use
d
to
determine
this
score.
JPAH 15 Supplement 2, 2018 S263
others. However, trends and comparable challenges identified across the physical activity indicators were identified within countries in the same HDI grouping despite their diverse sociodemographic, cultural, and geographical contexts. A discussion of the most and the least successful countries, followed by the interpretation of the findings from each indicator is presented in the following section, integrating the comparison of each HDI grouping.
Most Successful Countries
On the overall score, the very high HDI countries ranked generally higher than the low and medium, and high HDI countries (Figure1), but this is not corroborated with results presented in Table6where the overall averages were the same for the low and medium HDI countries and the very high HDI countries. Slovenia obtained the best grade on average (“B”), followed by 2 other very high HDI countries (Japan and Denmark) that both obtained an average grade of “B−.”The specifics of childhood physical activity in these 3 countries have already been discussed in the paper presenting the findings from the very high HDI countries.25 These 3 countries were also leading the ranking based on the sources of influence score (Figure3). The ranking of the behavioral score was domi-nated by 2 low HDI countries (Nepal and Zimbabwe) and Japan (Figure2). These rankings should be interpreted with caution given the large number of“INC”grades in their country Report Cards (2 in Japan, 3 in Denmark, 5 in Nepal, and 2 in Zimbabwe).
Nepal lacked data to inform 5 of the 10 indicators that were assigned an“INC”grade (Organized Sport and Physical Activity, Active Play, Physical Fitness, School, and Government). A“D+” was assigned to Overall Physical Activity based on a study that found that only 39.8% of children and youth accumulated at least 60 minutes of MVPA per day. Nevertheless, Nepal shared the best grade for Active Transportation with Japan and Zimbabwe (“A−”), obtained a high grade for Sedentary Behaviors (“B+”) and also scored highest for the Family and Peers indicator (“A”). These grades were all informed by local studies focusing on adoles-cents.46Nepal’s good grades in many of the indicators including Active Transportation and Sedentary Behavior may be associated with low automobile dependency (eg, 7.12 vehicles for 1000 people in 2011)47 and minimal opportunities and access to screen-based recreational sedentary pursuits such as television and computer time and time spent using the Internet. Nepal had 5.30 televisions per 1000 people (as of 2003), 4.37 computer (as of 2004), and 4.51 Internet subscribers (as of 2012) for 1000 people.48 Due to the concurrent economic development in recent years in Nepal, the number of motorized vehicles is increasing rapidly with the expansion of road networks in rural areas,49 and potentially more people have access to screen devices. Thesefindings should be interpreted with caution, but they do suggest that the situation can potentially be positive in Nepal in terms of child and youth’s active transportation and sedentary behaviors at present. Yet, these favorable behaviors might be threatened by the economic growth and development, and these physical activity behaviors may be more a function of poor economic development than a freely chosen physical activity. Nonetheless, more good quality research with nationally representative data is needed to obtain more reliable estimates of the physical activity of children and youth and to inform the grades with“INC”grades.
Zimbabwe had the second-best grade for Overall Physical Activity (“C+”) after Slovenia, with high grades for most of the behavioral indicators (“B” for Organized Sport and Physical Activity,“A−”for Active Transportation, and“B”for Sedentary
Behaviors); however, its sources of influence indicators were assigned grades between “D” and “C.” In comparison with the previous Report Card in Zimbabwe, the grades for School, Com-munity and Environment, and Government, have improved due to recent policy implementations and commitments made by the government to promote physical activity and nutritional status among Zimbabwean children and youth.50 However, there is need for caution in interpreting these grades as they were informed by limited and mostly unpublished data and expert opinion. Thus, more research is needed to obtain a reliable picture of the context of the physical activity level of children and youth in Zimbabwe.
Least Successful Countries
One low HDI country, Ethiopia, and 2 high HDI countries, Venezuela and China, were the least successful countries based on the over-all and the source of influence score rankings (Figures1and3). An average grade of“D−”was assigned to China, and an average grade of “D” was assigned to Ethiopia and Venezuela. China’s Report Card work group developed a national surveillance protocol to collect nationally representative data for China’s 2018 Report Card.51 An “F” was assigned to 4 indicators (Overall Physical Activity, Sedentary Behaviors, Community and Environment, and Government) and the remaining indicators were assigned grades between“D−”and“C+.”The small proportions of 9- to 17-year-old children in China meeting the physical activity guidelines (13.1%) or the sedentary behavior guidelines (7.1%) are alarming.51With an estimated population of 1.4 billion,52China is the most populated country in the world, and the low prevalence estimates observed here suggest that the majority of a large number of children and youth (approximately 160 million of 10- to 19-y-olds in 2015)52are not engaging in sufficient amounts of MVPA to benefit their health. However, the high level of air pollution in China represents a major threat to the promotion of physical activity53and is a potential barrier stopping the Chinese children and youth from exercising. The recent support from the Chinese Ministry of Education in conducting national surveillance of children physical activity is however encouraging, and hopefully this support will be expanded to future investments in the development of interventions and policies de-signed to increase physical activity opportunities at community and environment levels in China.
In Ethiopia, an “F” was assigned to Sedentary Behaviors, Family and Peers, and Community and Environment, and the grades for the remaining indicators ranged between “D” and “C,”with the exception of Active Play that was graded“B.”These findings should be interpreted with caution as the grades were informed by estimates based on experts’opinion when data for an indicator were unavailable.54This method, nevertheless, did allow the Report Card work group to present an initial broad picture of childhood physical activity in Ethiopia.
Venezuela is currently facing a humanitarian crisis related to its economic and sociopolitical situation. Between 2016 and 2017, marked increases in maternal mortality (65%), infant mortality (30%), and cases of malaria (76%) were observed, and the esti-mated prevalence of severe malnutrition among children under 5 years of age increased from 10.2% in February 2017 to 14.5% in September 2017.55 Nevertheless, a Report Card was devel-oped, using published and unpublished national survey data, peer-reviewed literature, government and nongovernment reports and online content, and meetings with experts working for govern-mental (municipal) and nongoverngovern-mental organizations.56 The Venezuelan Report Card work group assigned an“INC”grade to JPAH 15 Supplement 2, 2018
S264 Aubert et al
5 indicators: Active Play, Sedentary Behaviors, Physical Fitness, Family and Peers, and School. An“F”grade was assigned to the Government indicator while the remaining indicators were graded “D”or“D−,”with the exception of Active Transportation which was graded“B−.”Although there were no physical activity data available for those under 15 years of age, the work group found that the majority of adolescents older than 15 years do not engage in physical activity regularly. In addition, the high rates of crime were identified as a barrier to physical activity. Currently, no govern-mental efforts to ensure safety and promote an active lifestyle in Venezuela are being implemented.56
Overall Physical Activity
Only 2 countries assigned “INC”grades to the Overall Physical Activity indicator: Japan and Botswana. Slovenia, where more than 80% of children and youth aged between 6 and 19 years (according to subjective self-reported data), 88% of the 11-year-olds, and 66% of the 14-year-olds (according to objective data) were meeting the physical activity guidelines, was the only country reporting a high grade for this indicator (“A−”).57For this indicator, the grades for the remaining countries ranged from“F”(Belgium, China, Scot-land, South Korea, and Taiwan) to“C+”(Zimbabwe).
The Overall Physical Activity grade was informed by various types of data across countries: objective measurement with accel-erometers or pedometers, self-report or proxy-report questionnaire, and expert opinion. Even among both the subjective and objective data, the methods varied substantially in terms of instruments, analysis, age range, sample size, and representativeness of sam-ples.23,24,58In addition, the available data in each country did not necessarily allow the Report Card work groups to use either of the recommended benchmarks (see Table1) strictly when estimating the prevalence of physically active children and youth in their sample.23,24,58For such reasons, the comparability of these results among the countries should be interpreted with caution.
Overall Physical Activity was the indicator with the lowest average grade:“D.”A distinction was observed between the low and medium HDI countries and the 2 other HDI groupings. The average grade for the low and medium HDI countries was“C−,” whereas both the high and very high HDI countries obtained an average of“D−,”which could represent a difference of 14% to 26% in physical activity guidelines adherence (“D−”= 20%–26% vs“C −” 40%–46%). In accordance with this difference of grades, a significant low negative correlation was observed between the Overall Physical Activity indicator and several sociodemographic indicators including the HDI (r=−.30, P<.05) and the growth national income per capita (r=−.33,P<.05) (seeSupplementary
Material 1 [available online]). The present study provides new
evidence showing that the situation regarding the physical activity of children and youth is a universal concern worldwide. This finding is consistent with the results from the previous Global Matrices16,19and recent global estimates.11Efforts should be made globally and collectively to develop standardized physical activity surveillance systems adapted to the national context of each country. Furthermore, developing effective strategies to increase physical activity opportunities for all should be a national public health priority in all countries regardless of the HDI background.
Organized Sport and Physical Activity
An “INC”grade was assigned for this indicator in 7 countries: Bangladesh, Botswana, Ecuador, India, Jersey, Nepal, and United
Arab Emirates. The Organized Sport and Physical Activity grades ranged from“F”(Lebanon and Uruguay) to“A−”(Denmark), with an average of“C.”The benchmark recommended for this indicator was the “percentage of children and youth who participate in organized sport and/or physical activity programs” (Table 1), meaning that this indicator did not provide any information on the dose (ie, duration, frequency, intensity) of physical activity while participating in sport and organized physical activities, because few countries have such data. The grade for this indicator depends on the availability of organized sport opportunities and the availability of data reporting the prevalence of children and youth who have taken advantage of these opportunities. This grade was mostly informed by official reports from governmental and/or public institutions as well as self-reported surveys.
Organized Sport and Physical Activity was graded“C,” “D+,” and“C+”on average for the low and medium HDI countries, the high HDI countries, and the very high HDI countries, respectively. Among the 9 low and medium HDI countries, 5 assigned a letter grade to this indicator, which ranged from“D”to“B,”with an average of“C.”In these countries, the organized sport opportunities corresponded mostly to school-based sports or sport teams and recreational sports organized by nongovernmental organizations and communities. Among the high HDI countries, the grades ranged from“F”to “C +”with an average of“D+.”However, it is not possible to discern from the available data if these low grades correspond to the limited availability of organized sport opportunities (ie, distal correlates) or if there are barriers (eg, proximal correlates such as motivation, interest, time, or parental support) hindering children from participating while organized physical activities are readily available to them. In the very high HDI countries, with an average grade of“C+,”Organized Sport and Physical Activity was the highest graded behavioral indicator. In these countries, organized sport opportunities are available to children and youth in various settings: sport club and federations, school-based sport teams and organized sport sessions, municipal sport programs, and sport programs offered by private businesses. In addition, significant low to moderate positive associations were observed between Organized Sport and Physical Activity and several socio-demographic indicators including HDI, life expectancy at birth, mean years of schooling, growth national income per capita, public health expenditure (% of GDP), global food security index, improved drinking water coverage, and summer Olympic medal count, whereas significant low negative associations between this indicator and the 2 inequality indices (Gini index and gender inequality index) (see
Supplementary Material 1[available online]) were observed.
More research is needed to examine if affordable and appeal-ing organized physical activity and sport opportunities are offered to all children and youth equally and equitably—across differ-ent age, gender, socioeconomic, ethnic, and special population groups—and to isolate the missing components of organized sports opportunities in each country. In addition, it would be interesting to add the measurement of the dose of physical activity associated with organized sports and physical activities in national physical activity surveillance systems. Filling these research and surveil-lance gaps is a necessary step toward the development of effective strategies to promote physical activity by increasing organized sport opportunities at the national level.
Active Play
Among the 20 countries that graded Active Play, this behavior was mostly measured by self- or proxy-report surveys, assessing the frequency or the time of active play/being active while
JPAH 15 Supplement 2, 2018
Global Matrix 3.0 Physical Activity Report Card Grades S265
playing,57,59–62unstructured/unorganized active play,51,63–69 play-ing outdoors/outdoors activities/beplay-ing outdoors,50,59,67,70–72and/or was based on expert opinion.50,54,73,74A definition for active play was proposed in a recent systematic review:“a form of gross motor or total body movement in which young children exert energy in a freely chosen, fun, and unstructured manner.”75 A consensus definition, however, still needs to be internationally agreed upon and acknowledged to allow the development of standardized measurement tools for this indicator in varying age groups.
Active Play was the indicator with the most “INC” grades where 29 of 49 countries were unable tofind available data to grade this indicator. The grades ranged from“F”(Estonia and Thailand) to“B”(Ethiopia and The Netherlands) with an average of“D+.” The average grades for the low and medium HDI countries, high HDI countries, and very high HDI countries were“C−,” “D,”and “D+,”respectively. Given the amount of “INC” grades and the variability of the data used to inform the grades for the Active Play indicator, a valid comparison between the 3 HDI groupings was difficult. The low grades that were reported for this indicator aligned with the previous Global Matrices findings.16,19 Such low level of engagement in active play can potentially be explained by the low detection capacity of instruments utilized for its measurement. Active play during free time may be slowly dis-appearing in favor of screen time in developed countries or is replaced with chores or work in developing countries. Perception of the environment as unsafe can also be a potential barrier to this behavior. However, no relation was found between Active Play and the Community and Environment indicators (Supplementary
Material 1[available online]). Further research is needed for the
development of a consensus definition, measurement instruments, surveillance systems, and to identify the barriers and facilitators of active play.
Active Transportation
Only 2 countries did not assign a letter grade to Active Transpor-tation: Qatar (not applicable) and United Arab Emirates (“INC”). The average grade for this indicator was D+ and ranged from“F” (Chile) to“A−”(Japan, Nepal, and Zimbabwe). The recommended benchmark for this indicator was“the percentage of children and youth who use active transportation to get to and from places” (Table1). For most of the countries, the grades were informed by data reporting the prevalence of children and/or youth actively commuting between home and school without information on different doses (ie, frequency, duration, intensity).
Active Transportation was the indicator with the highest average grade for the low and medium HDI countries (“C+”) and for the high HDI countries (“C”). The average grade for the very high HDI countries was“C−”for this indicator. In 3 of the 4 very high HDI countries from Eastern Asia, very high grades were assigned to this indicator: Japan (“A−”), Hong Kong (“B+”), and South Korea (“B+”). These 3 countries share similar characteristics historically, culturally, and developmentally,76and have shown a high percentage of urban population (83.3%–100%, Table3). A specific policy in Japan (limiting the distance between the children and youth homes and the public elementary and junior high schools)77 and the high density of Hong Kong, Japanese, and South Korean cities, allow children and youth to live a short trip away from their school, which can minimize the use of cars or other forms of motorized vehicles, and promote active travel.25,78,79
High to very high grades for this indicator were also reported in several developing countries: Colombia (“B”), Nepal (“A−”),
Nigeria (“B”), Venezuela (“B−”), and Zimbabwe (“A−”), whereas poor grades were reported for 16 of the 30 very high HDI countries (with grades between “F” and “C−”). However, no statistically significant relation was found between Active Transportation and Community and Environment indicators or the HDI in the correla-tional analysis. Thesefindings suggest that, for developing coun-tries, active transportation may be driven by a necessity (ie, no access to public or family/personal motorized transportation) instead of a choice,80notwithstanding the safety of the environment or the long distance to commute. The measurement of the dose and the characteristics of children’s and youth’s active transportation internationally are necessary to identify the contribution of active transport to overall physical activity levels, as well as the facil-itators and obstacles for this behavior in order to develop contex-tually adapted, effective ways to promote it. Strategies to improve safety conditions and to promote active transportation as a desir-able mode of transport are required in order to maintain the high grades in the country’s leading this indicator and to improve those that are lagging.
Sedentary Behaviors
Sedentary Behaviors is defined as“any waking behavior character-ized by an energy expenditure≤1.5 metabolic equivalents, while in a sitting, reclining, or lying posture.”1Screen time, referring to time spent in screen-based behaviors,1 is often used as a proxy for sedentary behavior in research. Screen time can be performed while being sedentary or physically active1; however, this behavior has been shown to be associated with a variety of negative health outcomes among children and youth.81 This is why guidelines recommending limiting screen time to 2 hours daily for 5- to 17-year-olds were developed for thefirst time in Canada.82 Further-more, it was also the reason why the benchmark for Sedentary Behaviors focused on screen time: “percentage of children and youth who meet theCanadian Sedentary Behaviour Guidelines (5-to 17-year-olds: no more than 2 hours of recreational screen time per day)”(Table1). However, the comparisons between the countries should be interpreted with caution because of the variability of the data that were used to inform the grades for this indicator. Several Sedentary Behaviors grades were partially or totally informed by data reporting time spent sitting or doing other sedentary activities that did not involve screens, and screen time cutoff points differing from the one in the benchmark (ie,≤1 h/d,<2 used hours/day,≤3 h/d) were also used by some countries because of available data.
Three countries assigned an“INC”grade to Sedentary Beha-viors: Ghana, South Africa, and Venezuela. The grades for this indicator ranged from“F”(China, Estonia, Ethiopia, Scotland, and Wales) to “A−” (Bangladesh), with an average of“D+.”These findings are consistent with international estimates reporting that at least two-thirds of the children exceed 2 hours of recreational screen time per day,83although comparison may be limited by the heterogeneity in Sedentary Behaviors across countries. The low and medium HDI countries obtained an average of“C+”for this indicator, and only 2 of the 8 countries had a low grade: Ethiopia “F” and India “C−.” The grades for the 6 remaining low and medium HDI countries ranged from“B”to“A−.”The high and the very high HDI countries obtained an average grade of “D”and “D+,”respectively, for Sedentary Behaviors. In 36 out of the 39 high and very high HDI countries that graded this indicator, a low or very low grade (between“F”and“C−”) was assigned. Regard-less, the Sedentary Behaviors grades were not significantly related to HDI or to the other sociodemographic indicators except the mean
JPAH 15 Supplement 2, 2018
S266 Aubert et al