Open Access
Research article
Direct susceptibility testing for multi drug resistant tuberculosis: A
meta-analysis
Freddie Bwanga
1,2,3, Sven Hoffner
2,3, Melles Haile
2,3and Moses L Joloba*
1Address: 1Department of Medical Microbiology Makerere University College of Health Sciences Kampala, Uganda, 2Department of Bacteriology, Swedish Institute for Infectious Disease Control, Solna, Sweden and 3Department of Microbiology, Tumour and Cell Biology (MTC), Karolinska Institute, Stockholm, Sweden
Email: Freddie Bwanga - freddie.bwanga@ki.se; Sven Hoffner - sven.hoffner@smi.se; Melles Haile - melles.haile@smi.se; Moses L Joloba* - moses.joloba@case.edu
* Corresponding author
Abstract
Background: One of the challenges facing the tuberculosis (TB) control programmes in resource-limited settings is lack of rapid techniques for detection of drug resistant TB, particularly multi drug resistant tuberculosis (MDR TB). Results obtained with the conventional indirect susceptibility testing methods come too late to influence a timely decision on patient management. More rapid tests directly applied on sputum samples are needed. This study compared the sensitivity, specificity and time to results of four direct drug susceptibility testing tests with the conventional indirect testing for detection of resistance to rifampicin and isoniazid in M. tuberculosis. The four direct tests included two in-house phenotypic assays – Nitrate Reductase Assay (NRA) and Microscopic Observation Drug Susceptibility (MODS), and two commercially available tests – Genotype®
MTBDR and Genotype® MTBDRplus (Hain Life Sciences, Nehren, Germany).
Methods: A literature review and meta-analysis of study reports was performed. The Meta-Disc software was used to analyse the reports and tests for sensitivity, specificity, and area under the summary receiver operating characteristic (sROC) curves. Heterogeneity in accuracy estimates was tested with the Spearman correlation coefficient and Chi-square.
Results: Eighteen direct DST reports were analysed: NRA – 4, MODS- 6, Genotype MTBDR® –
3 and Genotype® MTBDRplus – 5. The pooled sensitivity and specificity for detection of resistance
to rifampicin were 99% and 100% with NRA, 96% and 96% with MODS, 99% and 98% with Genotype® MTBDR, and 99% and 99% with the new Genotype® MTBDRplus, respectively. For
isoniazid it was 94% and 100% for NRA, 92% and 96% for MODS, 71% and 100% for Genotype®
MTBDR, and 96% and 100% with the Genotype® MTBDRplus, respectively. The area under the
summary receiver operating characteristic (sROC) curves was in ranges of 0.98 to 1.00 for all the four tests. Molecular tests were completed in 1 – 2 days and also the phenotypic assays were much more rapid than conventional testing.
Conclusion: Direct testing of rifampicin and isoniazid resistance in M. tuberculosis was found to be highly sensitive and specific, and allows prompt detection of MDR TB.
Published: 20 May 2009
BMC Infectious Diseases 2009, 9:67 doi:10.1186/1471-2334-9-67
Received: 18 July 2008 Accepted: 20 May 2009
This article is available from: http://www.biomedcentral.com/1471-2334/9/67 © 2009 Bwanga et al; licensee BioMed Central Ltd.
Background
Tuberculosis (TB) continues to be a leading cause of mor-bidity and mortality in developing countries [1]. Global efforts for TB control are being challenged by the steady increase in drug-resistant TB, particularly multidrug resist-ant tuberculosis (MDR TB), defined as resistance to at least rifampicin (RIF) and isoniazid (INH). The World Health Organization (WHO) estimates that 500,000 new cases of MDR TB occur globally every year and MDR TB has been reported in 2.9% and 15.3% among the new and previously treated cases, respectively [2].
MDR TB requires 18–24 months of treatment with expen-sive second line drugs some of which are injectable agents. The cure rate is much lower than for drug susceptible TB, only around 60% [3]. Therefore, it is crucial that MDR TB should be detected as soon as possible, and measures implemented to effectively control its further spread.
Conventional methods for detection of MDR TB involve primary culture of specimens and isolation of Mycobacte-rium tuberculosis (MTB), followed by drug susceptibility testing (DST). This process, referred to as indirect suscep-tibility testing has a long turn around time (TAT) of around 2 months. The TAT is longest in the TB high bur-den low-income countries where primary isolation and indirect DST are almost exclusively performed on solid medium. Use of liquid systems such as the BACTEC MGIT 960 system (Becton Dickinson, Sparks, Maryland, USA) has improved TAT to about 25–45 days, but liquid culture systems are in most cases not available where the need is greatest [4].
Even though liquid-based indirect susceptibility tests have improved the TAT, they are still not rapid enough to allow timely decisions on patient management in case of MDR TB. More rapid TB susceptibility tests are needed, particu-larly in TB high burden countries. Recently, the focus has shifted to rapid direct tests in which decontaminated res-piratory samples are directly inoculated in drug-free and drug-containing medium or amplified for detection of MDR TB. Some of the direct tests being studied with pros-pects for applicability in developing countries include the Nitrate Reductase Assay (NRA); Microscopic Observation Drug Susceptibility (MODS) assay, and more recently molecular assays such as the Genotype® MTBDR (Hain Life sciences, Nehren, Germany), and its newer version – the Genotype® MTBDRplus.
The NRA test, initially introduced as an indirect assay is performed on solid medium as for the proportion method, though liquid-based assays have recently been studied [5-9]. The medium is supplemented with potas-sium or sodium nitrate at a concentration of 1000 mg/L to act as a growth indicator. Live M. tuberculosis organisms
possess the nitro-reductase enzyme and will reduce nitrate to nitrite, which is then detected as a pink-purple colour when a detection reagent (Griess reagent) is added to the tube [5]. A colour change in a drug-containing tube indi-cates resistance. The MODS assay is a low-technology liq-uid culture system performed in OADC-supplemented 7H9 broth on an ordinary tissue culture plate [10]. A cock-tail of antibiotics – polymyxin B, amphotericin B, Nalid-ixic acid, trimethoprim and azlocillin (PANTA) is added to prevent growth of contaminating bacteria and fungi. Incorporation of isoniazid and rifampicin in the wells fol-lowed by inoculation of processed samples in the drug-free and drug containing wells allows direct detection of MDR TB. When M. tuberculosis grows in the broth, charac-teristic cord-like structures can be seen under an inverted microscope, permitting early detection of resistance [10-16]. The MODS assay has been studied on both smear positive and smear negative sputum samples with good results [11], which is not the case with any other tests. The
GenoType®MTBDR assay is a molecular test that detects the common mutations in the rpoB and katG genes responsible for resistance to rifampicin and isoniazid, respectively [17]. The test involves DNA extraction, multi-plex polymerase chain reaction (PCR), solid phase reverse hybridization and detection of the resistance mutations [18-20]. The Genotype® MTBDRplus assay detects addi-tional mutations in the rpoB gene and also in the inhA
gene promoter region, giving a higher sensitivity in resist-ance detection [18,21-24].
Published studies have evaluated the performance of direct testing with the above mentioned tests. However, the data is spread in many different journals, which makes it difficult to fully understand the performance of direct testing, thereby delaying decisions on adoption of this approach for prompt detection of MDR TB. In this study, available data from individual study reports on direct test-ing with the NRA, MODS, Genotype® MTBDR and Geno-type® MTBDRplus was pooled and analysed for sensitivity, specificity and time to results of direct testing against con-ventional indirect susceptibility testing in detection of MDR TB. The results of this meta-analysis are intended to guide TB control programmes in TB high burden countries to select for further operational study, highly sensitive and specific rapid tests to identify MDR TB.
Methods
Study designA literature review and meta-analysis was conducted.
Search strategy
'rifampicin resistant tuberculosis', 'isoniazid resistant tuberculosis', 'multi drug resistant tuberculosis testing'. New links displayed beside the abstracts were followed and retrieved. Finally, the bibliographies of each article were carefully reviewed and relevant articles also retrieved. A search in other databases did not reveal any additional articles previously missed on PubMed or Google searches.
Inclusion and exclusion criteria
Only study reports that had evaluated direct DST for detection of resistance to RIF and/or INH in M. tuberculosis
were included. At least 3 independent direct DST reports were required to qualify a test for the pooled data analysis. Additionally, the study report must have had extractable data to fill the 4 cells of a 2 × 2 table for diagnostic tests (true resistant – TR, false resistant – FR, false susceptible – FS and true susceptible – TS). Lastly, studies were included if the reference standard test in the report was an indirect assay i.e. proportion method (PM) on Lowenstein-Jensen (L-J) or 7H10 agar, BACTEC 460, BACTEC MGIT 960 or a MIC (minimum inhibitory concentration) test. One gen-otypic study used DNA sequencing as the reference test but was also included. Indirect DST assay reports or study reports that used the test for reasons other than DST were excluded from further analysis, as were study reports with-out extractable data for a 2 × 2 table.
Quality of study reports
In a meta-analysis of diagnostic accuracy studies, factors such as study design, patient selection criteria, reference standard and blinding, may be related to overly optimistic estimates of diagnostic accuracy [25]. We applied the quality of diagnostic accuracy studies tool (QUADAS tool) [26] to assess the quality of the reports included in this analysis. The QUADAS tool has 14 items that assess study design-related issues, and the internal and external validity of the results of the study [26]. Each item may be scored 'yes' if reported; 'no' if not reported; or 'unclear' if the information in the article is inadequate to make an accurate judgement.
Data extraction
Data from study reports was extracted twice. Data items included author(s); year of publication; reference stand-ard test; country where the study was conducted; sample size; specimen type; values of true resistance (TR), false resistance (FR), false susceptible (FS) and true susceptible (TS); and the QUADAS items. The time to results (TTR) in days from setting the test to obtaining results for 100% of the samples in each study report was recorded. The aver-age time for each test type was then calculated.
Data analysis Accuracy estimates
Sensitivity, specificity, forest plots and summary receiver operating characteristic (sROC) curves were analysed with the Meta-Disc software, based on the fixed model effect [27]. Sensitivity was defined as the proportion of drug resistant TB strains correctly identified by the new test (true resistant rate – TRR). Specificity was defined as the proportion of susceptible isolates correctly identified by the new test (true susceptible rate – TSR).
Statistical testing for heterogeneity in accuracy estimates
Threshold/cut off effect as a possible cause of variations in sensitivity and specificity among the reviewed reports was tested with the Spearman correlation coefficient between the logit of sensitivity and logit of 1-specificity. Variation due to factors other than threshold/cut off effect was tested by visual inspection of the forest plots for (i) degree of deviation of sensitivity and specificity of each study from the vertical line corresponding with the pooled esti-mates, (ii) Chi-square p-values and (iii) inconsistence index.
Time to results
The average time to results was computed in MS office excel 2007.
Results
Sixty-four reports were initially reviewed. Nineteen of these had studied direct DST for detection of resistance to rifampicin and/or isoniazid in M. tuberculosis. Eighteen of the 19 reports fulfilled the inclusion criteria for the meta-analysis. The study reports reviewed and meta-analysed or excluded, plus reasons for the exclusion are shown in table 1. The description of the 18 meta-analysed reports is given in table 2.
Quality of study reports (QUADAS analysis results) Thirteen (72%) of the 18 study reports had reported the spectrum of patients or samples to be representative of those to benefit from routine use of the test (QUADAS item 1). Eight (44%) of the 18 study reports clearly described the patient or sample selection criteria (QUA-DAS item 2). Quality items 3 to 9 that relate to internal validity of the assay results were reported in 67–100% of the studies. Lastly, seven of the 18 studies reported on blinding to the results of the reference test (items 10) while five reported on blinding to the new tests results (item 11). Un-interpretable results were reported in 13 (78%) of the 18 studies (item 13).
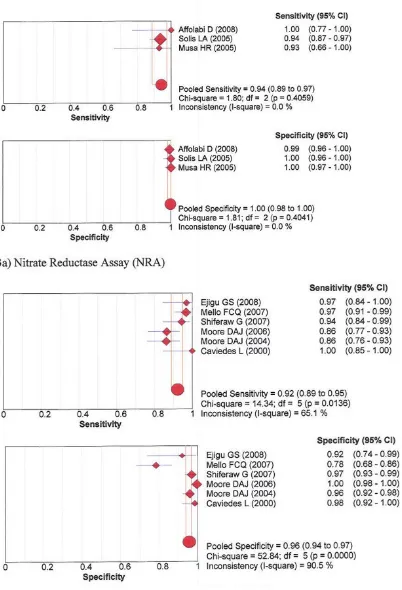
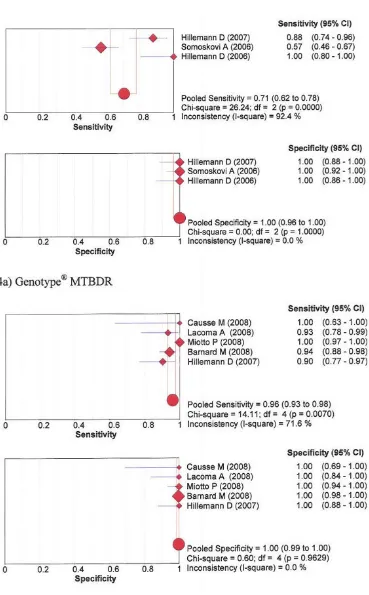
Sensitivity and specificity Rifampicin
96% and 96% with MODS, 99% and 98% with Genotype® MTBDR, and 99% and 99% with the new Genotype® MTB-DRplus, respectively. See forest plots figures 1 and 2.
Isoniazid
The pooled sensitivity and specificity for detection of resistance to isoniazid was 94% and 100% for NRA, 92% and 96% for MODS, 71% and 100% for Genotype® MTBDR, and 96% and 100% with the Genotype®
MTBDR-plus, respectively. See forest plots figures 3 and 4.
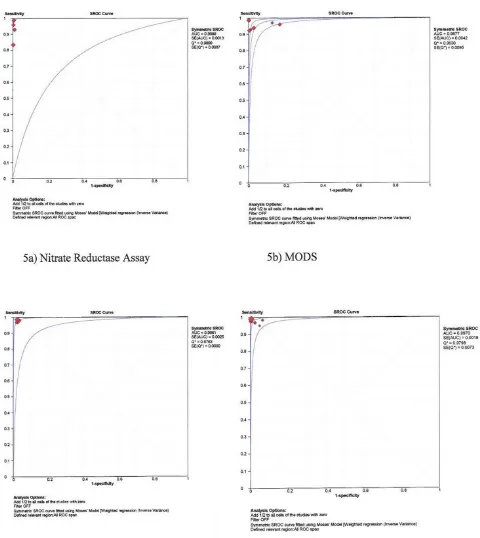
Area under the sROC curve
The sROC curves are shown in figures 5 and 6 for rifampicin and isoniazid, respectively. The area under the sROC curves was 0.98 to 1.00 for each of the four tests for both rifampicin and isoniazid, and the Cochrane (Q*) index ranged from 0.95 to 0.99.
Heterogeneity in sensitivity and specificity among study reports
Table 3 presents for each test the Spearman correlation coefficient between the logit of sensitivity and logit of 1-specificity. The degree of deviation of sensitivity and spe-cificity estimates from the vertical line corresponding with the pooled estimates, the Chi-square p-values and incon-sistence index (1-squared) are shown in the forest plots for each test, figures 1, 2, 3, 4.
Time to Results (TTR)
The average time to 100% of the results was 23 days (range 18–28 days) for the NRA and 21 days (range 15– 29) for MODS. One of the Genotype® MTBDRplus studies reported TTR (2 days).
Discussion
This study aimed at assessing the sensitivity, specificity, and time to results of the NRA, MODS, Genotype® MTBDR and Genotype® MTBDRplus tests for direct detection of resistance to rifampicin and isoniazid compared with con-ventional indirect DST. The results are intended to guide
TB control programmes in RLS to select for further opera-tional study highly sensitive and specific tests with shorter time to results for detection of MDR TB.
Sensitivity and specificity of in-house phenotypic assays Direct NRA performed with excellent pooled sensitivity and specificity for both rifampicin and isoniazid (94% – 100%). These findings indicate improved performance of the test when compared to results in a review by Martin A et al where sensitivity and specificity of direct NRA studies was 88% – 100% [28]. The MODS test with the highest number of direct DST studies showed good pooled sensi-tivity and specificity (86–100%) but performance of the MODS was slightly lower compared to the NRA.
Sensitivity and specificity of the commercially available genotypic assays
Both the Genotype® MTBDR and Genotype® MTBDRplus showed excellent pooled sensitivity and specificity for detection of resistance to rifampicin (96–100%). For iso-niazid, sensitivity of the Genotype® MTBDRplus was high (96%; 95% CI 93–98%) but it was low with the Geno-type® MTBDR test (71%; 95% CI 62–78%). The pooled specificity was excellent for both assays i.e. 100%. The Genotype® MTBDR test was designed to detect the most common mutations for INH resistance in the katG gene, and these account for 50–80% of INH resistance in M. tuberculosis [17]. The newer Genotype® MTBDRplus detects additional mutations in the katG gene and also in the inhA
promoter region for isoniazid resistance [18], leading to a higher sensitivity. Ling et al also found pooled sensitivity and specificity of 98% and 99%, respectively for rifampicin but for isoniazid sensitivity was 84%, though specificity was also 100% [29]. In their analysis, direct and indirect testing with both the old Genotype® MTBDR and The Genotype® MTBDRplus test was combined, and this could explain the higher sensitivity for detection of resist-ance to isoniazid in their study. In our study the pooled sensitivity for isoniazid resistance detection of 96% with the Genotype® MTBDRplus alone means that this test
per-Table 1: Study reports reviewed and meta-analysed or excluded
Excluded reports, and reason Test Reviewed
reports
Analysed reports
No data for 2 × 2 table
Indirect DST Diagnostic study Review study *Other reasons
NRA 22 4 0 16 0 2 0
MODS 19 6 0 2 7 1 3
Genotype®
MTBDR
13 3 1 7 0 1 1
Genotype®
MTBDRplus
10 5 0 5 0 0 0
Total 64 18 1 30 7 4 4
*Other reasons: Three MODS studies were excluded as they were either disinfection, impact on clinical decision-making or operational issues studies. The one study under Genotype MTBDR was a hetero-resistance study.
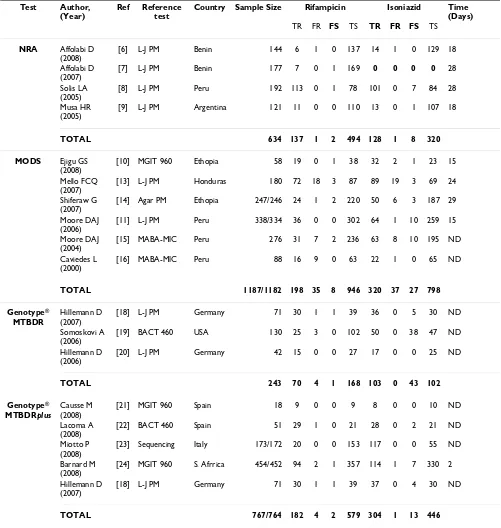
[image:4.612.58.555.102.221.2]Table 2: Description of meta-analysed reports (n = 18)
Test Author, (Year)
Ref Reference test
Country Sample Size Rifampicin Isoniazid Time (Days)
TR FR FS TS TR FR FS TS
NRA Affolabi D (2008)
[6] L-J PM Benin 144 6 1 0 137 14 1 0 129 18
Affolabi D (2007)
[7] L-J PM Benin 177 7 0 1 169 0 0 0 0 28 Solis LA
(2005)
[8] L-J PM Peru 192 113 0 1 78 101 0 7 84 28
Musa HR (2005)
[9] L-J PM Argentina 121 11 0 0 110 13 0 1 107 18
TOTAL 634 137 1 2 494 128 1 8 320 MODS Ejigu GS
(2008)
[10] MGIT 960 Ethopia 58 19 0 1 38 32 2 1 23 15
Mello FCQ (2007)
[13] L-J PM Honduras 180 72 18 3 87 89 19 3 69 24
Shiferaw G (2007)
[14] Agar PM Ethopia 247/246 24 1 2 220 50 6 3 187 29
Moore DAJ (2006)
[11] L-J PM Peru 338/334 36 0 0 302 64 1 10 259 15
Moore DAJ (2004)
[15] MABA-MIC Peru 276 31 7 2 236 63 8 10 195 ND
Caviedes L (2000)
[16] MABA-MIC Peru 88 16 9 0 63 22 1 0 65 ND
TOTAL 1187/1182 198 35 8 946 320 37 27 798 Genotype®
MTBDR
Hillemann D (2007)
[18] L-J PM Germany 71 30 1 1 39 36 0 5 30 ND
Somoskovi A (2006)
[19] BACT 460 USA 130 25 3 0 102 50 0 38 47 ND
Hillemann D (2006)
[20] L-J PM Germany 42 15 0 0 27 17 0 0 25 ND
TOTAL 243 70 4 1 168 103 0 43 102 Genotype®
MTBDRplus
Causse M (2008)
[21] MGIT 960 Spain 18 9 0 0 9 8 0 0 10 ND
Lacoma A (2008)
[22] BACT 460 Spain 51 29 1 0 21 28 0 2 21 ND
Miotto P (2008)
[23] Sequencing Italy 173/172 20 0 0 153 117 0 0 55 ND
Barnard M (2008)
[24] MGIT 960 S. Afrrica 454/452 94 2 1 357 114 1 7 330 2
Hillemann D (2007)
[18] L-J PM Germany 71 30 1 1 39 37 0 4 30 ND
TOTAL 767/764 182 4 2 579 304 1 13 446
Forest plots of sensitivity and specificity – Rifampicin phenotypic assays: 1a) Nitrate reductase assay; 1b) Microscopic Observa-tion drug susceptibility
Figure 1
Forest plots of sensitivity and specificity – Rifampicin Genotypic assays: 2a) Genotype® MTBDR; 2b) Genotype® MTBDRplus
Figure 2
Forest plots of sensitivity and specificity – Isoniazid phenotypic assays: 3a) Nitrate reductase assay; 3b) Microscopic Observa-tion drug susceptibility
Figure 3
Forest plots of sensitivity and specificity – Isoniazid Genotypic assays: 4a) Genotype® MTBDR; 4b) Genotype® MTBDRplus
Figure 4
Summary receiver operating characteristic (sROC) curves – rifampicin testing
Figure 5
Summary receiver operating characteristic (sROC) curves – isoniazid testing
Figure 6
forms excellent as a direct assay for INH as well. This is an advantage over the old Genotype® MTBDR test, and the related test – the Line Probe Assay (INNO-LiPA Rif TB Assay; Innogenetics, Ghent, Belgium), which detects mutations in only the rpoB gene for rifampicin but not iso-niazid resistance [23,24,30]
Area under the sROC curve
Estimating mean sensitivity and specificity alone without looking at the area under the sROC curve may result into underestimation of test accuracy [31]. The area under the sROC, which is also an estimate of test accuracy was almost one for each test (see figures 5 and 6), meaning that the probability of the test to correctly rank a random pair of resistant and susceptible TB would be 98–100%. The Cochrane (Q*) index, i.e. the point at which the sROC crosses the diagonal line from the left upper coordi-nate to the right bottom coordicoordi-nate was excellent for each of the four tests (see figures 5 and 6). At the Q* point, sen-sitivity is equal to specificity and the false positive rate is at the minimum [31]. With the high sensitivities, specifi-cities, area under the sROC and Q* index, the diagnostic accuracy for the direct NRA, MODS, and Genotype® MTB-DRplus assays is high.
Heterogeneity in accuracy estimates
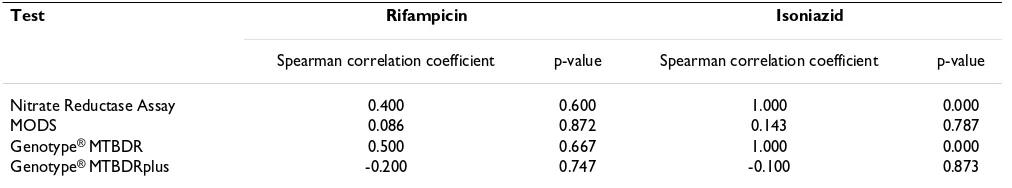
Variations caused by threshold/cut off effect are detected by a Spearman correlation coefficient between the logit of sensitivity and logit of 1-specificity with a significant p-value [27,32,33]. The Spearman correlation coefficient was not significant in most of the tests (table 3) except for the NRA and the Genotype® MTBDR assays for INH. To test for causes of variations other than threshold, visual inspection of the forest plots showed very minimal devia-tion of individual study estimates of sensitivity and specif-icity from the pooled value, except for the Genotype® MTBDR for INH. Furthermore, the MODS and the two genotypic assays showed significant p-values for the Chi-square, and a high inconsistency index for INH (see forest plots). This implies that heterogeneity in sensitivity and specificity due to chance, study design/population, and
the way a study was conducted could have caused the var-iations in the latter tests [34,35]. Since pooling sensitivity and specificity is more reliable in the absence of a thresh-old effect, the NRA and the Genotype® MTBDR assays should be primarily judged based on their areas under sROC, while the other tests can be reliably judged based on their pooled values.
Time to results (TTR)
We presented data for TTR for 100% of the DST results to permit comparison of rapidity between the different tests. For the MODS and NRA tests, the average TTR was within 23 days compared with the 2 months required for conven-tional indirect testing. Moreover, most results were ready in 7–14 days for MODS (data not shown). Contamina-tion and indeterminate results in phenotypic methods may prolong the time to the final result but this was diffi-cult to quantify in this study. For the genotypic assays, the only study that indicated TTR reported 2 days, but the pro-tocol of these genotypic assays allows DST results within 1–2 days [36]. The risk of amplicon contamination is a problem in PCR-based tests. This could prolong the time to results as repeat testing or new samples have to be ana-lysed. From this study however, it was evident that direct testing with any of the studied tests significantly shortens the time to detection of MDR TB, and would permit timely decision on patient management. This is supported by a retrospective study of the impact of direct MODS assay in a clinical setting where DST results in 82.8% of the cases were available before those of any standard method. In 41% of these cases, the rapid results should have prompted a timely modification in patient manage-ment [37].
[image:12.612.53.559.100.194.2]Even though, the potential for contamination, resulting in un-interpretable or indeterminate results in phenotypic direct tests were to be considered, the time periods shown in this study were for 100% of the results. Additionally, traditional reservations about the direct versus indirect testing pertain in part to the inability to control the inoc-ulum of a direct test. For rifampicin and isoniazid – the
Table 3: Spearman correlation coefficient Logit (sensitivity) vs Logit (1- specificity)
Test Rifampicin Isoniazid
Spearman correlation coefficient p-value Spearman correlation coefficient p-value
Nitrate Reductase Assay 0.400 0.600 1.000 0.000
MODS 0.086 0.872 0.143 0.787
Genotype® MTBDR 0.500 0.667 1.000 0.000
Genotype® MTBDRplus -0.200 0.747 -0.100 0.873
MODS = Microscopic Observation Drug Susceptibility. Note: A strong positive Spearman correlation coefficient between the logit of sensitivity and logit of 1-specificity suggests threshold/cutoff effect [27]. Since pooling sensitivity and specificity is more reliable in the absence of a threshold effect the NRA and the Genotype® MTBDR assays should be primarily judged based on their areas under sROC, while the other tests can be
two important drugs defining MDR TB, it appears that inoculum size in direct assays is not as critical as previ-ously believed. Moreover if MDR TB is identified then fur-ther DST, including second line drugs can be undertaken. It should be understood that the markedly shortened time to results with rapid direct testing is meaningless in set-tings where lengthy turn around time (TAT) is due to delays in sample delivery to the laboratory or delays in reporting the laboratory results. With that aside, it appears that the choice of which direct test to customize in a given setting will likely depend on some other operational issues such as technical ease, cost and bio safety that are briefly discussed below:
Technical ease
The NRA and MODS are technically simple to perform and do not require sophiscated equipment when com-pared with the conventional proportion method on Lowenstein-Jensen (L-J) medium. The relative complexity of the PCR-based genotypic tests compared with the NRA and MODS may be a limitation to their use in resource-limited settings (RLS). Genotypic assays require well trained manpower though this is not as critical as previ-ously believed [38]. Also required are equipment such as sonicators, thermocyclers, hybridization instruments, and a suitable laboratory infrastructure with unidirectional work flow to minimize contamination. These resources are not readily available in RLS and this could be a reason why none of the analysed genotypic studies was con-ducted in a typical RLS as shown in table 2.
Cost per test
Due to insufficient data, planned cost analysis was not performed in this study. One report indicated MODS to cost $3 per sample while another report from S. Africa suggested that direct Genotype® MTBDRplus assay would be 50% cheaper than conventional testing [12,24]. Direct testing with the MODS or the NRA is probably cheaper than molecular tests but since the time to results is short-est with genotypic assays a cost-effective analysis is war-ranted.
Bio safety
Conventional indirect testing requires sophisticated bio safety level 3 laboratories with negative pressure air flow to safely manipulate grown cultures at the time of the DST. Conversely, direct DST is less demanding and the bio safety risk is similar to that for workers doing microscopy [39]. Direct DST may safely be performed in a TB lab with N-95 masks for personal protection and a biological safety cabinet as well as a laboratory door with a locker to stop airflow turbulence [12].
Quality of analysed reports
The quality of the analysed reports was good in some but not all aspects according to QUADAS analysis [26]. Three-quarters of the study reports indicated the patient spec-trum from whom the studied samples were obtained (quality item 1), which is essential for the applicability and specificity of the results. However, few studies indi-cated the selection/sampling techniques, and those which did used mostly convenience or biased sampling, casting uncertainty about overall representativity and applicabil-ity of the results. Prospective consecutive sampling of patients to whom the test will be used is recommended for diagnostic accuracy studies seeking to recommend any new test for routine use [40]. Among all the reports, two demonstrated the recommended design and conduct of a diagnostic study, and followed the standards for reporting diagnostic accuracy studies (STARD) [11,24,41]. Quality items 3–9 which relate to the internal validity of the results were excellent across all the analysed reports. It was unclear if blinding was done or not in most studies (items 10 and 11), but un-interpretable results (item 13), a key issue in direct testing were reported in almost eighty per-cent of the studies. Quality items 12 and 14 were excluded from analysis because the studies did not have a patient follow up component.
Combining high test performance and the operational issues discussed above, direct NRA and MODS assays appear to be competing tests for TB laboratories at safety level 2 in RLS. However, it is possible that in most of such settings, laboratories are familiar with the L-J solid medium-based assays, where NRA would require only a minor adjustment to be implemented in the routines.
Other tests that have recently appeared in the literature and proposed for TB high burden RLS include the Alamar blue, MTT (3-(4,5-dimethylthiazol-2-yl)-2,5-diphe-nyltetrazolium bromide), and resazurin assays [42]. Most of these studies were performed as indirect assays. For MTT and the manual mycobacterium growth indicator tube (MGIT; Becton Dickinson, Sparks, Maryland, we came across only two direct studies under each test [43-46]. These tests were excluded from the meta-analysis because the very few study reports made it difficult to give conclusive comments on the methods.
Conclusion
Study Limitations
Few direct DST reports were available for our analysis. This could be a limitation to generalization of the findings in this study. Second, since not all the reviewed studies fulfilled the study quality items in the QUADAS tool, the results in some of the analysed reports could have affected the pooled estimates shown in this study. However, some authors simply don't report according to standards for reporting diagnostic accuracy studies (STARD) even when the studies themselves were performed well.
Competing interests
The authors declare that they have no competing interests.
Authors' contributions
All the authors planned and designed the study. FB:Retrieved and reviewed the study reports, summarized and analysed the data, and prepared the manuscript. MH:Retrieved some of the study reports and critically revised the manuscript versions. SH:Critically revised the manuscript versions. MJ:Critically revised the manuscript versions.
Acknowledgements
We thank Sida/SAREC for the financial support.
References
1. WHO: Global tuberculosis control 2008: surveillance, plan-ning, financing. Geneva, Switzerland: World Health Organi-zation; Publication no. WHO/HTM/TB/2008.393). 2008. 2. WHO/IUATLD: Global Project on Anti-Tuberculosis Drug
Resistance Surveillance: Anti-Tuberculosis drug resistance in the world, Report No.4, Annex 9. WHO/HTM/TB/ 2008.394 Geneva. 2008.
3. Blumberg HM, Burman WJ, Chaisson RE, Daley CL, Etkind SC, Fried-man LN, Fujiwara P, Grzemska M, Hopewell PC, IseFried-man MD, et al.: American Thoracic Society/Centers for Disease Control and Prevention/Infectious Diseases Society of America: treat-ment of tuberculosis. Am J Respir Crit Care Med 2003, 167(4):603-662.
4. Woods GL: Susceptibility testing for mycobacteria. Clin Infect Dis 2000, 31(5):1209-1215.
5. Angeby KA, Klintz L, Hoffner SE: Rapid and inexpensive drug sus-ceptibility testing of Mycobacterium tuberculosis with a nitrate reductase assay. J Clin Microbiol 2002, 40(2):553-555. 6. Affolabi D, Odoun M, Sanoussi N, Martin A, Palomino JC, Kestens L,
Anagonou S, Portaels F: Rapid and inexpensive detection of multidrug-resistant Mycobacterium tuberculosis with the nitrate reductase assay using liquid medium and direct appli-cation to sputum samples. J Clin Microbiol 2008, 46(10):3243-3245.
7. Affolabi D, Odoun M, Martin A, Palomino JC, Anagonou S, Portaels F: Evaluation of direct detection of Mycobacterium tuberculo-sis rifampin retuberculo-sistance by a nitrate reductase assay applied to sputum samples in Cotonou, Benin. J Clin Microbiol 2007, 45(7):2123-2125.
8. Solis LA, Shin SS, Han LL, Llanos F, Stowell M, Sloutsky A: Validation of a rapid method for detection of M. tuberculosis resistance to isoniazid and rifampin in Lima, Peru. Int J Tuberc Lung Dis
2005, 9(7):760-764.
9. Musa HR, Ambroggi M, Souto A, Angeby KA: Drug susceptibility testing of Mycobacterium tuberculosis by a nitrate reduct-ase assay applied directly on microscopy-positive sputum samples. J Clin Microbiol 2005, 43(7):3159-3161.
10. Ejigu GS, Woldeamanuel Y, Shah NS, Gebyehu M, Selassie A, Lemma E: Microscopic-observation drug susceptibility assay provides
rapid and reliable identification of MDR-TB. Int J Tuberc Lung Dis 2008, 12(3):332-337.
11. Moore DA, Evans CA, Gilman RH, Caviedes L, Coronel J, Vivar A, Sanchez E, Pinedo Y, Saravia JC, Salazar C, et al.: Microscopic-observation drug-susceptibility assay for the diagnosis of TB.
N Engl J Med 2006, 355(15):1539-1550.
12. Brady MF, Coronel J, Gilman RH, Moore DA: The MODS method-for diagnosis of tuberculosis and multidrug resistant tuber-culosis. J Vis Exp 2008, 17(17):.
13. Mello FC, Arias MS, Rosales S, Marsico AG, Pavon A, Alvarado-Galvez C, Pessoa CL, Perez M, Andrade MK, Kritski AL, et al.: Clinical eval-uation of the microscopic observation drug susceptibility assay for detection of Mycobacterium tuberculosis resist-ance to isoniazid or rifampin. J Clin Microbiol 2007, 45(10):3387-3389.
14. Shiferaw G, Woldeamanuel Y, Gebeyehu M, Girmachew F, Demessie D, Lemma E: Evaluation of microscopic observation drug sus-ceptibility assay for detection of multidrug-resistant Myco-bacterium tuberculosis. J Clin Microbiol 2007, 45(4):1093-1097. 15. Moore DA, Mendoza D, Gilman RH, Evans CA, Hollm Delgado MG,
Guerra J, Caviedes L, Vargas D, Ticona E, Ortiz J, et al.: Microscopic observation drug susceptibility assay, a rapid, reliable diag-nostic test for multidrug-resistant tuberculosis suitable for use in resource-poor settings. J Clin Microbiol 2004, 42(10):4432-4437.
16. Caviedes L, Lee TS, Gilman RH, Sheen P, Spellman E, Lee EH, Berg DE, Montenegro-James S: Rapid, efficient detection and drug susceptibility testing of Mycobacterium tuberculosis in spu-tum by microscopic observation of broth cultures. The Tuberculosis Working Group in Peru. J Clin Microbiol 2000, 38(3):1203-1208.
17. Hillemann D, Weizenegger M, Kubica T, Richter E, Niemann S: Use of the genotype MTBDR assay for rapid detection of rifampin and isoniazid resistance in Mycobacterium tubercu-losis complex isolates. J Clin Microbiol 2005, 43(8):3699-3703. 18. Hillemann D, Rusch-Gerdes S, Richter E: Evaluation of the
Geno-Type MTBDRplus assay for rifampin and isoniazid suscepti-bility testing of Mycobacterium tuberculosis strains and clinical specimens. Journal of clinical microbiology 2007, 45(8):2635-2640.
19. Somoskovi A, Dormandy J, Mitsani D, Rivenburg J, Salfinger M: Use of smear-positive samples to assess the PCR-based genotype MTBDR assay for rapid, direct detection of the Mycobacte-rium tuberculosis complex as well as its resistance to isoni-azid and rifampin. J Clin Microbiol 2006, 44(12):4459-4463. 20. Hillemann D, Rusch-Gerdes S, Richter E: Application of the
Gen-otype MTBDR assay directly on sputum specimens. Int J Tuberc Lung Dis 2006, 10(9):1057-1059.
21. Causse M, Ruiz P, Gutierrez JB, Zerolo J, Casal M: Evaluation of new GenoType MTBDRplus for detection of resistance in cultures and direct specimens of Mycobacterium tuberculo-sis. Int J Tuberc Lung Dis 2008, 12(12):1456-1460.
22. Lacoma A, Garcia-Sierra N, Prat C, Ruiz-Manzano J, Haba L, Roses S, Maldonado J, Dominguez J: GenoType MTBDRplus assay for molecular detection of rifampin and isoniazid resistance in Mycobacterium tuberculosis strains and clinical samples. J Clin Microbiol 2008, 46(11):3660-3667.
23. Miotto P, Piana F, Cirillo DM, Migliori GB: Genotype MTBDRplus: a further step toward rapid identification of drug-resistant Mycobacterium tuberculosis. J Clin Microbiol 2008, 46(1):393-394.
24. Barnard M, Albert H, Coetzee G, O'Brien R, Bosman ME: Rapid molecular screening for multidrug-resistant tuberculosis in a high-volume public health laboratory in South Africa. Am J Respir Crit Care Med 2008, 177(7):787-792.
25. Lijmer JG, Mol BW, Heisterkamp S, Bonsel GJ, Prins MH, Meulen JH van der, Bossuyt PM: Empirical evidence of design-related bias in studies of diagnostic tests. Jama 1999, 282(11):1061-1066. 26. Whiting P, Rutjes AW, Reitsma JB, Bossuyt PM, Kleijnen J: The
development of QUADAS: a tool for the quality assessment of studies of diagnostic accuracy included in systematic reviews. BMC Med Res Methodol 2003, 3:25.
Publish with BioMed Central and every scientist can read your work free of charge "BioMed Central will be the most significant development for disseminating the results of biomedical researc h in our lifetime."
Sir Paul Nurse, Cancer Research UK
Your research papers will be:
available free of charge to the entire biomedical community
peer reviewed and published immediately upon acceptance
cited in PubMed and archived on PubMed Central
yours — you keep the copyright
Submit your manuscript here:
http://www.biomedcentral.com/info/publishing_adv.asp
BioMedcentral
28. Martin A, Panaiotov S, Portaels F, Hoffner S, Palomino JC, Angeby K: The nitrate reductase assay for the rapid detection of isoni-azid and rifampicin resistance in Mycobacterium tuberculo-sis: a systematic review and meta-analysis. J Antimicrob Chemother 2008, 62(1):56-64.
29. Ling DI, Zwerling AA, Pai M: GenoType MTBDR assays for the diagnosis of multidrug-resistant tuberculosis: a meta-analy-sis. Eur Respir J 2008, 32(5):1165-1174.
30. Morgan M, Kalantri S, Flores L, Pai M: A commercial line probe assay for the rapid detection of rifampicin resistance in Mycobacterium tuberculosis: a systematic review and meta-analysis. BMC Infect Dis 2005, 5:62.
31. Irwig L, Tosteson AN, Gatsonis C, Lau J, Colditz G, Chalmers TC, Mosteller F: Guidelines for meta-analyses evaluating diagnos-tic tests. Ann Intern Med 1994, 120(8):667-676.
32. Littenberg B, Moses LE: Estimating diagnostic accuracy from multiple conflicting reports: a new meta-analytic method.
Med Decis Making 1993, 13(4):313-321.
33. Moses LE, Shapiro D, Littenberg B: Combining independent stud-ies of a diagnostic test into a summary ROC curve: data-ana-lytic approaches and some additional considerations. Stat Med 1993, 12(14):1293-1316.
34. Lijmer JG, Bossuyt PM, Heisterkamp SH: Exploring sources of het-erogeneity in systematic reviews of diagnostic tests. Stat Med
2002, 21(11):1525-1537.
35. Walter SD: Properties of the summary receiver operating characteristic (SROC) curve for diagnostic test data. Stat Med 2002, 21(9):1237-1256.
36. GenoType MTBDRplus, version 1.0 [http://www.hain-lifesci ence.com/pdf/304xx_pbl.pdf]
37. Nic Fhogartaigh CJ, Vargas-Prada S, Huancare V, Lopez S, Rodriguez J, Moore DA: Physician-initiated courtesy MODS testing for TB and MDR-TB diagnosis and patient management. Int J Tuberc Lung Dis 2008, 12(5):555-560.
38. Quezada CM, Kamanzi E, Mukamutara J, De Rijk P, Rigouts L, Portaels F, Amor YB: Implementation validation performed in Rwanda to determine whether the INNO-LiPA Rif.TB line probe assay can be used for detection of multidrug-resistant Myco-bacterium tuberculosis in low-resource countries. J Clin Micro-biol 2007, 45(9):3111-3114.
39. Kim SJ, Lee SH, Kim IS, Kim HJ, Kim SK, Rieder HL: Risk of occupa-tional tuberculosis in Naoccupa-tional Tuberculosis Programme lab-oratories in Korea. Int J Tuberc Lung Dis 2007, 11(2):138-142. 40. Pepe M: Study design and Hypothesis testing. In The Statistical
Evaluation of Medical Tests for Classification and PredictionVolume Chap-ter 8. Edited by: Pepe MS. Oxford Statistical Science Series, Oxford University Press, USA; 2004:218.
41. Bossuyt PM, Reitsma JB, Bruns DE, Gatsonis CA, Glasziou PP, Irwig LM, Moher D, Rennie D, de Vet HC, Lijmer JG: The STARD state-ment for reporting studies of diagnostic accuracy: explana-tion and elaboraexplana-tion. Ann Intern Med 2003, 138(1):W1-12. 42. Martin A, Portaels F, Palomino JC: Colorimetric redox-indicator
methods for the rapid detection of multidrug resistance in Mycobacterium tuberculosis: a systematic review and meta-analysis. J Antimicrob Chemother 2007, 59(2):175-183.
43. Abate G, Aseffa A, Selassie A, Goshu S, Fekade B, WoldeMeskal D, Miorner H: Direct colorimetric assay for rapid detection of rifampin-resistant Mycobacterium tuberculosis. J Clin Micro-biol 2004, 42(2):871-873.
44. WoldeMeskel D, Abate G, Lakew M, Goshu S, Selassie A, Miorner H, Aseffa A: Evaluation of a direct colorimetric assay for rapid detection of rifampicin resistant Mycobacterium tuberculo-sis. Ethop J Health Dev 2005, 19(1):51-54.
45. Goloubeva V, Lecocq M, Lassowsky P, Matthys F, Portaels F, Bastian I: Evaluation of mycobacteria growth indicator tube for direct and indirect drug susceptibility testing of Mycobacte-rium tuberculosis from respiratory specimens in a Siberian prison hospital. J Clin Microbiol 2001, 39(4):1501-1505.
46. El-Sayed Zaki M, Goda T: Rapid phenotypic assay of antimyco-bacterial susceptibility pattern by direct mycobacteria growth indicator tube and phage amplified biological assay compared to BACTEC 460 TB. Tuberculosis (Edinb) 2007, 87(2):102-108.
Pre-publication history
The pre-publication history for this paper can be accessed here: