R E S E A R C H
Open Access
Utility of neuron-specific enolase in
traumatic brain injury; relations to S100B
levels, outcome, and extracranial injury
severity
Eric Peter Thelin
1*†, Emma Jeppsson
1†, Arvid Frostell
1, Mikael Svensson
1,2, Stefania Mondello
3,
Bo-Michael Bellander
1,2and David W. Nelson
4Abstract
Background:In order to improve assessment and outcome prediction in patients suffering from traumatic brain
injury (TBI), cerebral protein levels in serum have been suggested as biomarkers of injury. However, despite much investigation, biomarkers have yet to reach broad clinical utility in TBI. This study is a 9-year follow-up and clinical experience of the two most studied proteins, neuron-specific enolase (NSE) and S100B, in a neuro-intensive care TBI population. Our aims were to investigate to what extent NSE and S100B, independently and in combination, could predict outcome, assess injury severity, and to investigate if the biomarker levels were influenced by extracranial factors.
Methods:All patients treated at the neuro-intensive care unit at Karolinska University Hospital, Stockholm, Sweden between 2005 and 2013 with at least three measurements of serum S100B and NSE (sampled twice daily) were retrospectively included. In total, 417 patients fulfilled the criteria. Parameters were extracted from the computerized hospital charts. Glasgow Outcome Score (GOS) was used to assess long-term functional outcome. Univariate, and multivariate, regression models toward outcome and what explained the high levels of the biomarkers were performed. Nagelkerke’s pseudo-R2was used to illustrate the explained variance of the different models. A sliding window assessed biomarker correlation to outcome and multitrauma over time.
Results:S100B was found a better predictor of outcome as compared to NSE (area under the curve (AUC) samples,
the first 48 hours had Nagelkerke’s pseudo-R2values of 0.132 and 0.038, respectively), where the information content of S100B peaks at approximately 1 day after trauma. In contrast, although both biomarkers were
independently correlated to outcome, NSE had limited additional predictive capabilities in the presence of S100B in multivariate models, due to covariance between the two biomarkers (correlation coefficient 0.673 for AUC
48 hours). Moreover, NSE was to a greater extent correlated to multitrauma the first 48 hours following injury, whereas the effect of extracerebral trauma on S100B levels appears limited to the first 12 hours.
Conclusions:While both biomarkers are independently correlated to long-term functional outcome, S100B is found
a more accurate outcome predictor and possibly a more clinically useful biomarker than NSE for TBI patients.
(Continued on next page)
* Correspondence:eric.thelin@ki.se †Equal contributors
1
Department of Clinical Neuroscience, Karolinska Institutet, Stockholm, Sweden
Full list of author information is available at the end of the article
(Continued from previous page)
Keywords:Traumatic brain injury, Biomarkers, S100B, Neuron-specific enolase, Outcome
Abbreviations:AIS, Abbreviated Injury Score; AUC, Area under the curve; CPP, Cerebral perfusion pressure; CT, Computed tomography; GFAP, Glial fibrillary acidic protein; GCS, Glasgow Coma Scale; GOS, Glasgow Outcome Score; ICP, Intracranial pressure; NF-L, Neurofilament light; NICU, Neuro-intensive care unit; NSE, Neuron-specific enolase; SAH, Subarachnoid hemorrhage; TBI, Traumatic brain injury; UCH-L1, Ubiquitin C-terminal hydrolase L1
Background
Worldwide, traumatic brain injury (TBI) is a major cause of death and disability with an estimate of 10 million affected annually, among whom many survive but with lifelong disabilities [1]. Due to sociodemographic changes, the burden of TBI is changing more from the young to the already frail elderly, with increasing costs for society [2, 3]. Patients suffering from severe TBI are, often following neurosurgical intervention, usually se-dated and treated in neuro-intensive care units (NICU) where they are monitored and treated in order to optimize intracranial conditions and facilitate recovery. Parameters such as intracranial pressure (ICP) [4], me-tabolism (using microdialysis monitoring) [5], and brain oxygen saturation [6] are monitored and changes may prompt responses in treatment strategies. Unfortunately, many TBI patients still suffer from secondary insults that may result in persistent secondary injuries [7, 8]. Thus, better monitoring, outcome prediction, and injury stratification is necessary in order to optimize resource allocation, to guide treatment, and to prevent further deterioration.
In order to facilitate this, serum biomarkers have been introduced in the field of TBI, where the proteins S100B and neuron-specific enolase (NSE) are the most studied [9]. S100B is a calcium-binding protein present primarily in the cytoplasm of mature perivascular astrocytes [10]. Increased serum levels of S100B in serum have been correlated to pathology on computed tomography (CT) scans in mild TBI [11], to unfavorable long-term functional outcome following moderate-to-severe TBI [12–14] and may indicate a development of secondary injuries in TBI patients [15, 16]. However, S100B is also present in other nonneuronal tissue, primarily in mela-nocytes, adipose tissue, cartilage, bone, liver, and myo-cytes [17]. NSE is an enzyme involved in glycolysis in both neuronal cells and erythrocytes, and elevated serum levels have been shown to correlate to unfavorable out-come and clinical complications in the NICU [18–21]. Biomarkers have the advantage of being more “global” monitoring markers of brain injury than microdialysis and oxygen saturation, which only detects changes in a limited cerebral region. However, neither S100B or NSE are 100 % brain specific, and extracranial sources will contribute to total serum levels if patients suffer from
severe multitrauma or, in the case of NSE, hemolysis [22–27]. In aggregate, while both S100B and NSE shows promising results as predictive markers of outcome and brain injury severity, they appear to be nonspecific to TBI and the effect of this on their interpretation needs to more thoroughly investigated.
The timing of S100B sampling in relation to that of the trauma plays a crucial role when it is used to predict long-term outcome, and several current studies suggest that samples acquired hours or even days after trauma are better for outcome prediction than samples acquired at admission [12, 18, 28, 29]. In contrast, less is known about how the predictive power of NSE changes over time [18]. The serum half-life for S100B, without cere-bral contribution, is considered to be around 25 minutes while that of NSE is 30 hours [24, 30], which theoretic-ally should influence outcome predictive capabilities and optimal timing of sampling.
At our institution, we have sampled both S100B and NSE routinely since 2005 resulting in an extensive data-base comprising, to our knowledge, the largest clinical set of NSE and S100B in TBI patients to date.
Methods
Aims
The primary aim of this study was to assess how serum NSE, independently and together with S100B, correlated to long-term functional outcome. As a secondary aim, we investigated how multitrauma and other factors in-fluenced the biomarker levels over time.
Study design
samples within 72 hours after trauma. Moreover, the ad-mission CT scan had to be available and the long-term functional outcome had to be evaluated≥3 months after the trauma. Parts of this patient material have been used in three previous publications by our group, then focus-ing on S100B and neurofilament light [12, 15, 31].
Treatment
At our NICU, we adhere to guidelines similar to that of the Brain Trauma Foundation [32, 33]. If mass lesions are present, they are evacuated if deemed appropriate by the attending neurosurgeon. To measure intracranial pressure (ICP), ventricular catheters were predominantly used, even if other pressure devices were sometimes uti-lized (Codman Neuro, DePuy Synthes Companies of Johnson & Johnson, New Brunswick, NJ, USA or Rehau AG & Co, Bern, Germany). The ICP was targeted below the threshold of 20 mmHg. The head of the patients was elevated at a 30-degree angle with the measuring device set at the temple. In case of intracranial hypertension or autonomic dysfunction, cerebral perfusion pressure (CPP) was used to guide treatment, targeted at 50–70 mmHg calculated by using mean arterial pressure (MAP) –ICP. CPP control was obtained by using vasopressors or intra-vascular infusions. Unconscious patients were intubated, mechanically ventilated, and anesthetized with morphine, propofol, or midazolam. For patients with refractory high ICP, barbiturate coma (monitored and limited by burst-suppression on electroencephalogram) or hemicraniect-omy was performed. Patients with traumatic subarachnoid hemorrhage (trSAH) were monitored with transcranial doppler and if signs of vasospasms were detected, treated with intravascular infusion of the calcium antagonist nimodipine [34]. Body temperature was targeted at 36–37 °C, regulated predominantly with paracetamol, and occasionally parecoxib or Thermowrap® treatment (MTRE Advanced Technologies Ltd., Yavne, Israel).
Clinical parameters
Scene-of-accident hypoxemia was defined as an oxygen saturation <90 % and hypotension as a systolic blood pressure <90 mmHg. Age and gender were noted. Multi-trauma was defined according to Advanced Trauma and Life Support (ATLS) guidelines, with a trauma to any other organ apart from head or cervical injuries [35]. In contrast to the Abbreviated Injury Score (AIS) [36], it provides a cruder measurement of extracranial trauma. However, as AIS is a product of events during the hos-pital stay, we believe this to be a more accurate defin-ition in the emergency setting. Admission glucose and hemoglobin were recorded. If fluids had been provided in the prehospital setting, hemoglobin levels at the scene of accident were used, if available. Glasgow Coma Scale (GCS) [37] was assessed at hospital admission and was
used as a continuous variable as previously described [38, 39]. Pupil responsiveness was assessed as either both responsive, unilateral unresponsive or bilateral unre-sponsive. The maximum AIS score for the head injury was noted for each patient after discharge, assessed by nurses with special training in AIS grading [36].
Neuroradiology
The admission CT scan was assessed according to the Marshall Classification [40], as well as the Rotterdam and Stockholm CT score [41, 42], by a person blinded to other clinical data. The Marshall classification is more focused on the type of injury while the Rotterdam and Stockholm CT scores focus on parameters correlated to outcome. The Stockholm CT score has a subcomponent of assessing the degree of subarachnoid hemorrhage (Stockholm SAH), which was also used in isolation in the analyses. The time from reported trauma to CT examination was noted.
S100B and NSE analyses
As per clinical protocol since 2005, all TBI patients in our NICU have S100B and NSE sampled at admission and twice daily (06:00 and 18:00). From 2005 up until September 2008, the serum samples of S100B were ana-lyzed at the Department of Clinical Chemistry, Karo-linska University Hospital (fully blinded from any patient characteristic), using a quantitative automated immunoassay (LIAISON, DiaSorin, Saluggia, Italy). After that, the department changed method to an automated electrochemoluminescence assay (Modular E170, Elecsys, Roche Diagnostics, Basel, Switzerland) throughout the study period. S100B has been shown not to be signifi-cantly influenced by sample hemolysis [25].
NSE was analyzed throughout the whole period at the Department of Clinical Chemistry, Karolinska University Hospital, using a quantitative automated immunoassay (LIAISON, DiaSorin, Saluggia, Italy). Samples were not analyzed if the amount of hemoglobin exceeded 0.5 g/L which was assessed visually using a hemolysis scale. If the laboratory personnel determined that the amount of hemoglobin exceeded 0.5 g/L, the sample was discarded. The NSE samples were acquired simultaneously as S100B.
functional sensitivity) has been shown to be 0.02 μg/L and 0.04 μg/L for S100B and NSE on the LIAISON, respectively, as well as <0.02 μg/L on the Elecsys assay, while lower concentrations sometimes also yield accept-able coefficients of variation [43–45]. Thus, all detection and quantification limits were lower than what were detected in our patient material, and we do not believe that the quantification range of the assays significantly altered our findings. The reference levels for healthy controls are generally considered to be <0.1 μg/L for S100B [11] and <13μg/L for NSE [46], respectively.
Long-term functional outcome
At our institution, the five-step Glasgow Outcome Score (GOS) [47] is assessed at discharge, after 3–6 months as the patient visits the operating physician in the clinic or at the rehabilitation facility and after 12 months through a questionnaire regarding quality of life. GOS1 = dead, GOS2 = vegetative state, GOS3 = severe, dependent state, GOS4 = moderately recovered, independent state and GOS5 = good recovery. The latest available GOS was used and surviving patients with GOS evaluation <3 months after trauma were excluded.
Statistical analysis
The collected data are presented as median and inter-quartile range (IQR) for continuous data and grouped for categorical data. Several parameters were not nor-mally distributed, including the biomarkers, and were logged to approach to normal distribution. In univariate logistic regression toward outcome (“rms”package in R), the parameters were analyzed individually versus either GOS1–5 (proportional odds analysis), GOS1–3 (unfavor-able) versus GOS4–5 (favorable), or GOS1 (dead) versus GOS2–5 (alive). A step-up multivariate analysis was used to determine if different parameters added signifi-cantly explained the variance to the different models. We included the same parameters that are used in the Inter-national Mission for Prognosis and Analysis of Clinical Trials in TBI (IMPACT) calculator to determine long-term functional outcome after TBI [48]. Nagelkerke’s pseudo-R2was used to determine model accuracy of bino-mial and proportional odds analyses models and adjusted R2that of linear correlations, where appropriate. A sliding window assessing a proportional odds analysis of S100B and NSE toward GOS with bootstrapped confidence inter-vals used to explore prediction accuracy over time in rela-tion to the trauma. The same approach was used to assess how multitrauma influenced S100B and NSE levels over time. The R package “ggplot2” was used to illustrate the data [49]. Linear models were used to determine what factors that contributed both in univariate and in multi-variate analyses to the levels of NSE and S100B, and the resulting adjusted R2 was provided. The statistical
program R was used in the analyses (RStudio version 0.99.486 using version 3.2.2 of R, Boston, MA, USA) [50]. Apvalue of <0.05 was considered significant.
Missing data
Univariate regression models toward outcome are shown for un-imputed data. Multivariate prediction models were performed using the Multiple Imputation (MI) (MICE package, R), as advocated in the statistical litera-ture [51] and suggested by the IMPACT TBI study group [52]. MI commonly uses seven imputed sets of data, where the imputed data comes from a regression and each imputed data differs - drawn from a distribu-tion. The purpose of this is to retain the uncertainty caused by imputation in the analyses. This method has been shown to handle up to 50 % imputed data with limited introduction of bias. Unfortunately, AIS grading started in January 2006 at our institution so this infor-mation was not available for patients in 2005 (n= 72) and was among the data that was more highly imputed, and will due to the time component, to some extent, violate the missing at random assumption.
Results
Patient characteristics
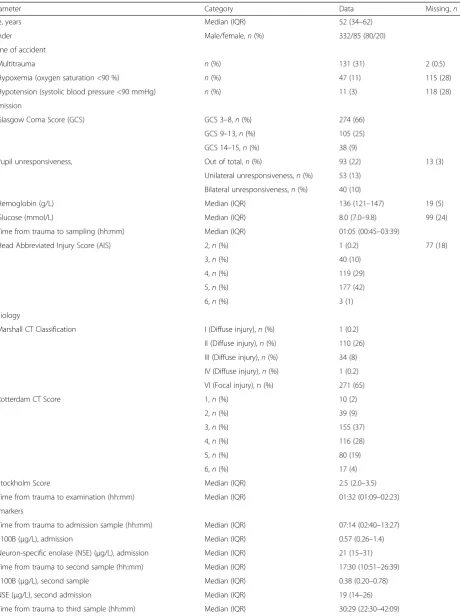
Out of 1128 patients, 417 patients fulfilled the inclusion criteria. A majority of the excluded patients did not have enough samples (n= 593), while some were <18 years old (n= 47), had too early a GOS assessment (n= 35), had missing time of trauma (n = 31), or an admission CT scan from another primary hospital that could not be obtained (n= 5). Among the 593 patients with too few samples, 24 patients were excluded due to early death. Patient demographics are illustrated in Table 1. Our inclusion criteria excluding patients with short ICU stay and predominantly higher GCS patients rendered almost all eligible patients to be classified as Head AIS ≥3, or a “serious” TBI, which coincided with that a majority also were unconscious at admission to the hos-pital (GCS3–8, 66 %). “Diffuse injury”, according to the Marshall CT classification, was present in 35 %, while 65 % had injuries >25 mL (“focal injury”, grade VI). Al-most 20 % of the patients had hemolysis in their NSE samples the first 72 hours. Outcome was assessed at ap-proximately 1 year in a majority of cases (median days from trauma = 368), and was almost equally distributed between favorable (GOS4–5) (n= 214, 51 %) and unfavor-able (GOS1–3) (n= 203, 49 %). The mortality rate of the included patients was 20 %.
Univariate analyses toward long-term outcome
Table 1Patient demographics
Parameter Category Data Missing,n(%)
Age, years Median (IQR) 52 (34–62)
Gender Male/female,n(%) 332/85 (80/20)
Scene of accident
Multitrauma n(%) 131 (31) 2 (0.5)
Hypoxemia (oxygen saturation <90 %) n(%) 47 (11) 115 (28)
Hypotension (systolic blood pressure <90 mmHg) n(%) 11 (3) 118 (28)
Admission
Glasgow Coma Score (GCS) GCS 3–8,n(%) 274 (66)
GCS 9–13,n(%) 105 (25)
GCS 14–15,n(%) 38 (9)
Pupil unresponsiveness, Out of total,n(%) 93 (22) 13 (3)
Unilateral unresponsiveness,n(%) 53 (13)
Bilateral unresponsiveness,n(%) 40 (10)
Hemoglobin (g/L) Median (IQR) 136 (121–147) 19 (5)
Glucose (mmol/L) Median (IQR) 8.0 (7.0–9.8) 99 (24)
Time from trauma to sampling (hh:mm) Median (IQR) 01:05 (00:45–03:39)
Head Abbreviated Injury Score (AIS) 2,n(%) 1 (0.2) 77 (18)
3,n(%) 40 (10)
4,n(%) 119 (29)
5,n(%) 177 (42)
6,n(%) 3 (1)
Radiology
Marshall CT Classification I (Diffuse injury),n(%) 1 (0.2)
II (Diffuse injury),n(%) 110 (26)
III (Diffuse injury),n(%) 34 (8)
IV (Diffuse injury),n(%) 1 (0.2)
VI (Focal injury), n (%) 271 (65)
Rotterdam CT Score 1,n(%) 10 (2)
2,n(%) 39 (9)
3,n(%) 155 (37)
4,n(%) 116 (28)
5,n(%) 80 (19)
6,n(%) 17 (4)
Stockholm Score Median (IQR) 2.5 (2.0–3.5)
Time from trauma to examination (hh:mm) Median (IQR) 01:32 (01:09–02:23)
Biomarkers
Time from trauma to admission sample (hh:mm) Median (IQR) 07:14 (02:40–13:27)
S100B (μg/L), admission Median (IQR) 0.57 (0.26–1.4)
Neuron-specific enolase (NSE) (μg/L), admission Median (IQR) 21 (15–31)
Time from trauma to second sample (hh:mm) Median (IQR) 17:30 (10:51–26:39)
S100B (μg/L), second sample Median (IQR) 0.38 (0.20–0.78)
NSE (μg/L), second admission Median (IQR) 19 (14–26)
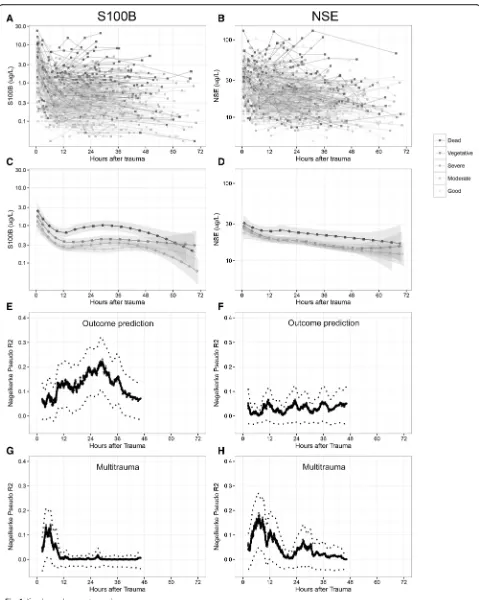
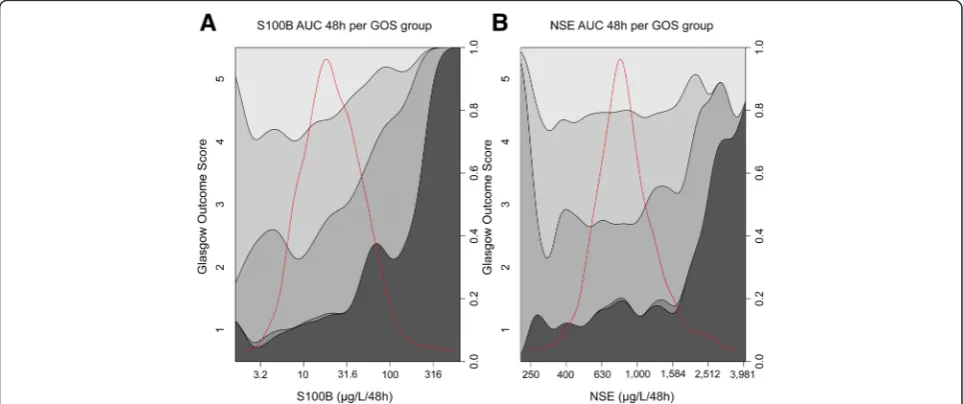
S100B AUC 48 h exhibited a pseudo-R2of 0.132, on par with Stockholm CT score and surpassed only by age (0.151). S100B showed better discrimination between all the different dichotomizations of outcome, whereas NSE is best at differentiating mortality (GOS1 vs. 2–5). The values of S100B and NSE over time for individual pa-tients are shown in Fig. 1. In general, high or increasing levels are more correlated to a more unfavorable out-come, something that is better visualized for S100B (Fig. 1a) than for NSE (Fig. 1b). Similar to what was seen in Table 2, when the biomarker levels for the specific outcome groups were aggregated, S100B exhibits better discrimination between different levels of GOS, espe-cially 24–36 hours after trauma (Fig. 1c), while NSE was only discriminates GOS1 as compared to GOS3–5 (Fig. 1d). GOS2 was excluded in Fig. 1c-d since only two patients were assessed as vegetative at long-term follow-up. S100B AUC 48 h (Fig. 2a) and NSE AUC 48 h (Fig. 2b) highlights the biomarker levels in different GOS groups, using conditional density plots (Fig. 2).
Optimal time point for outcome prediction
A sliding window using a proportional odds analysis to-ward GOS1–5 indicated that the level of S100B’s relation to outcome increased substantially after 12 hours (as previously described [12]) and reached a pseudo-R2 of >0.25 at approximately 30 hours (Fig. 1e), coinciding with the mean peak time of the extended release of S100B in TBI patients at 27 hours (accepted manu-script). In contrast, an optimal time point for sampling NSE in relation to outcome could not be identified and remained low, <0.1 pseudo-R2 (Fig. 1f ), at all time points. Additionally, the effect of multitrauma on bio-marker levels over time was explored in the same man-ner with a sliding window, revealing that the effect of multitrauma is limited to the first 12 hours for S100B,
but is more pronounced and extended for NSE, (Fig. 1g and h) clearly indicating a risk of late confounding using this biomarker.
Multivariate prediction models toward long-term func-tional outcome
A Core model was created using the parameters used in the IMPACT calculator (using the Rotterdam CT score instead of individual CT parameters) [48] (Table 3). This exhibited a pseudo-R2of 0.298 in prediction of GOS1–5. As the Stockholm CT score constituted a higher pseudo-R2 in univariate models, it replaced the Rotterdam CT score in our Core model, which thus yielded a total pseudo-R2of 0.316. AUC levels of the biomarkers were used. If S100B AUC was added to the Core model, a pseudo-R2of 0.379 was reached, significantly better than the Core model (p<0.001). A similar significant increase was seen if NSE AUC was added per se, albeit less than S100B (0.379 vs 0.344 respectively). A glial:neuronal ra-tio between S100B:NSE (S100B AUC/NSE AUC) did not increase the explained variance as compared to if S100B was used alone (pseudo-R20.365). If a prediction model consisted of Core parameters + S100B, NSE did not en-hance outcome prediction (p= 0.934). Age, pupil respon-siveness, GCS, and Stockholm CT score remained independently correlated to outcome in all models while glucose levels, hemoglobin levels, and hypoxemia con-tributed independently variably in models. In aggregate, the Core model with the addition of S100B AUC was the best predictive model.
Correlation between S100B and NSE levels
[image:6.595.56.540.100.270.2]Admission levels of logged S100B and NSE were signifi-cantly correlated with a correlation coefficient of 0.673 (p <0.001, R2 0.45). A weaker correlation was seen for
Table 1Patient demographics(Continued)
S100B (μg/L), third sample Median (IQR) 0.32 (0.15–0.74)
NSE (μg/L), third admission Median (IQR) 17 (12–24)
Patients with NSE hemolysis the first 72 hours n(%) 75 (18)
Outcome
Time to outcome assessment in surviving patients (days) Median (IQR) 368 (339–397)
Glasgow Outcome Score (GOS) GOS1,n(%) 85 (20)
GOS2,n(%) 2 (0.5)
GOS3,n(%) 116 (28)
GOS4,n(%) 126 (30)
GOS5,n(%) 88 (21)
GOS1–3 (Unfavorable),n(%) 203 (49)
GOS4–5 (Favorable),n(%) 214 (51)
logged AUC levels the first 48 hours after trauma, yield-ing a correlation coefficient of 0.613 (p<0.001, R20.38).
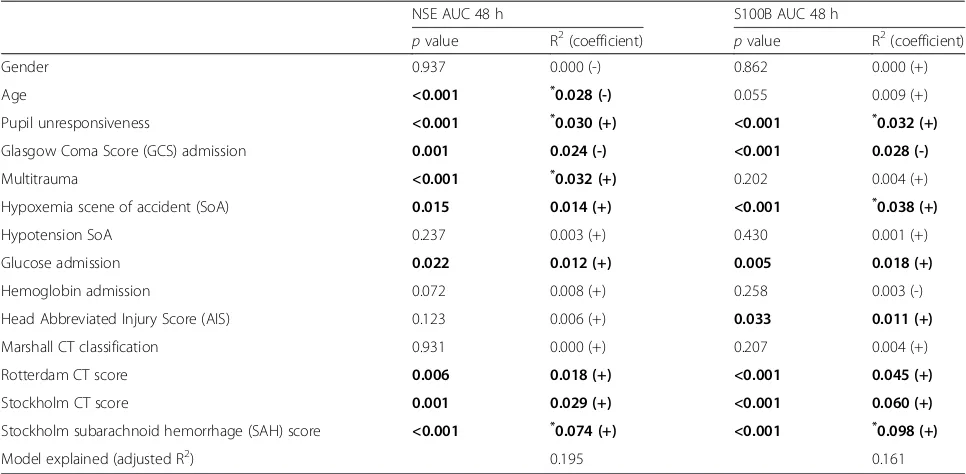
Parameters correlated to S100B and NSE levels
A univariate analysis revealed that several parameters were significantly correlated to the levels of NSE and S100B, as illustrated by Table 4. For multivariate ana-lysis, the Stockholm SAH score was used instead of Stockholm CT score, as it provided a higher R2. Several parameters were independently correlated to NSE levels, while only pupil unresponsiveness, hypoxemia, and higher Stockholm SAH score independently predicted S100B levels. Admission levels for NSE and S100B exhibited a different profile, with no intracranial CT parameter being significantly correlated to NSE and
multitrauma being positively correlated to S100B (data not shown). Using all parameters, including intracranial variables, the best model explained 0.195 adjusted-R2of NSE and 0.161 of S100B, thus concluding that much of the variance remains unaccounted.
Discussion
To our knowledge, this is the largest retrospective TBI outcome study including S100B and NSE samples to date. Moreover, by combining the two proteins in the analyses, it provides a unique opportunity to elucidate the properties and clinical utility of these biomarkers. Doing this we found that both NSE and S100B levels, per se, independently correlate to long-term functional outcome in univariate and multivariate models, albeit Table 2Univariate outcome prediction
GOS 1–5 (proportional odds analysis)
pvalue Nagelkerke’s pseudo-R2(coefficient)
Gender (female) 0.760 0.000 (-)
Age <0.001 0.151 (-, higher age = lower GOS)
Pupil unresponsiveness <0.001 0.074 (-, if present = lower GOS)
Glasgow Coma Score (GCS) <0.001 0.070 (+, higher GCS = higher GOS)
Multitrauma 0.867 0.000 (+)
Hypoxemia 0.040 0.015 (-)
Hypotension 0.494 0.002 (-)
Glucose 0.010 0.022 (-)
Hemoglobin <0.001 0.044 (+)
Head Abbreviated Injury Score (AIS) 0.002 0.029 (-)
Marshall 0.190 0.004 (-)
Rotterdam <0.001 0.048 (-)
Stockholm <0.001 0.132 (-)
Stockholm subarachnoid hemorrhage (SAH) <0.001 0.079 (-)
S100B admission (log) <0.001 0.051 (-)
Neuron-specific enolase (NSE) admission (log) 0.025 0.013 (-)
S100B area under the curve (AUC) 48 h (log) <0.001 0.132 (-)
NSE AUC 48 h (log) 0.001 0.038 (-)
GOS 1–3 vs 4–5 (bivariate regression analysis)
S100B admission (log) <0.001 0.061 (-)
NSE admission (log) 0.096 0.009 (-)
S100B AUC 48 h (log) <0.001 0.127 (-)
NSE AUC 48 h (log) 0.002 0.032 (-)
GOS 1 vs 2–5 (bivariate regression analysis)
S100B admission (log) 0.001 0.054 (-)
NSE admission (log) 0.008 0.027 (-)
S100B AUC 48 h (log) <0.001 0.179 (-)
[image:7.595.59.539.100.520.2]NSE AUC 48 h (log) <0.001 0.077 (-)
Table illustrating different un-imputed parameters versus different outcome dichotomizations. Nagelkerke’s pseudo-R2
S100B providing significantly more accuracy. While pa-tients with favorable outcome have low and rapidly de-creasing levels, S100B and NSE levels in patients with unfavorable outcome remain elevated during a longer period of time, presumably indicating an ongoing cere-bral injury. However, in combination NSE did not pro-vide any additional independent information toward long-term outcome over S100B. The cause of this is that despite their neuronal versus glial origin, a high covari-ance between the two biomarkers is seen. Additionally, NSE only discriminates mortality, while S100B provides predictive ability at all levels of GOS. While S100B in-creased its predictive capabilities if sampled 12–30 h after trauma, NSE’s predictive capabilities remained low at all time points, possibly due to a greater influence by multitrauma or other non-brain contributors to total serum levels such as hemolysis of erythrocytes ex vivo. In aggregate, our study suggests a greater clinical utility of S100B over NSE.
We chose to include all TBI patients that were deemed to be in need of neuro-intensive care at admission to the hospital, and not necessarily patients that were uncon-scious (GCS 3–8), which are usually grouped together when stratifying TBI patients, and is something that could be considered a limitation. However, there is a strong opinion in the TBI community today that using a symptom to include TBI patients in studies is inad-equate. A major conclusion of the IMPACT group was that GCS inclusion criterion could be a contributor to the many negative clinical trials in the field [53]. This is exemplified in our study, as several of our moderate-to-mild patients (GCS 9–15) at admission presented “ ser-ious”, “severe” or even “critical” injuries according to their Head AIS scores. Moreover, GCS is also hazardous due its subjective nature [54], as well as its influence from drugs, ethanol, and sedative agents [55, 56]. In ag-gregate, we deem that the best inclusion criteria is the one that is currently used, i.e., that patients who the
(See figure on previous page.)
Fig. 1aandbillustrate every patient as an individual line with the biomarker S100B (a) and neuron-specific enolase (NSE) (b) on the y-axis and time after trauma on the x-axis (hours). Colors are corresponding to outcome with darker color indicating a worse outcome, which becomes more favorable as it gets lighter.canddare averages of the different GOS groups. As is shown by (aandb), there is limited data after 48 hours so it should be interpreted with caution.eandfare line plots indicating when to sample a biomarker after trauma to achieve maximum outcome prediction to long-term GOS1–5. The x-axis shows when in time since the trauma the sample of S100B (e) and NSE (f) was acquired (hours). The y-axis represents the Nagelkerke’s pseudo-R2of a prediction model (proportional odds) toward GOS1–5, using either logged S100B (e) or NSE (f). The pseudo-R2is calculated in each point using a sliding window incorporating 200 data points in chronological order. If a patient is represented more than once the sample is averaged, thus retaining independent points. The graph stops at approximately 48 hours as the later data points will be included in that final measurement. The line represents a locally weighted scatterplot smoothing (LOWESS), which is a nonlinear regression of the data points in the plots, a bootstrap confidence interval using two standard deviations is provided. Finally, in (gandh), which use the same method as in (eandf), but here the explained variance (y-axis) is how well the presence of extracranial multitrauma explains the levels of S100B (g) and NSE (h)
[image:9.595.57.539.491.693.2]attending neurosurgeon deem will be in need of neuro-intensive care and intracranial monitoring for intracra-nial injuries, and that this represents a clinically valid NICU TBI patient cohort.
Outcome prediction using S100B and NSE
That our outcome models found NSE levels correlated to outcome in univariate, as well as independently in multivariate analyses, is congruent with earlier studies [57, 58]. However, in contrast to S100B, NSE does not appear to discriminate between favorable and unfavorable outcome, but only mortality versus survival, something that is supported by similar findings in a recent meta-analysis of NSE [21] and by Vos and co-workers [39].
[image:10.595.56.545.99.250.2]When compared to NSE, S100B has a higher overall predictive power, in accordance with other groups ana-lyzing and comparing both biomarkers [59–61], where the predictive capability of NSE was found limited in the presence of S100B in multivariate outcome models [39, 62]. An explanation is, again, the notable covari-ance between serum S100B and NSE, which has been shown to be 0.50–0.78 (correlation coefficient) in previ-ous studies [39, 58, 63, 64], similar to ours of 0.67. However, in our study this correlation decreases over time, highlighting the need for more granular temporal considerations when assessing biomarkers [65]. That NSE holds similar information as S100B, suggests that they are part of a similar pathophysiological process Table 3Multivariate outcome prediction models
Parameters included Explained variance (pseudo-R2)
IMPACT Age+pupils+GCS+ hypoxemia + hypotension + Hb +glucose
+ Rotterdam CT score
0.298
Core Age+pupils+GCS+hypoxemia+ hypotension + Hb +glucose
+Stockholm CT score
0.316
Core + S100B Age+pupils+GCS+ hypoxemia + hypotension + Hb + glucose
+Stockholm CT score+S100B AUC 48 h
0.379 (p<0.001 vs Core)
Core + neuron-specific enolase (NSE) Age+pupils+GCS+ hypoxemia + hypotension +Hb+ glucose
+Stockholm CT score+NSE AUC 48 h
0.344 (p<0.001 vs Core)
Core + (S100B/NSE) Age+pupils+GCS+ hypoxemia + hypotension + Hb +glucose
+Stockholm CT score+ (S100B AUC 48 h/NSE AUC 48 h)
0.365 (p<0.001 vs Core)
Core + S100B + NSE Age+pupils+GCS+ hypoxemia + hypotension + Hb + glucose
+Stockholm CT score+S100B AUC 48 h+ NSE AUC 48 h
0.379 (p= 0.934 vs Core + S100B)
[image:10.595.56.539.469.706.2]Table showing the different multivariate models to predict GOS 1–5. Bold indicates which parameters that were independently correlated to outcome in that specific model. A“Core”model was created, similar to the IMPACT calculator but with Stockholm CT score instead of Rotterdam CT score
Table 4Parameters correlated to S100B and NSE levels
NSE AUC 48 h S100B AUC 48 h
pvalue R2(coefficient) pvalue R2(coefficient)
Gender 0.937 0.000 (-) 0.862 0.000 (+)
Age <0.001 *0.028 (-) 0.055 0.009 (+)
Pupil unresponsiveness <0.001 *0.030 (+) <0.001 *0.032 (+)
Glasgow Coma Score (GCS) admission 0.001 0.024 (-) <0.001 0.028 (-)
Multitrauma <0.001 *0.032 (+) 0.202 0.004 (+)
Hypoxemia scene of accident (SoA) 0.015 0.014 (+) <0.001 *0.038 (+)
Hypotension SoA 0.237 0.003 (+) 0.430 0.001 (+)
Glucose admission 0.022 0.012 (+) 0.005 0.018 (+)
Hemoglobin admission 0.072 0.008 (+) 0.258 0.003 (-)
Head Abbreviated Injury Score (AIS) 0.123 0.006 (+) 0.033 0.011 (+)
Marshall CT classification 0.931 0.000 (+) 0.207 0.004 (+)
Rotterdam CT score 0.006 0.018 (+) <0.001 0.045 (+)
Stockholm CT score 0.001 0.029 (+) <0.001 0.060 (+)
Stockholm subarachnoid hemorrhage (SAH) score <0.001 *0.074 (+) <0.001 *0.098 (+)
Model explained (adjusted R2) 0.195 0.161
Table illustrating which parameters that were correlated to S100B and neuron-specific enolase (NSE) levels using linear univariate and multivariate models. Bold indicates significance (p<0.05). The asterisk (*
) highlights which parameters were independently correlated to the levels of each biomarker. Adjusted-R2
despite their separate cellular origins. This contrasts with, for example, neurofilament light (NF-L), which has seen to have a much lower covariance with S100B [31]. In aggregate, while NSE is an independent out-come predictor in TBI, it does not add any additional pseudo-R2 in the presence of S100B, which is a better predictor overall.
Optimal sampling time to assess outcome
Timing of biomarker sampling in studies is not stan-dardized and much of the differences in findings of stud-ies may relate to dissimilar sampling times. In this study we attempt to focus on some little-studied temporal aspects of these biomarkers. Our results suggest that a more granular focus on temporal changes may be needed in biomarker research in general, as important aspects of characterization may be otherwise lost [65]. The optimal timing of NSE sampling for outcome pre-diction has acquired insufficient attention earlier. Some studies have only used one sample at admission [66, 67], while others have sampled NSE more frequently and no-ticed that peak levels are better than admission levels for outcome prediction [18, 62]. We have previously shown that the outcome predictive power of S100B increased substantially after about 12 hours [12]. Again, in this larger cohort, we noticed a similar pattern with an ex-plained variance toward outcome of about 0.25–0.30 some 30 hours after trauma. However, it must be noted that this study overlaps patients (2005–2009) with the current study. In contrast, NSE, exhibits a rather flat and low predictive power over time, with a pseudo-R2 < 0.10. Presumably, due to the longer half-life of NSE, NSE will remain elevated for a longer period of time compared to S100B (30 hours vs 25 minutes) [24, 30]. This, and the fact that hemolysis could presumably affect NSE over a prolonged period of time, are poten-tial confounders possibly affecting its predictive cap-abilities. In summary, both biomarkers are influenced by multitrauma early after injury, however 10–12 hours after trauma, S100B’s predictive capability increases while NSE’s outcome prediction remains relatively low days after trauma.
Influence of multitrauma on S100B and NSE
In this study, we explored the impact of multitrauma on NSE and S100B levels over time. We used a sliding win-dow methodology clearly suggesting that the effect of multitrauma on S100B is limited to the first 12 hours, whereas in the case of NSE, the correlation between NSE and multitrauma remains past 24 hours. Other studies have found a correlation between NSE and extra-cranial injury, questioning its validity as a biomarker of cerebral injury [68, 69]. S100B has also been criticized for being released from extracranial sources [22, 23, 70–72].
However, our study indicates that the extracranial con-tribution is probably more problematic for NSE than for S100B. The washout effect of S100B from extracra-nial trauma after TBI has been shown to be relatively fast [23, 70], while in theory, several hematomas con-taining slowly degrading erythrocytes will be contribut-ing to the total NSE levels for days or even weeks, especially given the longer half-life. As can be seen in Fig. 1h, the multitrauma contribution of NSE is in-creased past 24 hours, which almost coincides with the described serum half-life of the protein [24]. Attempts to adjust for hemolysis in NSE samples have been made, which have shown to yield more accurate results [73, 74], something that unfortunately was not possible in our retrospective approach. In future studies, it would be of interest to isolate the kind of extracranial injury that results in the greatest release of NSE, some-thing that we recently have done with S100B in bicycle injuries [27]. Moreover, in addition to intra- and extra-cranial injuries, we found NSE to also be significantly correlated with age (negative correlation), an observa-tion that may require further investigaobserva-tion, but we believe that it is due to the fact that a majority of the multitrauma patients were younger. In aggregate, NSE appears more confounded by extracranial trauma than S100B.
confidently show that they are better predictors of TBI outcome and severity than S100B and NSE.
In summary, this study suggests S100B to be the more useful of the two biomarkers for outcome prediction in NICU TBI patients. It is important to note that our find-ings cannot be translated to other cerebral pathologies such as anoxic brain injuries after cardiopulmonary resuscitation (CPR), or stroke, where NSE is utilized [84–86]. In TBI cohorts similar to ours, early samples of both biomarkers should be interpreted with caution as they are influenced by extracranial trauma. However, in the case for S100B the extracranial trauma component appears negligible from 12 hours after injury. While more brain-specific markers of tissue injury exist, to date, none have in our opinion yet added more utility than S100B in TBI patients. We therefore suggest that future novel biomarkers should be compared with S100B, and that biomarker evaluation should include time series analysis elucidating temporal aspects of in-formation content and possible confounders.
Limitations
There are several limitations to this study that should be noted. The retrospective nature is associated with some inherent weaknesses, even if sampling at the NICU was done prospectively by clinical protocol for all patients. A total of 593 patients were excluded due to a limited amount of protein biomarker samples. The cause is largely due to patients being treated at other ICUs prior to NICU referral. A majority of these patients did not reach the NICU in time to have three 12-hourly, samples acquired within 48 hours of trauma. As previously noted, the mortality was not higher in this group. Al-though this clearly affects the cohort composition select-ing a more severe TBI population with early referrals and more isolated TBI, we believe that this still repre-sents a clinically relevant NICU population in which to study these biomarkers.
There is a potential treatment bias as levels of NSE and S100B were not blinded to caregivers. While we have not changed any local guidelines due to NSE or S100B sampling, secondary peaks of S100B do trigger further diagnostics and a potential change in the treat-ment regime [15]. That NSE and S100B are used differ-entially could affect results, but are in our opinion more the result of years of experience of these biomarkers simultaneously where S100B has emerged as the more clinically comprehensive and consistent biomarker. As we have used biomarkers from the first 72 hours after trauma in this study, and consider these levels more cor-related to the initial traumatic cerebral injury than to secondary injuries, we believe that treatment bias will not meaningfully influence conclusions.
An additional limitation is that we could not in retro-spect adjust for the hemolysis contribution [25], some-thing that would have been possible if we had a hemolysis index [74]. The method of ocular inspection of hemolysis used at the laboratory during this study is inherently blunt and subjective. It is difficult to define if the hemolysis index (hemoglobin concentration) is 0.25, 0.50, or even 1.0 g/L hemoglobin in a sample and thus it is fair to assume that hemolysis probably influenced the samples resulting in higher total levels of NSE in some patients. A better hemolysis adjustment may however lead to an even greater covariance between NSE and S100B.
Finally, the S100B assay was changed during the ex-perimental period. While good correlations between the two methods have been shown [43, 44, 87], others have shown that there is a discrepancy, especially in concen-trations above 0.4μg/L, and that the Elecsys device con-sistently measured lower levels (i.e., a majority of our samples were lower than 0.4 μg/L) [88]. In the current dataset, comparing S100B levels for patients with un-favorable outcome between the two assays (87 of the 170 patients with the old LIAISON assay vs 116 of the 247 patients with the new Elecsys assay) indicated that the LIAISON yielded a median peak level of 1.2 (inter-quartile range: 0.6–2.3)μg/L while the Elecsys assay 1.0 (interquartile range: 0.3–2.9) μg/L of S100B (p= 0.315, Mann-WhitneyUtest). Thus, we could not replicate the significantly lower levels seen in other studies with the current study material, supporting that the assay change is a minor limitation.
Conclusions
Acknowledgements
We would like to thank Gunilla Malmborg-Bornhall, RN, for keeping track of the trauma database at the neuro-intensive care unit, Karolinska University Hospital, Stockholm, Sweden.
Funding
The study was founded by grants from the Karolinska Institutet and the Stockholm County (ALF funding) as well as funding from SENSUS Region Mellansverige. The funding bodies had no role in the design of the study, interpretation of the data or in the presentation results.
Availability of data and materials
The dataset supporting the conclusions of this article is included within the article.
Authors’contributions
EPT, EJ, AF, BMB, MS, SM, and DWN designed the study. EPT, BMB, and EJ gathered clinical data, biomarker data, and functional outcome data. EPT assessed the neuro-radiological images. EPT, AF, and DWN conducted the statistical analyses. EPT, AF, EJ, BMB, MS, SM, and DWN interpreted the results and wrote the manuscript. All authors read and approved the manuscript.
Competing interests
The authors declare no competing interests.
Ethics approval and consent to participate
The current study was approved by the Regional Ethical Review Board in Stockholm County (#2014/791-31/1). The local review board did not deem it necessary to obtain informed consent from the included patients or next of kin. Data is presented on a group level, thus making it impossible to identify individual patients. All potential identifiers, such as personal identification numbers, dates and time-stamps, have been removed from the dataset to guarantee full anonymity.
Author details
1Department of Clinical Neuroscience, Karolinska Institutet, Stockholm, Sweden.2Department of Neurosurgery, Karolinska University Hospital, Stockholm, Sweden.3Department of Biomedical and Dental Sciences and Morphofunctional Imaging, University of Messina, Messina, Italy.4Department of Physiology and Pharmacology, Section of Anesthesiology and Intensive Care, Karolinska Institutet, Stockholm, Sweden.
Received: 16 May 2016 Accepted: 9 August 2016
References
1. Hyder AA, Wunderlich CA, Puvanachandra P, Gururaj G, Kobusingye OC. The impact of traumatic brain injuries: a global perspective. NeuroRehabilitation. 2007;22(5):341–53.
2. Gustavsson A, Svensson M, Jacobi F, Allgulander C, Alonso J, Beghi E, et al. Cost of disorders of the brain in Europe 2010. Eur Neuropsychopharmacol. 2011;21(10):718–79.
3. Roozenbeek B, Maas AI, Menon DK. Changing patterns in the epidemiology of traumatic brain injury. Nat Rev Neurol. 2013;9(4):231–6.
4. Brain Trauma Foundation, American Association of Neurological Surgeons, Congress of Neurological Surgeons, Joint Section on Neurotrauma, Critical Care, AANS/CNS, Bratton SL, Chestnut RM, et al. Guidelines for the management of severe traumatic brain injury. VIII. Intracranial pressure thresholds. J Neurotrauma. 2007;24 Suppl 1:S55–58.
5. Hutchinson PJ, Jalloh I, Helmy A, Carpenter KL, Rostami E, Bellander BM, et al. Consensus statement from the 2014 International Microdialysis Forum. Intensive Care Med. 2015;41(9):1517–28.
6. Valadka AB, Gopinath SP, Contant CF, Uzura M, Robertson CS. Relationship of brain tissue PO2 to outcome after severe head injury. Crit Care Med. 1998;26(9):1576–81.
7. McHugh GS, Engel DC, Butcher I, Steyerberg EW, Lu J, Mushkudiani N, et al. Prognostic value of secondary insults in traumatic brain injury: results from the IMPACT study. J Neurotrauma. 2007;24(2):287–93.
8. Chesnut RM, Marshall LF, Klauber MR, Blunt BA, Baldwin N, Eisenberg HM, et al. The role of secondary brain injury in determining outcome from severe head injury. J Trauma. 1993;34(2):216–22.
9. Yokobori S, Hosein K, Burks S, Sharma I, Gajavelli S, Bullock R. Biomarkers for the clinical differential diagnosis in traumatic brain injury–a systematic review. CNS Neurosci Ther. 2013;19(8):556–65.
10. Donato R, Sorci G, Riuzzi F, Arcuri C, Bianchi R, Brozzi F, et al. S100B’s double life: intracellular regulator and extracellular signal. Biochim Biophys Acta. 2009;1793(6):1008–22.
11. Unden J, Ingebrigtsen T, Romner B, Scandinavian Neurotrauma Committee. Scandinavian guidelines for initial management of minimal, mild and moderate head injuries in adults: an evidence and consensus-based update. BMC Med. 2013;11:50.
12. Thelin EP, Johannesson L, Nelson D, Bellander BM. S100B is an important outcome predictor in traumatic brain injury. J Neurotrauma. 2013;30(7):519–28. 13. Goyal A, Failla MD, Niyonkuru C, Amin K, Fabio A, Berger RP, et al. S100b as
a prognostic biomarker in outcome prediction for patients with severe traumatic brain injury. J Neurotrauma. 2013;30(11):946–57.
14. Mercier E, Boutin A, Lauzier F, Fergusson DA, Simard JF, Zarychanski R, et al. Predictive value of S-100beta protein for prognosis in patients with moderate and severe traumatic brain injury: systematic review and meta-analysis. BMJ. 2013;346:f1757.
15. Thelin EP, Nelson DW, Bellander BM. Secondary peaks of S100B in serum relate to subsequent radiological pathology in traumatic brain injury. Neurocrit Care. 2014;20(2):217–29.
16. Raabe A, Kopetsch O, Woszczyk A, Lang J, Gerlach R, Zimmermann M, et al. S-100B protein as a serum marker of secondary neurological complications in neurocritical care patients. Neurol Res. 2004;26(4):440–5.
17. Haimoto H, Hosoda S, Kato K. Differential distribution of immunoreactive S100-alpha and S100-beta proteins in normal nonnervous human tissues. Lab Invest. 1987;57(5):489–98.
18. Gradisek P, Osredkar J, Korsic M, Kremzar B. Multiple indicators model of long-term mortality in traumatic brain injury. Brain Inj. 2012;26(12):1472–81. 19. Chabok SY, Moghadam AD, Saneei Z, Amlashi FG, Leili EK, Amiri ZM.
Neuron-specific enolase and S100BB as outcome predictors in severe diffuse axonal injury. J Trauma Acute Care Surg. 2012;72(6):1654–7.
20. Begaz T, Kyriacou DN, Segal J, Bazarian JJ. Serum biochemical markers for post-concussion syndrome in patients with mild traumatic brain injury. J Neurotrauma. 2006;23(8):1201–10.
21. Cheng F, Yuan Q, Yang J, Wang W, Liu H. The prognostic value of serum neuron-specific enolase in traumatic brain injury: systematic review and meta-analysis. PLoS One. 2014;9(9):e106680.
22. Anderson RE, Hansson LO, Nilsson O, Dijlai-Merzoug R, Settergren G. High serum S100B levels for trauma patients without head injuries. Neurosurgery. 2001;48(6):1255–8. discussion 1258–1260.
23. Pelinka LE, Toegel E, Mauritz W, Redl H. Serum S 100 B: a marker of brain damage in traumatic brain injury with and without multiple trauma. Shock. 2003;19(3):195–200.
24. Johnsson P, Blomquist S, Luhrs C, Malmkvist G, Alling C, Solem JO, et al. Neuron-specific enolase increases in plasma during and immediately after extracorporeal circulation. Ann Thorac Surg. 2000;69(3):750–4.
25. Beaudeux JL, Leger P, Dequen L, Gandjbakhch I, Coriat P, Foglietti MJ. Influence of hemolysis on the measurement of S-100beta protein and neuron-specific enolase plasma concentrations during coronary artery bypass grafting. Clin Chem. 2000;46(7):989–90.
26. Gao F, Harris DN, Sapsed-Byrne S, Sharp S. Neurone-specific enolase and Sangtec 100 assays during cardiac surgery: Part III–Dose haemolysis affect their accuracy? Perfusion. 1997;12(3):171–7.
27. Thelin EP, Zibung E, Riddez L, Nordenvall C. Assessing bicycle-related trauma using the biomarker S100B reveals a correlation with total injury severity. Eur J Trauma Emerg Surg. 2015. [Epub ahead of print] 28. Watt SE, Shores EA, Baguley IJ, Dorsch N, Fearnside MR. Protein S-100 and
neuropsychological functioning following severe traumatic brain injury. Brain Inj. 2006;20(10):1007–17.
29. Gonzclez-Mao MC, Reparaz-Andrade A, Del Campo-Perez V, Alvarez-Garcia E, Vara-Perez C, Andrade-Olivie MA. Model predicting survival/exitus after traumatic brain injury: biomarker S100B 24 h. Clin Lab. 2011;57(7-8):587–97. 30. Jonsson H, Johnsson P, Hoglund P, Alling C, Blomquist S. Elimination of
S100B and renal function after cardiac surgery. J Cardiothorac Vasc Anesth. 2000;14(6):698–701.
32. Brain Trauma Foundation, American Association of Neurological Surgeons. Management and prognosis of severe traumatic brain injury. Brain Trauma Foundation; 2000.
33. Brain Trauma Foundation, American Association of Neurological Surgeons, Congress of Neurological Surgeons. Guidelines for the management of severe traumatic brain injury. J Neurotrauma. 2007;24 Suppl 1:S1–106. 34. Kakarieka A. Review on traumatic subarachnoid hemorrhage. Neurol Res.
1997;19(3):230–2.
35. Committee on Trauma, American College of Surgeons. ATLS: Advanced Trauma Life Support Program for Doctors (8th ed.). Chicago: American College of Surgeons; 2008.
36. Baker SP, O’Neill B, Haddon Jr W, Long WB. The injury severity score: a method for describing patients with multiple injuries and evaluating emergency care. J Trauma. 1974;14(3):187–96.
37. Teasdale G, Jennett B. Assessment of coma and impaired consciousness. A practical scale. Lancet. 1974;2(7872):81–4.
38. Perel P, Arango M, Clayton T, Edwards P, Komolafe E, Poccock S, et al. Predicting outcome after traumatic brain injury: practical prognostic models based on large cohort of international patients. BMJ. 2008;336(7641):425–9. 39. Vos PE, Lamers KJ, Hendriks JC, van Haaren M, Beems T, Zimmerman C, et
al. Glial and neuronal proteins in serum predict outcome after severe traumatic brain injury. Neurology. 2004;62(8):1303–10.
40. Marshall LF, Marshall SB, Klauber MR, Clark MV, Eisenberg HM, Jane JA, et al. A new classification of head-injury based on computerized-tomography. J Neurosurg. 1991;75:S14–20.
41. Nelson DW, Nystrom H, MacCallum RM, Thornquist B, Lilja A, Bellander BM, et al. Extended analysis of early computed tomography scans of traumatic brain injured patients and relations to outcome. J Neurotrauma. 2010;27(1):51–64.
42. Maas AI, Hukkelhoven CW, Marshall LF, Steyerberg EW. Prediction of outcome in traumatic brain injury with computed tomographic characteristics: a comparison between the computed tomographic classification and combinations of computed tomographic predictors. Neurosurgery. 2005;57(6):1173–82. discussion 1173–82.
43. Smit LH, Korse CM, Bonfrer JM. Comparison of four different assays for determination of serum S-100B. Int J Biol Markers. 2005;20(1):34–42. 44. Alber B, Hein R, Garbe C, Caroli U, Luppa PB. Multicenter evaluation of the
analytical and clinical performance of the Elecsys S100 immunoassay in patients with malignant melanoma. Clin Chem Lab Med. 2005;43(5):557–63. 45. Karaoguz R, Altln T, Atbasoglu EC, Isikay C, Guraslan B, Akyurek O, et al.
Defibrillation testing and early neurologic outcome. Int Heart J. 2008;49(5):553–63. 46. de Kruijk JR, Leffers P, Menheere PP, Meerhoff S, Twijnstra A. S-100B and
neuron-specific enolase in serum of mild traumatic brain injury patients. A comparison with health controls. Acta Neurol Scand. 2001;103(3):175–9. 47. Jennett B, Bond M. Assessment of outcome after severe brain damage.
Lancet. 1975;1(7905):480–4.
48. Steyerberg EW, Mushkudiani N, Perel P, Butcher I, Lu J, McHugh GS, et al. Predicting outcome after traumatic brain injury: development and international validation of prognostic scores based on admission characteristics. PLoS Med. 2008;5(8):e165. discussion e165.
49. Wickham H. ggplot2: elegant graphics for data analysis. New York: Springer-Verlag; 2009.
50. R Development Core Team. R: a language and environment for statistical computing. Vienna, Austria: R Foundation for Statistical Computing; 2008. 51. Marshall A, Altman DG, Royston P, Holder RL. Comparison of techniques for
handling missing covariate data within prognostic modelling studies: a simulation study. BMC Med Res Methodol. 2010;10:7.
52. McHugh GS, Butcher I, Steyerberg EW, Lu J, Mushkudiani N, Marmarou A, et al. Statistical approaches to the univariate prognostic analysis of the IMPACT database on traumatic brain injury. J Neurotrauma. 2007;24(2):251–8. 53. Maas AI, Steyerberg EW, Marmarou A, McHugh GS, Lingsma HF, Butcher I,
et al. IMPACT recommendations for improving the design and analysis of clinical trials in moderate to severe traumatic brain injury.
Neurotherapeutics. 2010;7(1):127–34.
54. Bledsoe BE, Casey MJ, Feldman J, Johnson L, Diel S, Forred W, et al. Glasgow Coma Scale scoring is often inaccurate. Prehospit Disaster Med. 2015;30(1):46–53.
55. Balestreri M, Czosnyka M, Chatfield DA, Steiner LA, Schmidt EA, Smielewski P, et al. Predictive value of Glasgow Coma Scale after brain trauma: change in trend over the past ten years. J Neurol Neurosurg Psychiatry. 2004;75(1):161–2.
56. Stocchetti N, Pagan F, Calappi E, Canavesi K, Beretta L, Citerio G, et al. Inaccurate early assessment of neurological severity in head injury. J Neurotrauma. 2004;21(9):1131–40.
57. Dauberschmidt R, Marangos PJ, Zinsmeyer J, Bender V, Klages G, Gross J. Severe head trauma and the changes of concentration of neuron-specific enolase in plasma and in cerebrospinal fluid. Clin Chim Acta. 1983;131(3):165–70.
58. Woertgen C, Rothoerl RD, Holzschuh M, Metz C, Brawanski A. Comparison of serial S-100 and NSE serum measurements after severe head injury. Acta Neurochir (Wien). 1997;139(12):1161–4. discussion 1165.
59. Herrmann M, Curio N, Jost S, Wunderlich MT, Synowitz H, Wallesch CW. Protein S-100B and neuron specific enolase as early neurobiochemical markers of the severity of traumatic brain injury. Restor Neurol Neurosci. 1999;14(2-3):109–14.
60. Raabe A, Grolms C, Keller M, Dohnert J, Sorge O, Seifert V. Correlation of computed tomography findings and serum brain damage markers following severe head injury. Acta Neurochir (Wien). 1998;140(8):787–91. discussion 791–2.
61. Raabe A, Grolms C, Seifert V. Serum markers of brain damage and outcome prediction in patients after severe head injury. Br J Neurosurg. 1999;13(1):56–9. 62. Stein DM, Lindell AL, Murdock KR, Kufera JA, Menaker J, Bochicchio GV, et al.
Use of serum biomarkers to predict cerebral hypoxia after severe traumatic brain injury. J Neurotrauma. 2012;29(6):1140–9.
63. Olivecrona M, Rodling-Wahlstrom M, Naredi S, Koskinen LO. S-100B and neuron specific enolase are poor outcome predictors in severe traumatic brain injury treated by an intracranial pressure targeted therapy. J Neurol Neurosurg Psychiatry. 2009;80(11):1241–7.
64. Bellander BM, Olafsson IH, Ghatan PH, Bro Skejo HP, Hansson LO, Wanecek M, et al. Secondary insults following traumatic brain injury enhance complement activation in the human brain and release of the tissue damage marker S100B. Acta Neurochir (Wien). 2011;153(1):90–100. 65. Ercole A, Thelin EP, Holst A, Bellander BM, Nelson DW. Kinetic modelling of
serum S100b after traumatic brain injury. BMC Neurol. 2016;16(1):93. 66. Sogut O, Guloglu C, Orak M, Sayhan MB, Gokdemir MT, Ustundag M, et al.
Trauma scores and neuron-specific enolase, cytokine and C-reactive protein levels as predictors of mortality in patients with blunt head trauma. J Int Med Res. 2010;38(5):1708–20.
67. Meric E, Gunduz A, Turedi S, Cakir E, Yandi M. The prognostic value of neuron-specific enolase in head trauma patients. J Emerg Med. 2010;38(3):297–301. 68. Skogseid IM, Nordby HK, Urdal P, Paus E, Lilleaas F. Increased serum creatine
kinase BB and neuron specific enolase following head injury indicates brain damage. Acta Neurochir (Wien). 1992;115(3-4):106–11.
69. Pelinka LE, Hertz H, Mauritz W, Harada N, Jafarmadar M, Albrecht M, et al. Nonspecific increase of systemic neuron-specific enolase after trauma: clinical and experimental findings. Shock. 2005;24(2):119–23.
70. Savola O, Pyhtinen J, Leino TK, Siitonen S, Niemela O, Hillbom M. Effects of head and extracranial injuries on serum protein S100B levels in trauma patients. J Trauma. 2004;56(6):1229–34. discussion 1234.
71. Unden J, Bellner J, Eneroth M, Alling C, Ingebrigtsen T, Romner B. Raised serum S100B levels after acute bone fractures without cerebral injury. J Trauma. 2005;58(1):59–61.
72. da Rocha AB, Schneider RF, de Freitas GR, Andre C, Grivicich I, Zanoni C, et al. Role of serum S100B as a predictive marker of fatal outcome following isolated severe head injury or multitrauma in males. Clin Chem Lab Med. 2006;44(10):1234–42.
73. Berger R, Richichi R. Derivation and validation of an equation for adjustment of neuron-specific enolase concentrations in hemolyzed serum. Pediatr Crit Care Med. 2009;10(2):260–3.
74. Tolan NV, Vidal-Folch N, Algeciras-Schimnich A, Singh RJ, Grebe SK. Individualized correction of neuron-specific enolase (NSE) measurement in hemolyzed serum samples. Clin Chim Acta. 2013;424:216–21.
75. Papa L, Silvestri S, Brophy GM, Giordano P, Falk JL, Braga CF, et al. GFAP out-performs S100beta in detecting traumatic intracranial lesions on computed tomography in trauma patients with mild traumatic brain injury and those with extracranial lesions. J Neurotrauma. 2014;31(22):1815–22.
76. Pelinka LE, Kroepfl A, Leixnering M, Buchinger W, Raabe A, Redl H. GFAP versus S100B in serum after traumatic brain injury: relationship to brain damage and outcome. J Neurotrauma. 2004;21(11):1553–61.
78. Posti JP, Takala RS, Runtti H, Newcombe VF, Outtrim J, Katila AJ, et al. The levels of glial fibrillary acidic protein and ubiquitin C-terminal hydrolase-L1 during the first week after a traumatic brain injury: correlations with clinical and imaging findings. Neurosurg. 2016;79(3):456–64.
79. Papa L, Lewis LM, Falk JL, Zhang Z, Silvestri S, Giordano P, et al. Elevated levels of serum glial fibrillary acidic protein breakdown products in mild and moderate traumatic brain injury are associated with intracranial lesions and neurosurgical intervention. Ann Emerg Med. 2012;59(6):471–83.
80. Papa L, Brophy GM, Welch RD, Lewis LM, Braga CF, Tan CN, et al. Time course and diagnostic accuracy of glial and neuronal blood biomarkers GFAP and UCH-L1 in a large cohort of trauma patients with and without mild traumatic brain injury. JAMA Neurol. 2016;73:551–60.
81. Papa L, Lewis LM, Silvestri S, Falk JL, Giordano P, Brophy GM, et al. Serum levels of ubiquitin C-terminal hydrolase distinguish mild traumatic brain injury from trauma controls and are elevated in mild and moderate traumatic brain injury patients with intracranial lesions and neurosurgical intervention. J Trauma Acute Care Surg. 2012;72(5):1335–44.
82. Puvenna V, Brennan C, Shaw G, Yang C, Marchi N, Bazarian JJ, et al. Significance of ubiquitin carboxy-terminal hydrolase L1 elevations in athletes after sub-concussive head hits. PLoS One. 2014;9(5):e96296. 83. Takala RS, Posti JP, Runtti H, Newcombe VF, Outtrim J, Katila AJ, et al. Glial
fibrillary acidic protein and ubiquitin C-terminal hydrolase-L1 as outcome predictors in traumatic brain injury. World Neurosurg. 2016;87:8–20. 84. Missler U, Wiesmann M, Friedrich C, Kaps M. S-100 protein and
neuron-specific enolase concentrations in blood as indicators of infarction volume and prognosis in acute ischemic stroke. Stroke. 1997;28(10):1956–60. 85. Martens P, Raabe A, Johnsson P. Serum S-100 and neuron-specific enolase
for prediction of regaining consciousness after global cerebral ischemia. Stroke. 1998;29(11):2363–6.
86. Gallagher CN, Carpenter KL, Grice P, Howe DJ, Mason A, Timofeev I, et al. The human brain utilizes lactate via the tricarboxylic acid cycle: a 13C-labelled microdialysis and high-resolution nuclear magnetic resonance study. Brain. 2009;132(Pt 10):2839–49.
87. Mussack T, Klauss V, Ruppert V, Gippner-Steppert C, Biberthaler P, Schiemann U, et al. Rapid measurement of S-100B serum protein levels by Elecsys S100 immunoassay in patients undergoing carotid artery stenting or endarterectomy. Clin Biochem. 2006;39(4):349–56.
88. Muller K, Elverland A, Romner B, Waterloo K, Langbakk B, Unden J, et al. Analysis of protein S-100B in serum: a methodological study. Clin Chem Lab Med. 2006;44(9):1111–4.
• We accept pre-submission inquiries
• Our selector tool helps you to find the most relevant journal
• We provide round the clock customer support
• Convenient online submission
• Thorough peer review
• Inclusion in PubMed and all major indexing services • Maximum visibility for your research
Submit your manuscript at www.biomedcentral.com/submit


![Appendix to the foregoing address [by the President, Hon Judge Longfield, at the opening of the eighteenth session]](data:image/gif;base64,R0lGODlhAQABAIAAAP///wAAACH5BAEAAAAALAAAAAABAAEAAAICRAEAOw==)