Studies of leaf surface fungi in relation to flavour
of tea
U. K. K. Wickremasinghe
A thesis submitted for the degree of Doctor of Philosophy of the Australian National University.
i
Declaration
Except where otherwise indicated this thesis is my own work.
Acknowledgements
I thank Dr. R. L. de Silva, Director General, Sri Lanka Tea Board (formerly Director, Tea Research Institute of Sri Lanka), for entrusting me with the problem of establishing a microbial basis of tea flavour biogenesis. After the initial bewilderment I became enthralled by the subject of tea flavour.
My special thanks to Prof. D. M. Griffin, who amidst his extensive commitments, undertook to supervise my work. Under his guidance I found new depths in scientific research and in the use of the English language.
It is with a deep sense of gratitude that I acknowledge the assistance of Dr. W. A. Heather who was associated with the initial part of this project. Though his retirement during the course of the project prevented full participation, his association was extremely useful.
The assistance received from my advisors Prof. R. W. Rickards and Dr. G. A. Chilvers is gratefully acknowledged. I am most thankful for the valuable statistical assistance received from the consultants Mr. Paul Winer and Dr. Ross Cunningham.
My special thanks to Mr. Rod Taylor, Managing Director, Tea Estates of Australia Ltd., for providing tea plants for green house experiments and for his hospitality during my visits to Innisfail for field experiments.
Most of my work would not have been possible without the assistance of the technical staff in the Department of Forestry of the ANU. My special thanks are due to Messrs. David Abbott and Roland Jahnke.
My sincere thanks to my wife Saroja who sacrificed her career to further mine, and care for our children Dilupa and Anushka whose refreshing affection helped in maintaining enthusiasm through my occassional bouts of migraine.
iii
Abstract
Tea is a widely consumed beverage that constitutes an important internationally traded commodity. The appearance, particle size and the quantity of tea available are important determinants of market price of tea. However, the unit price of tea is determined to a large degree by its flavour. Flavour is a term collectively used to describe the sensory properties ’taste’ and ’aroma’ of brewed tea. While the taste characterises tea as a beverage, the aroma distinguishes flavoury teas from ordinary teas. A price differential of as much as ten times is sometimes observed between the seasonal flavoury teas and the ’plain’ teas abundantly found in the market place. Flavour is therefore of immense economic significance for the tea producing countries whose economic fortunes depend on earnings accrued by the tea trade. However, its seasonal, ephemeral nature imposes limits to full realization of the economic advantage of flavour. Outstanding flavour of tea in Sri Lanka is confined to two brief, well defined seasons: January and February in Dimbula District and July-September in Uva district. Achieving control over the process of flavour synthesis in tea is an attractive proposition due to the economic rewards this phenomenon brings.
iv
separation of yeast carotenoids complex providing a rapid, more sensitive and accurate technique for this purpose. High performance liquid chromatography can now replace thin layer chromatography (TLC) which, although the traditionally used method of carotenoids analysis, is particularly unsuited for the analysis of carotenoids.
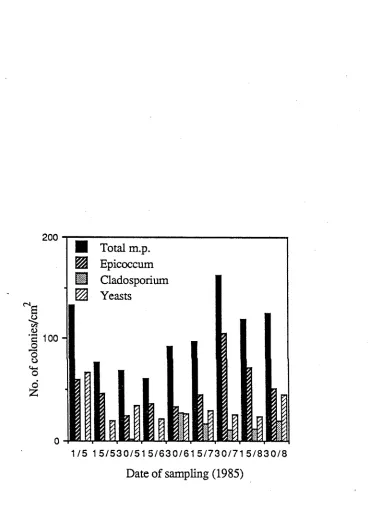
Successful colonization of the green tea leaf surfaces by the yeast R. glutinis is an essential prerequisite for its proposed role in tea flavour development. The subject of microbial colonization of green leaf surfaces and associated phenomena e. g. population composition and its variation, microbial interactions on leaf surfaces, have been amply documented during the last three decades. With a view to gaining an impression of characteristics of phylloplane microbial populations, the phylloplane microflora of the evergreen ornamental plant Photinia glabra was sampled fortnightly. The phylloplane microflora obtained in culture is often limited by the composition of the culture medium. After a comparison of a number of commonly used laboratory culture media potato- dextrose-agar (PDA) was chosen as the medium that facilitated the growth of the widest range of fungi. Methods used in the study of the phylloplane have been often criticized as being inexact and non-quantitative. Therefore the study of the phylloplane was preceded by a comparison of direct and cultural methods commonly used in the study of the phylloplane. Leaf washing method, washed leaf prints and a leaf print technique were employed as cultural techniques while direct examination of the leaf surface was carried out with scanning electron microscopy. Whereas leaf prints isolated the highest number of fungi and yeasts, the leaf washing method provided the lowest estimates. In the case of the yeasts the relative efficiencies of the three techniques differred only marginally. Estimates provided by the washed leaf print method approximately accounted for the difference between the washing and leaf print techniques. The estimates provided by different methods on the same sampling date lacked aggreement. Large values of standard deviation and standard error were characteristic of the data yielded by the cultural techniques, particularly in the case of yeasts. Increases in sample size within the manageable range did not reduce the values of these parameters. The microbial population on P. glabra was dominated by the fungi Epicoccum nigrum, Cladosporium cladosporioides and Alternaria alternata and the yeasts R. glutinis and Cryptococcus albidus. Numerous other species of filamentous fungi belonging to Fungi Imperfecti were isolated infrequently. Disparities between data provided by the direct and cultural techniques indicate the need to complement data obtained by any one method.
populations of E. nigrum and C. cladosporioid.es were observed. Cultural methods consistently reported higher levels of fungal populations on the adaxial surface. The yeast populations did not exhibit such differences between the two surfaces. However, direct observations with the scanning electron microscope (SEM) revealed that many of the propagules on the adaxial surface were in an inactive state. Fungal activity was largely confined to the abaxial leaf surface. Germinated spores or mycelial growth on the adaxial surface was of rare occurrence. Substantial mycelial growth could be observed on the abaxial surface, particularly in the vicinity of stomata. No sporulating fungal colonies were observed at any stage. Results yielded by the cultural techniques highlighted the risks involved in employing only these methods in the studies of the phylloplane.
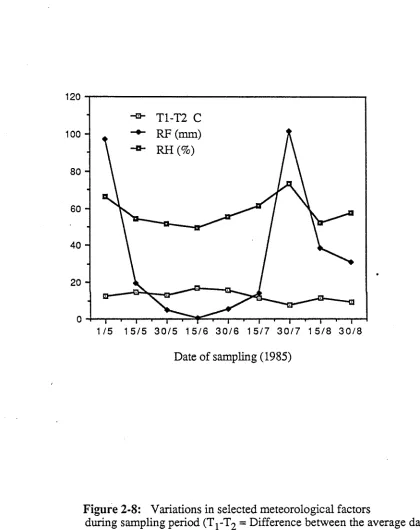
The environmental and other factors that govern variations in leaf surface microbial populations have not been elucidated previously. Such factors of the environment which govern population levels of microorganisms are of importance in explaining the seasonality of growth of yeasts on tea leaf surfaces. Earlier attempts to correlate leaf surface microbial population levels with weather factors immediately prior to sampling have been largely unsuccessful. An attempt was made here to correlate more remote meteorological data with phylloplane microbial population levels. The total microbial population and the population of E. nigrum showed high correlation with total rainfall, average relative humidity and the difference between maximum and minimum temperatures for the previous fortnight prior to sampling date.
The governing effect of the environmental factors on the population levels and composition of the leaf surface microflora point to major differences between the microflora on P. glabra in Canberra and tea in Sri Lanka. Tea cultivation has begun recently in tropical north Queensland. This provided an opportunity of studying the phylloplane microflora of tea under similar environmental conditions to Sri Lanka. The aerial microflora and the tea leaf surface microflora were studied in two subsequent years (1985 and 1986) during the ’dry season’ in north Queensland. It was observed that the composition of the leaf surface microflora closely resembled the aerial microflora. Even though the aerial fungal flora exhibited differences in composition, the yeast flora under tropical and mild temperate conditions were similar, consisting mainly of the species Rhodotorula, Sporobolomyces and Cryptococcus.
vi
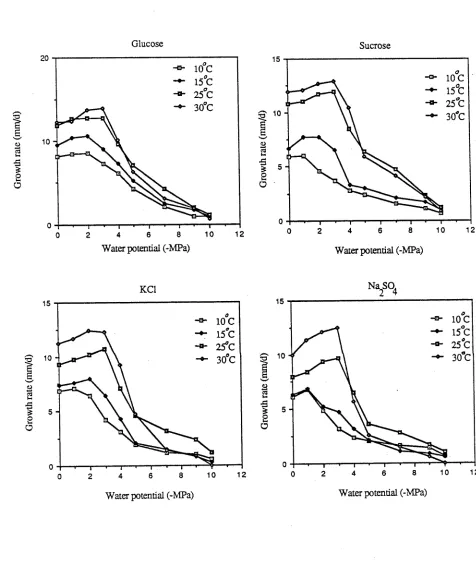
of green leaf surfaces. Relatively few studies of water relations of phylloplane fungi have been conducted and most are flawed by deficiencies in the experimental systems employed. The effects of osmotic water potential and temperature on spore germination and radial mycelial growth of three common phylloplane fungi were studied using four ionic and nonionic solutes to obtain nine water potentials (-1 to -14 MPa) of a minimum nutrient culture medium. The cultures at each water potential were incubated at three temperatures (10°C, 15°C and 25°C). On the unamended culture medium, germ tube initiation took place in less than 6 h. This duration increased progressively with decreasing water potential beyond -2 MPa. At moderately low water potentials (-2 to -4 MPa) germination took place after 12 h. The spores of A. alternata were an exception to this trend by germinating in less than 6 h at -5 MPa. The improvement of the rate of spore germination observed with time at low water potentials was marginal and varied with the fungus. Mycelial growth of all fungi was stimulated by moderately low water potentials (-2 to -3 MPa), but declined progressively with further lowering of water potentials. Measurable growth ceased at -8 to -10 MPa.
vü
whereas torularhodin content increased steadily. Illumination during the initial 6 h of culture appeared to have a significant effect on carotenoids biosynthesis. The biosynthesis of carotenoids continued irrespective of the subsequent conditions of illumination.
The comparatively recent separation method high pressure liquid chromatography (HPLC) appears to be a suitable technique for the analysis of yeast carotenoids. This rapid, efficient, sensitive and versatile technique has found application in the analysis of numerous biochemical compounds from a variety of other substrates. Reversed phase HPLC has been recommended for the analysis of carotenoids. Chapter 6 introduces the general principles and main forms of chromatography. Particular attention has been paid to thin layer chromatography (TLC), the traditionally employed form of chromatography in the analysis of carotenoids. It is argued that the chemical structure of the carotenoids makes them unsuitable for separation by TLC. These compounds lend themselves to structural transformation and their recovery is often incomplete. High pressure liquid chromatography however, provides a modem, rapid, accurate method of carotenoids analysis.
viii
total carotenoids complex and ß-carotene. Nitrogen alone failed to induce such increases. These results suggest that the process of growth receives priority over the biosynthesis of carotenoids, which accelerates upon the completion of growth. The effects of illumination on the biosynthesis of ß-carotene are similar to the effects on the total carotenoids, with a dependance on illumination for the initiation of the process.
The carotenoids content of tea leaves exposed to different environmental conditions were analysed using HPLC. The HPLC conditions determined were suitable for the separation of tea leaf carotenoids. An analysis of the carotenoids content of the bud, the first, second and third leaves revealed that the carotenoids content decreases with increasing age of the leaf. The chlorophyll content exhibited an increase with leaf age. The carotenoids consisted predominantly of ß-carotene and lutein while violaxanthin and neoxanthin were present in substantial quantities. Increased light intensity seemed to increase the carotenoids content of the tea leaf. An accompanying increase in the chlorophyll content was observed. The considerable difference between the daily maximum and minimum temperatures stimulated the biosynthesis of ß-carotene. The above observations lead to the conclusion that the environmental conditions during the flavour season in Sri Lanka increase the biosynthesis of carotenoids in the tea leaf. These observations are supportive of the hypothesis propounded by Wickremasinghe (1974).
Table of Contents
Declaration
i
Acknowledgements
ii
Abstract
iii
1. General Introduction
1
1.1. M icrobiology of the phyiloplane 1.1.1. Fungi on leaf surfaces
1.1.2. Yeasts on the phyiloplane 1.1.3. Tea culture
1.1.4. Tea in Sri Lanka 1.2. Flavour in tea
1.2.1. The tea manufacturing process 1.2.2. Biochemistry of tea manufacture
1.2.3. Flavour 10
1.2.4. Tea aroma formation 11
1.3. Leaf surface microorganisms and flavour in tea 12 1.3.1. Rhodotorula glutinis and tea flavour - A novel hypothesis 14
2. Seasonal variation of phyiloplane fungi of Photinia glabra
16
2.1. Introduction 16
2.2. M aterials and M ethods 18
2.2.1. Leaves 18
2.2.2. Evaluation of culture media 18 2.2.3. Methods of isolation of microorganisms 18
2.3. Results 20
2.3.1. Fungal and yeast populations on the leaf surfaces of Photinia 22
glabra
2.3.2. Microflora on the upper and lower surfaces 26 2.3.3. Relationship between microbial populations and meteorological 34
data
2.4. Discussion 38
3. Phyiloplane microflora of tea (Camellia sinensis)
42
3.1. Introduction 42
3.2. M aterials and Methods 44
3.3. Results 45
3.4. Discussion 47
4. Effect of osmotic water potential on spore germination and
54
hyphal growth of three phyiloplane fungi
4.1. Introduction 54
4.2. M aterials and Methods 56
4.2.1. Fungi and their sources 56
X
4.2.3. Spore germination on media of low osmotic water potential 57 4.2.4. Mycelial growth on media of solute-amended water potential 57
4.3. Results 59
4.3.1. Spore germination at low water potentials 59 4.3.2. Fungal growth in relation to water potential of agar media 59
4.3.3. Analysis of Variance 68
4.4. Discussion 70
5. Effect of environmental conditions on the growth and
74
carotenoids production by Rhodotorula glutinis
5.1. Introduction 74
5.2. M aterials and Methods 76
5.2.1. Effect of water potential and temperature on growth and 76 carotenoids production
5.2.2. Effect of age of culture on carotenoids production 76 5.2.3. Effect of light on carotenoids production 77 5.2.4. Determination of growth weight of yeast cell mass 77
5.2.5. Extraction of carotenoids 77
5.2.6. Quantitative determination of carotenoids 78 5.2.7. Extraction and quantification of torularhodin 78
5.3. results 79
5.4. Discussion 92
6. Separation of biological chemical compounds
96
6.1. Introduction 96
6.2. Chromatography 97
6.2.1. Adsorption chromatography 98
6.2.1.1. Thin Layer Chromatography 98
6.2.2. Partition chromatography 99
6.2.2.1. Gas-Liquid Chromatography 101 6.2.3. Ion exchange Chromatography 101 6.2.4. Reversed phase chromatography 102 6.3. High performance liquid chromatography (HPLC) 102 6.3.1. HPLC equipment and operation 103
6.4. Carotenoids 106
6.4.1. Distribution of carotenoids in fungi 108 6.4.2. Chromatography of carotenoids 108 6.4.2.1. Thin Layer Chromatography of carotenoids 109
6.4.2.2. HPLC of carotenoids 109
7. rp-HPLC analysis of variations in ß-carotene biosynthesis in
112
Rhodotorula glutinis in response to cultural conditions
7.1. Introduction 112
7.2. M aterials and methods 114
7.2.1. Culture of yeasts 114
7.2.2. Carotenoids sample preparation for the HPLC analysis 115
7.2.3. HPLC of carotenoids 116
7.2.4. Calculation of the number of theoretical plates of the column 116 7.2.5. Determination of optimum chromatographic conditions for the 117
separation of ß-carotene
7.2.6. Identification and quantification of yeast carotenoids 117
xi
7.3.1. Calculation of the number of theoretical plates 118 7.3.2. Optimisation of chromatographic conditions 118
7.3.3. Calibration of recorder 125
7.3.4. Chromatography of yeast carotenoids 125 7.3.5. The effect of age of culture on carotenoids biosynthesis 125 7.3.6. The effect of temperature on carotenoids biosynthesis 132 7.3.7. The effect of C:N ratio on carotenoids biosynthesis 132 7.3.8. The effect of illumination on carotenoids biosynthesis 132
7.4. Discussion 136
8. Environmental analysis of the biosynthesis of carotenoids in the 140
tea leaf
8.1. Introduction 140
8.2. Materials and Methods 142
8.2.1. Carotenoids sample preparation for the HPLC analysis 142
8.2.2. HPLC of carotenoids 143
8.3. Results 145
8.3.1. HPLC analysis of carotenoids 145 8.3.2. Positional analysis of tea leaf carotenoids 145 8.3.3. Effect of light intensity on carotenoids biosynthesis in the tea leaf 153 8.3.4. Effect of the difference between the daily maximum and 154
minimum temperatures
8.4. Discussion 160
9. General Discussion 170
9.1. Thoughts for the future and directions for future research 178
9.1.1. Immediate future 178
9.1.2. Medium to long term research needs 179
Appendix A. Composition of the basal medium used in water 181
relations experiments
Appendix B. M olal-based dry weights of solutes used for 182
characterizing water relations of phylloplane fungi
List of Figures
Figure 1-1: Flow chart of biochemical changes during tea 7
manufacture
Figure 2-1: Estimates of fungal populations obtained by different 23
methods of isolation
Figure 2-2: Scanning electron micrographs of the lower leaf surface 28
of Photinia glabra exhibiting extensive mycelial growth in the vicinity of stomata
Figure 2-3: Scanning electron micrographs of the lower leaf surface 29
of Photinia glabra a. fungal mycelia around stomata b. a germinating spore of Epicoccum nigrum
Figure 2-4: Scanning electron micrographs of the lower leaf surface 30
of P.glabra demonstrating active colonization by yeast and fungi
. Figure 2-5: Scanning electron micrographs of germinating fungal 31
spores on the upper leaf surface of P.glabra a. E. nigrum, b. C. cladosporioides
Figure 2-6: Scanning electron micrographs of the upper leaf surface 32
of P. glabra a. a germinated fungal spore b. degenerating fungal mycelia
Figure 2-7: Scanning electron micrographs of the upper leaf 33
surfaces of P. glabra a. a degenerating spore of A.
alternata b. degenerating yeast cells
Figure 2-8: Variations in selected meteorological factors during 35
sampling period (Tj-T2 = Difference between the
average daily maximum and minimum temperatures, RF = Total rainfall (mm), RH = Average relative humidity during the fortnight preceding the sampling date
Figure 2-9: Microbial populations on leaf surfaces of Photinia glabra 36
Figure 4-1: Effect of low water potentials on the germination of 58
fungal spores
Figure 4-2: Growth rates of E. nigrum on culture media of different 62
water potentials obtained with the addition of a. glucose b. sucrose c. KC1 d. Na2So4
Figure 4-3: Growth rates of E. nigrum on culture media of different 63
water potentials at a. 10°C b. 15°C c.25°C d. 30°C
Figure 4-4: Growth rates of C. cladosporioides on culture media of 64
different water potentials, obtained with the addition of a. glucose, b. sucrose, c. KC1 d. Na2So4
Figure 4-5: Growth rates of C. cladosporioides on culture media of 65
xiii
Figure 4-6: Growth rates of A. alternata on culture media of 66
different water potentials, obtained with the addition of a. glucose, b. sucrose, c. KC1 d. Na2So4
Figure 4-7: Growth rates of A. alternata on culture media of 67
different water potentials at a. 10°C, b. 15°C, c. 25°C d. 30°C
Figure 5-1: Visible light absorption spectrum of the carotenoids of 80
the yeast R. glutinis
Figure 5-2: Growth of R. glutinis at low water potentials obtained 81
with the addition of sucrose
Figure 5-3: Growth of R. glutinis at low water potentials obtained 82
with the addition of KC1
Figure 5-4: Carotenoids production by R. glutinis at low water 83
potentials obtained with the addition of sucrose
Figure 5-5: Carotenoids production by R. glutinis at low water 84
potentials obtained with the addition of KC1
Figure 5-6: Effect of pH on the growth of R. glutinis 90
Figure 6-1: Calculation of HPLC column parameters 105
Figure 6-2: Schematic pathway of the biosynthesis of carotenoids 107
Figure 7-1: Chromatogram of the test mixture RP-D (Peak numbers 119 1 = uracil, 2 = Phenol, 3 = Benzaldehyde, 4 =
N-N-Diet-M-toluamide, 5 = toluene, 6 = benzene)
Figure 7-2: High pressure liquid chromatographof synthetic 120
ß-carotene (2% 2-propanol in the solvent gradient described in the text, peak no.l = ß-carotene)
Figure 7-3: High pressure liquid chromatograph of synthetic 121
ß-carotene (4% 2-propanol in the solvent gradient described in the text, peak no.l = ß-carotene)
Figure 7-4: High pressure liquid chromatograph of synthetic 122
ß-carotene (7% 2-propanol in the solvent gradient described in the text, peak no.l = ß-carotene)
Figure 7-5: High pressure liquid chromatogram of synthetic 123
ß-carotene (9% 2-propanol in the solvent gradient described in the text, peak no.l = ß-carotene)
Figure 7-6: High pressure liquid chromatograph of synthetic 124
ß-carotene (10% 2-propanol in the solvent gradient described in the text, peak no.l = ß-carotene
Figure 7-7: Relationship between ß-carotene concentration and 126
chromatograph peak area
Figure 7-8: High pressure liquid chromatograph of the yeast 127
carotenoids (Recorder speed = 0.5 cm/min, peak no.s 1 and 2 = torularhodin and ß- carotene respectively. Chromatographic conditions are described in the text)
Figure 7-9: The absorption spectra of ß-carotene and the peak 128
eluent (3)
Figure 8-1: Major steps involved in sample preparation of tea leaf 144
carotenoids for HPLC
Figure 8-2: High pressure liquid chromatograph of tea leaf (two and 146
xiv
Figure 8-4: High pressure liquid chromatograph of carotenoids of 149
the First tea leaf from shoot apex. (For peak identification refer Figure 8-2)
Figure 8-5: High pressure liquid chromatograph of carotenoids of 150
the second tea leaf from shoot apex. (For peak identification refer Figure 8-2)
Figure 8-6: High pressure liquid chromatograph of carotenoids of 151
the mature tea leaf. (For peak identification refer Figure 8-2)
Figure 8-7: HPLC analysis of the carotenoids of the tea leaves 155
exposed to irradiance of 7 Wm’2
Figure 8-8: HPLC analysis of the carotenoids of the tea leaf exposed 156
to irradiance of 15 Wm"2
Figure 8-9: HPLC analysis of the carotenoids of the tea leaf exposed 157
to irradiance of 30 Wm"2
Figure 8-10: HPLC analysis of the carotenoids of the tea leaf 158
exposed to irradiance of 40 Wm"2
Figure 8-11: Effect of the difference between the maximum and 161
minimum temperature (2°C) on the biosynthesis of carotenoids
Figure 8-12: Effect of the difference between the maximum and 162
minimum temperature (5°C)on the biosynthesis of carotenoids
Figure 8-13: Effect of the difference between the maximum and 163
minimum temperature (8°C) on the biosynthesis of carotenoids
Figure 8-14: Effect of the difference between the maximum and 164
XV
List of Tables
Table 1-1: Chemical composition of the tea leaf 8
Table 2-1: Number of fungal colonies isolated by different culture 21
media
Table 2-2: Sample statistics of phylloplane microbial populations 24
Table 2-3: List of fungal species isolated from the leaf surfaces of 25
Photinia glabra
Table 2-4: Analysis of variance of the microbial populations on the 27
upper and lower leaf surfaces of Photinia glabra
Table 2-5: Correlation coefficients of selected meteorological factors 37
with phylloplane fungal populations
Table 3-1: Composition of the aerial microflora over a tea plantation 46
in north Queensland. (Pooled data for Aug. 1985 and Aug. 1986)
Table 3-2: Percentage frequency of occurrence of fungi on tea leaves 48
as indicated by leaf print technique (pooled data for Aug. 1985 and Aug. 1986)
Table 3-3: Analysis of variance of the filamentous fungal 49
populations on tea leaf surfaces
Table 3-4: Analysis of variance of the yeast populations on tea leaf 50
surfaces
Table 4-1: Water potentials at which maximum, 50% maximum and 60
no spore germination took place of the fungi A. alternata, C. cladosporioides and E. nigrum
Table 4-2: Analysis of variance of the growth of phylloplane fungi at 69
low water potentials
Table 5-1: Biosynthesis of total carotenoids complex and 86
torularhodin by R. glutinis at low water potentials
Table 5-2: Effect of age of culture on the biosynthesis of total 87
carotenoids and torularhodin by the yeast R. glutinis
Table 5-3: Effect of light on the biosynthesis of carotenoids and 88
torularhodin by R. glutinis
Table 5-4: Analysis of variance of carotenoids production by R. 91
glutinis
Table 6-1: Adsorbents and solvent systems employed in the TLC 100
analysis of carotenoids
Table 6-2: Columns and solvent systems employed in the HPLC 111
analysis of carotenoids
Table 7-1: Retention times (in s) of carotenoids during five 129
successive separations under identical conditions
Table 7-2: Composition of the yeast carotenoids complex as 130
xvi
Table 7-3: The effect of age of culture on carotenoids biosynthesis 131
Table 7-4: The effect of temperature on carotenoids biosynthesis 133
Table 7-5: The effect of nutrition on carotenoids biosynthesis 134
Table 7-6: The effect of illumination on carotenoids biosynthesis 135
Table 8-1: Identification data for the tea leaf carotenoids 147
Table 8-2: Relative quantities of major carotenoids contained in the 152
bud, the first leaf and the second leaf of the tea shoot
Table 8-3: Biosynthesis of carotenoids under different intensities of 159
irradiance
Table 8-4: Biosynthesis of carotenoids under different combinations 165
1
Chapter 1
General Introduction
1.1. Microbiology of the phylloplane
Study of saprophytic microflora colonizing green leaf surfaces is of comparatively recent origin. Despite early reference to leaf surface fungi (de Bary, 1866), the existence of a characteristic microflora on aerial plant surfaces had not been propounded until the discovery of a large air spora, enabled by more efficient trapping devices (Gregory and Hirst, 1957). This development highlighted that the propagules of plant pathogenic fungi constituted a fraction of the total air microflora, which was augmented by a diverse array of saprophytic fungi. Predominant among such saprophytic species are the members of the family Sporobolomycetaceae and Cladosporium species. Plant pathologists pioneering investigations into the influence these fungi might have on the development of foliar diseases found a new dimension to the host-pathogen-environment triangle. However, the early research work was typified by its tendency to regard the leaf surface as an identical environment to the then familiar rhizosphere. This attitude was given expression when the term ’phyllosphere’ was coined by Last (1955) and Ruinen (1956) to describe the habitat on leaf surfaces. Differences in respective substrates and the surrounding medium were later recognized byrenaming this habitat ’phylloplane’ (Kerling, 1958).
2
characteristic associated with the leaf surface per se. Investigations on fungal successions however, are more enlightening. Present knowledge, that fungal colonization of green leaves begins at an early age and that the fungal activity accelerates at the onset of leaf senescence, emanates from the work in this area. Studies involving analyses of microbial populations on leaf surfaces in the northern and southern hemispheres reveal a general pattem of colonization. Surfaces of emerging and very young leaves are colonized predominantly by bacteria and yeast-like fungi of the families Cryptococcaceae, Sporobolomycetaceae, and of the genus Aureobasidium (Pugh et a i, 1972). The bacterial numbers usually increase significantly before yeasts and filamentous fungi colonize green leaves (Ruinen, 1961).
1.1.1. Fungi on leaf surfaces
3
epicuticular waxes, damage to cuticle or alterations in the host physiology (Dickinson and Wallace, 1976). Studies on the distribution of fungi on leaf surfaces have highlighted the differences between the upper and lower surface populations (Ruscoe, 1971).
1.1.2. Yeasts on the phylloplane
Presence of yeasts on leaf surfaces is likely to be underestimated due to lack of cell motility and relatively low yeast cell concentrations found in air microflora. Numerous reports of abundant leaf surface yeast populations (Last, 1955; di Menna, 1956; Pennycook and Newhook, 1981) suggest that contamination with soil (a rich source of yeasts) during germination, and insect transmission of yeasts provide adequate inoculum. The members of the Cryptococcaceae and Sporobolomycetaceae are the commonest microorganisms on leaf surfaces (Last and Warren, 1972). This suggests that the yeasts are among the most successful colonizers of the phylloplane. The population estimates obtained by cultural methods of study indicate that the numbers of yeast-like forms usually exceed those of filamentous fungi. Among the yeasts, the members of the Cryptococcaceae (e.g. Rhodotorula, Cryptococcus, Torulopsis) and Sporobolomycetaceae (e.g. Sporobolomyces
and Tilletiopsis) and the genus Aureobasidium predominate to the virtual exclusion of the yeasts of the family Endomycetaceae (e.g. Saccharomyces, Hanseniospora). Seasonal variations in yeast populations have been reported (di Menna, 1958). Hislop and Cox
(1969) reported a summer increase in pink yeast populations.
1.1.3. Tea culture
of the tea plant requires adequate rainfall, good drainage and slightly acidic soils. Many tropical and semitropical areas in the world thus become suitable for tea cultivation. The plant which achieves it maximum yield potential around 10 y of age, remains productive for many decades. The apical bud and the two leaves below it constitute the economic yield of tea and is referred to as the ’flush’ in tea jargon. Harvesting is done at intervals of 6-10 d and the harvested leaf is processed in less than 24 h. Tea is produced by a number of developing countries in Asia and Africa and consumed mainly in Britain, West Germany and The Netherlands.
1.1.4. Tea in Sri Lanka
Tea is synonymous with Sri Lanka. Since the introduction of the tea plant (following the devastation of its coffee industry by the ’coffee rust’ caused by the fungus Hemileia vastatrix), tea cultivation spread across the landscape of the island to occupy more than 240 000 ha at present. These estates range in size from less than 2 ha peasant holdings to 1 000 ha plantations, and occur at elevations ranging from sea level to 2 000 m. These produce around 210 Mkg of black tea annually, gaining the position for Sri Lanka of the third largest tea producer in the world. Teas originating from higher altitudes in general are reputed for better quality whereas those produced in lower altitudes possess more colour and strength. Tea occupies an extremely important place in the island’s economy by accounting for more than 40% of the foreign exchange earnings. In addition, the tea sector employs nearly 2 million people, and is the largest employer in the country. Thus, the country’s fortunes are closely linked to the increased earnings of the tea industry.
1.2. Flavour in tea
1.2.1. The tea manufacturing process
5
rapidly growing bud and the two youngest leaves which are suitable for this process, due mainly to chemical composition. Plucking (harvesting) of the green leaf triggers off a series of chemical reactions that are similar to those accompanying leaf senescence. The changes in cell wall permeability caused by the loss of turgidity following plucking allows slow, initial mixing of chemical substances (Wickremasinghe, 1974). Thus in a strict biochemical sense, manufacture starts at plucking. However, control over the sequence of biochemical events following harvesting is not achieved until withering of the leaf begins at the factory.
Withering: The harvested leaf which may contain up to about 75% moisture in the field is spread on troughs and subjected to partial desiccation by blowing hot or cold air through until the moisture content is reduced to 55-45%. During withering the leaf undergoes physical changes in elasticity, turgour, size, weight and volume. The importance of obtaining the correct degree of wither for the success of subsequent steps of the manufacturing process cannot be overstated. Withering, which was earlier thought only to be bringing about a reduction in moisture content, has begun to command careful consideration following reports (Roberts and Sanderson, 1966) that leaf chemical constituents undergo important changes during the process. Considerable biochemical changes of the flavanoids complex, the amino acids, essential oils and the enzyme activity occurring at this stage contribute to the formation of taste and aroma during fermentation. The withering process may take 6-18 h depending on the atmospheric humidity and the quality of the final product aspired.
Rolling: The process of leaf maceration, brings the major group of chemical constituents of the tea leaf -the flavanols- into contact with the enzyme catechol oxidase. Disruption of cells is achieved by subjecting the leaf (on a horizontal metal surface) to the reciprocating action of a heavy mechanical device. The rolling process interferes with the normal metabolic process of cells and replaces it with fermentation, which is the basic process in black tea manufacture. Rolling is carried out intermittently to prevent development of a high temperature that may deactivate the enzyme. Leaf colour changes gradually from dark green to coppery red and a pleasant odour is developed during the rolling process. Severity of rolling determines particle size, a criterion used in grading, and a characteristic associated with specific quality categories. Higher quality ’tippy’ teas are thus subjected to limited periods of light rolling whereas coloury ’dust’ grades are rolled liberally.
6
the major chemical reactions to follow. In addition, these steps in the manufacturing process are extremely important (in their own right) in the development of components of the aroma complex. The flavanols undergo atmospheric oxidation catalyzed by the enzyme catechol oxidase brought into contact during rolling. Fermentation is allowed to take place for a period ranging from 2-4 h at ambient temperature. Resultant complexes of this reaction determine to a great extent the colour and flavour of made tea.
Firing: The fermentation process is terminated by subjecting the leaf mass to a temperature of 90°C in a 20 min period. At the end of the firing, the moisture content of the tea falls to about 3%. During firing the tea leaf undergoes final physical and chemical changes that impart specific taste, colour and odour. The final weight of the manufactured tea is approximately 25% of that of the green leaf.
1.2.2. Biochemistry of tea manufacture
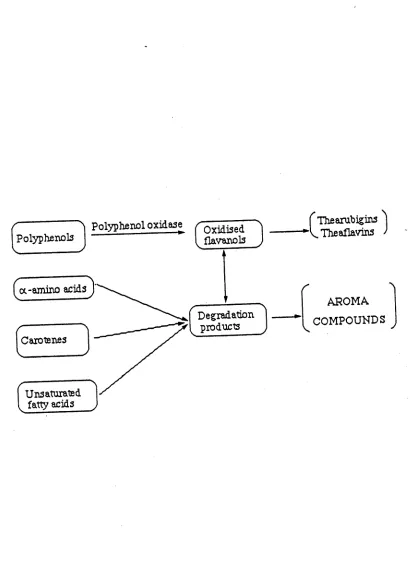
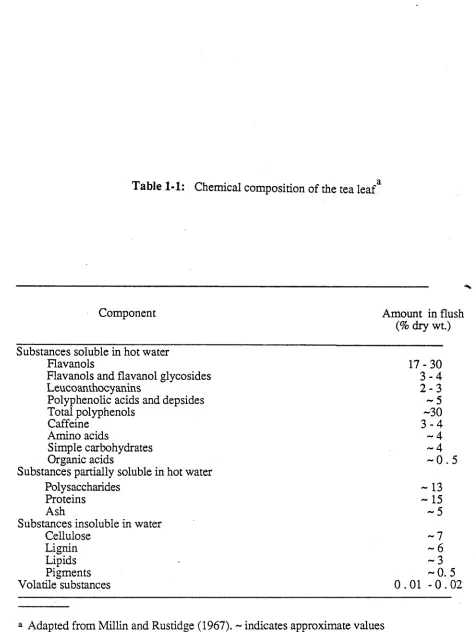
The major biochemical reactions occurring during tea manufacture and discussed under relevant processes are diagramatically presented in Figure 1-1. The mechanical process described in the preceding section is carefully manipulated to produce predetermined characteristics (of particle size, colour and flavour) in made tea. However, the final quality is largely determined by the chemical composition of the tea leaf which demonstrably depends on environmental factors (Ramaswamy, 1963 ; Bhatia and Ullah, 1968) and genetic constitution (Sanderson, 1964a; Bhatia and Ullah, 1968). Such variation may be responsible for the lack of conformity among published data on chemical constituents of tea leaf. However, data in Table 1-1, representing the average, have been reported by Millin and Rustidge (1967).
7
Polyphenol oxidase Polyphenols
( Thearuhigins
VTheaflavins
AROMA
v COMPOUNDS
Figure 1-1: Flow chart of biochem ical changes during
[image:24.554.87.497.57.641.2]8
Table 1-1: Chemical composition of the tea leafa
Component Amount in flush
(% dry wt.) Substances soluble in hot water
Flavanols 17-30
Flavanols and flavanol glycosides 3 - 4
Leucoanthocyanins 2 - 3
Polyphenolic acids and depsides ~ 5
Total polyphenols ~30
Caffeine 3 - 4
Amino acids - 4
Simple carbohydrates ~ 4
Organic acids ~ 0 . 5
Substances partially soluble in hot water
Polysaccharides - 13
Proteins - 15
Ash ~ 5
Substances insoluble in water
Cellulose - 7
Lignin - 6
Lipids - 3
Pigments - 0 . 5
Volatile substances 0 . 0 1 - 0 . 0 2
9
Enzymes: Many enzymes that participate in the metabolism of leaf pigments, proteins and flavanoids have been found in the green tea leaf (Sanderson and Roberts, 1964 ; Ogura, 1969; Wickremasinghe, 1969) . Although the primary role of these enzymes is as catalysts of oxidation and reduction reactions in the tea plant, their study has been concerned mainly with tea processing. The enzyme which assumes a key role in tea manufacture is catechol oxidase. With the use of immunological techniques, Wickremasinghe et al. (1967) showed that this enzyme is located in the epidermis and around vascular bundles of the tea leaf. Leaf maceration in the manufacturing process is carried out to allow catechol oxidase to catalyze atmospheric oxidation of polyphenols which are localized in the vacuoles of the palisade parenchyma of tea leaf tissues.
Amino acids: Although all amino acids usually associated with proteins have been reported in tea, (E. A. H. Roberts and Wood, 1951; G. R. Roberts and Sanderson, 1966) the most abundant is theanine which is unique to tea (Sakato et al., 1950). The amino acids undergo chemical changes during manufacture to result in important aroma compounds. Younger leaves have been found to contain higher levels of free amino acids (Popov, 1956).
Leaf pigments: The main pigments in fresh tea flush are chlorophylls and carotenoids (Wickremasinghe et al., 1965; Co and Sanderson, 1970). During tea manufacture, a large decrease in chlorophyll content is observed with a concomitant increase in its degradation products (Wickremasinghe et al., 1965). The decrease in chlorophyll content has been estimated to be about 75%. Tirimanne and Wickremasinghe (1965) enumerated 14 carotenoids in the tea leaf, identifying only nine of them. Subsequent studies (Sanderson et al., 1971; Ullah, 1979) have enumerated only four carotenoids, a fact attributed to qualitative differences in materials used in these investigations. Studies of compositional changes (Hazarika and Mahanta, 1984) and degradation of carotenoids (Hazarika and Mahanta, 1983) during black tea manufacture have proved that they contribute significantly to the formation of tea aroma.
10
1.2.3. Flavour
Flavour is one of the subjective sensory properties of a food by which it is recognized and enjoyed. Flavour assumes special significance in the international tea trade by forming the basis of tea valuation. Although the appearance, colour, texture and temperature of a food contribute to flavour, taste and aroma are considered its major components (Moncrief, 1967). The compounds that contribute to aroma in food systems exist as trace components unlike taste compounds which exist in relative abundance. Isolation and identification of volatile aroma compounds thus become tedious. The advents of gas liquid chromatography and mass spectrophotometry have proved invaluable in the volatile aroma research. Using these techniques, approximately 5 000 volatile compounds have been identified in foods. Tea contains more than 300 identified volatiles (Yamanishi et al., 1968a). The dependant relationship between tea flavour and its aroma has been demonstrated by tasting teas before and after removal of aroma. Dearomatized tea infusions are almost flavourless and only slightly astringent. Flavour production is generally sought during tea manufacture .due to its economic value.
Many of the aroma compounds are generated during the processing of the food. Processing may include enzymic action, chemical reactions, auto-oxidation, microbial fermentation and cooking. Volatile aroma compounds of tea are formed during the final stage of manufacture (firing). The composition of the aroma complex however, is dependant upon precursors formed by the catabolic reactions undergone by the leaf amino acids, polysaccharides, pigments and other lipids during fermentation. These nonvolatile precursors formed during fermentation react via the Maillard reaction to form compounds responsible for the typical aroma of a tea. The chemical constitution of the leaf and the processing conditions equally influence final flavour.
have showed that high-grown (better quality) teas contain higher quantities of volatiles than low-grown (lower quality) teas (Yamanishi et al., 1968b). Varietal differences in aroma potential of the tea flush also have been reported (Takeo and Mahanta, 1983).
1.2.4. Tea aroma formation
Black teas contain a distinctive aroma from the fresh tea flush from which they originate. Many of the compounds identified in black tea aroma have not been found in fresh green tea flush. The aroma of the green tea flush changes during the manufacturing process, attaining the characteristic black tea aroma after the final (firing) stage of manufacture. Fresh tea leaf contains more alcohols whereas manufactured black tea contains more aldehydes and acids (Saijo and Kuwabara, 1967). In the investigations of the manufacturing process with regard to aroma formation, chemical reactions initiated at withering have been found to be important in the formation of volatile compounds during fermentation (Takeo, 1984). Increase in the degree of wither is accompanied by an increase in linalool, a compound that enhances flavour, and a decrease in Irans-2-hexenal, which is deleterious to flavour (Fernando and Roberts, 1984). However, the major compounds that induce flavour are formed in reactions taking place during fermentation. These reactions culminate at firing, giving rise to some more volatile compounds and resulting in the loss of certain others. Firing process is essential to convert the flowery, greenish aroma of fermented but untired tea into the characteristic flavoury, black tea aroma. Sanderson and Graham (1973) explained this phenomenon by suggesting that some reactions require unusually high oxidation potentials such as those generated at the firing. Yamanishi ex al.,
(1968a) reported that appreciable losses in alcohols, carbonyls, and phenolic compounds present in fermented tea leaf occurred during the firing.
12
the carotenoids. Oxidation of flavanols have been reported to be a precondition for most of the black tea aroma-forming reactions (Sanderson et al., 1971).
1.3. Leaf surface microorganisms and flavour in tea
Flavour, of exceptional quality, in Sri Lankan tea is confined to two brief seasons during the months of January-February and July-August in the Dimbula and Uva tea growing regions respectively. Though effective control over the process of aroma biogenesis is commercially desirable, attempts to induce flavour in tea during other times of the year have been largely unsuccessful. Tea industry sources in Sri Lanka believe that the ’pink yeasts’ colonizing tea leaves during the flavour season in the Dimbula tea growing region play an important role in flavour biogenesis. This belief however has not been substantiated by sound scientific rationale. The possibility exists that this yeast, Rhodotorula glutinis, secretes chemical compounds that enrich tea flavour. The stage of tea manufacture during which the chemical compounds are secreted is of particular importance since any compounds produced on the green leaf surface are bound to undergo chemical changes during the fermentation and firing stages of tea manufacture.
13
ability of Penicillium roqueforti (the fungal species used in blue-cheese making) to convert fatty acids to 2-ketones. The spores of other Penicillium spp. and Aspergillus spp. have been reported to rapidly convert caprylate to 2-heptanone (Gehrig and Knight, 1961). Botrytis cinerea, endemic in some European vineyards, significantly improves the flavour of wines made from the infected grapes. The infection of ripe grapes with B. cinerea (’noble rot’) is essential for the production of some high quality sweet wines of France. This effect is brought about by the unidentified monoterpenes to which linalool is transformed by B. cinerea (Shimizu et al., 1982).
All fungi referred to above have been found on leaf surfaces. However, the in vitro biosynthesis reported has taken place under conditions which are not often encountered on leaf surfaces. In the light of discussion in section 1.1.2. significant growth and establishment of these fungi (which are relatively uncommon on leaf surfaces) is unlikely to take place in the leaf surface environment. Chemical substances secreted on leaf surfaces are destined to be converted to different compounds during tea manufacture. The compounds found in the tea aroma complex are conversion products and none of these compounds have been reported in the green tea leaf. A significant contribution by these compounds formed before the manufacturing process cannot be assumed due to changes they are bound to undergo during the manufacturing process. Phylloplane microorganisms could not be assigned a role in tea aroma formation through the direct biosynthesis of tea aroma compounds.
14
This invalidates the possibility of a contribution (by the yeast) to tea aroma via chemical substances synthesized on the leaf surface, and necessitates novel explanations.
1.3.1. Rhodotorula glutinis and tea flavour - A novel hypothesis
15
16
Chapter 2
Seasonal variation of phylloplane fungi
of Photinia glabra
2.1. Introduction
The leaf surfaces of higher plants provide sanctuary to numerous airborne fungal propagules. Experimental evidence suggests that only a fraction of more than thirty fungal taxa reported on leaf surfaces actually colonize this environment. Ruscoe (1971) estimated that fungi occupied less than one per cent of the surfaces of Nothofagus leaves. Area occupied by fungi on the leaf surfaces of Hordeum vulgare reached 2% in exceptionally favourable conditions (Diem, 1974). Variabilities in the levels of nutrients, temperature, and available moisture, and the presence of inhibitory chemical substances restrict fungal growth on leaf surfaces (Burrage, 1971; Tuckey, 1971; Irvine et al., 1978; Rodger and Blakeman, 1984). Contrary to this situation, the estimates of leaf surface fungal populations obtained by the use of cultural methods of study point to the leaf surface as a site of heightened fungal activity. However, most of these fungal colonies originate from the fungal propagules present inactively on leaf surfaces, and commencing growth in the salubrious environment of the culture medium. Methods of study that distinguish between casual itinerants and the authentic inhabitants of the leaf surface are lacking. Underlying deficiencies of the methods presently employed in phylloplane studies have been discussed by Dickinson (1971) and Lindsay (1976). Direct observation techniques are invaluable in verifying actual fungal growth on leaf surfaces. Use of cultural techniques and supplementary direct observation techniques should yield a composite picture of the phylloplane microflora and its activity.
17
1967); larch (McBride and Hayes, 1977); poplar (Andrews and Kenerley, 1980) and many other plants. However, there are few reports of host specific phylloplane fungi. Ascochytula obiones was restricted to Halimione portulacoid.es (Dickinson, 1965) and Hyalodendron sp. to Quercus robur (Tsuneda and Skoropad, 1978).
Conflicting reports of differences between population numbers and composition of the microflora on upper and lower surfaces of leaves are available in the literature. A higher degree of mycelial growth of Cladosporium on the lower surface was observed by McBride and Hayes (1977) and Andrews and Kennerley (1980). Rodger and Blakeman (1984) reported that numbers of all fungi other than Cladosporium on the upper and lower surfaces of sycamore leaves were equal. Fumagoid fungal colonies were more numerous on the upper surfaces of the leaves of Nothofagus truncata (Ruscoe, 1971). In contrast to these reports, equal population levels of yeasts and fungi on the upper and lower surfaces were recorded by Last (1955), Apinis et al. (1972), Mishra and Dickinson (1981) and Hayes (1982). Populations of yeasts on the two surfaces of apple leaves have been reported to be equal (Andrews and Kenerley, 1980).
Important qualitative and quantitative effects of the seasons on phylloplane microflora have been observed in Pisum (Dickinson, 1967), Hippophae rhamnoides (Lindsey and Pugh, 1976), and sycamore (Rodger and Blakeman, 1984). These studies report a remarkable increase of yeasts and a less marked increase of mycelial fungi during summer. The microflora on the leaves of larch (McBride and Hayes, 1977) and rapeseed (Tsuneda and Skoropad, 1978) have not exhibited such seasonal variations.
18
2.2. M aterials and Methods
2.2.1. Leaves
The leaves were collected fortnightly for a period extending from May to September 1985 from three Photinia glabra plants grown at Weston Park, Yamilumla, A.C.T. Photinia glabra is an evergreen ornamental plant which assumes a bushy growth habit and grows to a height of 2-4 m. A preliminary evaluation of the microflora on the first, second and third leaves from the shoot apex indicated that the microflora on the three leaves did not differ significantly. Therefore the first leaf was sampled. Standardization of sampling was such that similar sample points were used on all three trees throughout the experiment. The sample comprised 45 leaves. Leaves were severed from the shoots with a sterile scalpel into sterile polythene bags, and brought to laboratory where the microflora was isolated in less than 24 h.
2.2.2. Evaluation of culture media
Due to the significance of culture medium in the isolation of leaf surface microflora, a preliminary evaluation of the suitability of four commonly used culture media, Potato Dextrose Agar (PDA), Czapek-Dox Agar (CDA), Com Meal Agar (CMA) and Oat Meal Agar (OMA), was undertaken. Twenty replicate plates of each medium (prepared according to the standard procedures) were inoculated with the leaf print technique. After incubating for 5 d at 25°C the total number of microbial colonies was recorded and the fungi and the yeasts taxonomically classified into major groups. Potato Dextrose Agar was chosen as the medium which facilitated the growth of the widest range of fungi and yeasts.
2.2.3. Methods of isolation of microorganisms
19
Leaf washing: In the washing method, 10 whole leaves were shaken in 100 ml of strile water (in a 250 ml conical flask) in a wrist action shaker for 30 min. The degree of shaking was arbitrarily determined to obtain maximum turbulence without spillage and this degree of shaking was used for all isolations by this method. Samples of 10 leaves provided a fungal population that was representative and convenient to handle. Aliquots (0.1 ml) of washings were spread on the solidified agar surface with a sterile inoculating loop. Twenty replicate inoculations of the washings were done. Leaf area (upper and lower) was measured before the leaves were discarded. Colony development was observed after 5 d of incubation at 25°C and the number of colonies of each fungal species recorded. Fungal colonies were isolated on to PDA slants for identification. The number of colonies were expressed per unit area of leaf surface.
Washed leaf prints: Impressions of the leaves used in the leaf washing method were made on agar plates to examine the extent of removal of propagules by the leaf washing method.
Leaf prints: This method, originally used by Potter (1910), was the most reproducible of all techniques employed in this study. Ten leaves were bisected along the mid rib and the halves were firmly pressed on to the surfaces of solidified culture medium (PDA) to leave an impression of the leaf surface. Special care was taken to expel all air bubbles between the surfaces, since this was found essential for the isolation of all microorganisms. Two halves of each leaf were used to sample the adaxial and abaxial surface microflora. Petri plates were incubated at 25°C for 5 d and the colonies were counted and isolated for identification. Leaf area was measured and the results expressed as number of colonies per unit leaf area.
Sporefall technique: This selective technique, originally used by Last (1955) was used to isolate the yeasts which forcibly discharge their spores. Ten leaves were bisected along the midrib and pasted on to the lid of the Petri dish with one half exposing the upper and the other the lower surface to the medium. After incubation for 48 h the leaves were removed and the plates incubated for a further 3 d before examination.
20
staining with cotton blue - lactophenol. Results were expressed as the mean number of propagules per unit area of leaf surface.
Scanning Electron Microscopy: Ten leaves were cut in to 1 cm2 squares avoiding the mid rib. These leaf squares were immersed in liquid No for 20 min and placed overnight in a Dynavac freeze drier under vacuum at -40°C. The leaf squares were placed on SEM specimen stubs, sprayed with a 200 A layer of gold. Upon drying they were observed at 30 kV in a Cambridgescan S I80 Scanning Electron Microscope. Preparations were made with either adaxial or abaxial surface of leaves uppermost.
Meteorological data: Daily charts of maximum and minimum temperature, relative humidity and rain fall data were obtained from the A.C.T. Regional Office of the Weather Bureau. Weather data had been recorded at a site approximately 1 km from the site of sampling. Climatic variables are presented as means for the fortnight preceding sampling date, except for rainfall which is expressed as fortnightly total. Correlation analysis was carried out by the Genstat statistical package.
Identification o f fungi: Majority of fungi isolated were common Fungi Imperfecti and were identified in the laboratory. Specimens of rare fungi were sent to the Commonwealth Mycological Institute, Surrey, England for identification. The yeasts were identified by the
Centraalbureau voor Schimmelcultures, Baam, The Netherlands.
2.3. Results
M ed iu m P h y c A sc o B a si F .I n 21 2 \c © o. % —
-^ sh td *^ c3
o 2 £ § 3 s ° o ii 'S < • | S
So
«« ^
_2 öjo
Ö «
ll "2
11 D •s £
«Ö e CQ £ « o S<J
ü II
£ < 8 0 c3 2P < VIV} c3 ü oH
" X
8-o < 2 C3
g O
w Cu u ,
8 ii §>
p < 3
C Q X
O k* o
!■ = 2
a | I
-O 1> c3 3 «Joo •£<
00 W
.a E
§ S o 2 O -3 *—1 * \
u < Q Oi
c
s
u < < Q CJo ’äb <2
s
E £ U
22
Agaricus were observed in the direct microscopic study). Based on these results PDA was used as the culture medium for periodic samples.
The estimates of the three major fungal species inhabiting the phylloplane of Photinia glabra at this location (Epicoccum nigrum, Alternaria alternata and the yeasts) provided by the leaf washing, washed leaf prints and leaf print techniques are given in Figure 2-1. While leaf prints isolated the highest proportion of the populations of all fungi and yeasts, leaf washing method provided the lowest estimates. In the case of yeasts, the relative efficiencies of the three techniques appear to differ least, though with significantly lower population estimates provided by the washing method. Estimates provided by the washed leaf prints almost amount to the differences between the washing and impression techniques. All three techniques reveal seasonal trends of the microflora without distortion. The significant increase of E. nigrum and the populations of the yeasts from the 4 May to 11 May and the reductions in populations between 25 May and 30 May have been conveyed by all methods. However, on a number of sampling dates contrasting population estimates have been provided by the different techniques.
Sample characteristics: Relatively high variation of fungal counts among replicate leaves was observed on all sampling dates. Table 2-2 exhibits this variation within samples. Large values of standard deviation and standard errors could not be reduced by increasing sample size in the manageable range. Variation was greater in yeast populations than in mycelial fungi. The variation in total microbial population has been largely due to the variation in yeast populations. Consistently high E. nigrum populations have exhibited comparatively little variation.
2.3.1. Fungal and yeast populations on the leaf surfaces of Photinia glabra
23
24 CJ wo Cn 00 W 00 1> VC V * -K oc (N Tf vo od Cn CN <N
<n oc oc oo cd <N
uo ^r vo
o \ OC 1-H CN >—•
C •2? 2 vj .§ § 3 3 £ I i». 3 /—q CN +1 cn d vC vc oc vd CO co C/J 0> q ^r +1 oo vd o oo d r-d co
CN oc vc
VO o
52 a C/) i OJQ t-,
I
C I e2 u c C3 Üs
CÖ <— O c .2 eS • <U -a -ac 2 c/5 l>* oo o b <u T3U) S3 T3 C 2 II c/T .2 *c ro O <4-12 - 2
J
5
g
S 2 2 ^ - D c o cs a <u <o
11
g
l> ^ U
c
.2
00 .2
to
—1 O 23 CO i , 1 1 i CN 24 04
do
m
r—H to 77 OT“Hn -st i 1 »—OH i 'Str-H o DO
ON DC Os r—H ON ,
04
c a
—4 o CN O
1 i o O i i r—; o
o VO
CO D O r - CN n CN VC r-H VO
’—t CN o o 1 O i i 1—1 o o
c c r - XT CN CN n
c a n
<—1 O (N r-H i 1 1 i i
1 CN t—s o T"H '“-n n r—l r - CO CN r-H co
N«-' r-H
S t—t /—-s
I—J ^sr CN CN o o o O i CN o
VO > -J 9 0 3 2
1 02 1 1
r-H
O 1 o 26 CO 03
(Nr-j co '--hJ COCN COOs 1 o OCN T“Ho COO 1 \ 0o Os CNO
4
'■S'. CN 'Sf o - _ o
■U CN 1 1 i 1 i | 1 h .-*N
' c
o n
o
(J 1—1 '—i ON 'S}" CO _ t-H , |
DO
U-i >-J CO O O o i 1 O 1 1 T -H r - s O
o u
<u —1 r <r—H i—i "Sf n VO
CN o 1 i 1 1 1 1 CN o o
r2 n
i co D 26 VO o o i 1 1 1 1 O CO ■st
-J On Cs ( r-H ON o Os
n o o 1 1 i 1 o 1 o o
n ’—
\ r - ■sf CN CN CN ,
CO CO DC
N—' O 1 o O o O o O
—1
-J no CN CO r-H r-H VO Os n
O 1 i o o 1 O
!Q
t <
Z3 VO
CO
i 07 o 1 02 1 42 VO ON
1 .CÖ s: § CS vj •§ £ I i I Q Cj c a 1 cu 2
U - 5 a
Sj • 5
SJ 5Qs OC/3h
Q P
is. SU
Q> Q
• 5 Q a - ^
i §-a
a .<=0 2a
S i-5 Q) -C> - a Co § •=2 5 a so <o 'S J Qi 1 a 3 £ • a a a<5 a c
a
a 5 • —«» * - -4I
-a
S3 so O soa
& c,