JROPÄISCHE WIRTSCHAFTSGEMEINSCHAFT COMUNITÀ' ECONOMICA EUROPEA EUROPESE ECONOMISCHE GEMEENS*
S T A T I S T I S C H E S A M T
OPÄISCHE
O F F I C E
S T A T I S T I Q U E
rOMIC
D E R E U R O P Ä I S C H E N G E M E I N S C H A F T E N
E U R O
D E S C O M M U N A U T É S E U R O P É E N N E S
L <
AUTE EUROPEENNE D U CHARBON ET DE L'ACIER COMUNITÀ' EUROPEA DEL CARBONE E DELL'ACCIAIO EUROPESE <
: H A P VOOR KOLEN EN STAAL EUROPÄISCHE WIRTSCHAFTSGEMEINSCHAFT COMMUNAUTE ECONOMIQUE EUROPEENNE CC
ECONOMICA EUROPEA EUROPESE ECONOMISCHE GEMEENSCHAP EUROPÄISCHE ATOMGEMEINSCHAFT COMMUNAUTE EUl
E DE L'ENERGIE ATOMIQUE COMUNITÀ' EUROPEA DELL'ENERGIA ATOMICA EUROPESE GEMEENSCHAP VOOR ATOOMENERGIE
UNAUTE EUROPEENNE D U CHARBON ET DE L'ACIER EUROPÄISCHE GEMEINSCHAFT FÜR KOHLE U N D STAHL CÖMUI
ROPEA DEL CARBONE E DELL'ACCIAIO EUROPESE GEMEENSCHAP VOOR KOLEN EN STAAL COMMUNAUTE ECONOMIQUE EUl
E EUROPÄISCHE WIRTSCHAFTSGEMEINSCHAFT COMUNITÀ' ECONOMICA EUROPEA EUROPESE ECONOMISCHE GEMEENSCHA
MUNAUTE E
A EUROPE!
INNE DU CH
4
STAAL EU
A EUROPE
MIQUE Q
JROPEENNE
E E DELL'AC)
'IRTSCHAFTS!
■NNE DE L'E
MEENSCHAP
DN ET DE L
JROPÄISCHE
!SE ECONOfJ
MUNITA' EU
IBON ET DE)
JROPESE GEMEENSCHA!
IHAFT COMUNITÀ' EGON
ERGIE ATOMIQUE EUROPÄI.
—
DR ATOOMENERGIE EU ROP. V î
R COMUNITÀ' EUROPEA DEL
A F T S G E M E I N S C H A F T COMMU. V J *
AEENSCHAP EUROPÄISCHE ATC " *
ENERGIA AT(
IOPÄISCHE C
VOOR KOLEI
DMICA EURC
rOMGEMEINS
E GEMEINSCI
IONE E DELL
ΓΕ ECONOMI
3EMEINSCHA
EMEENSCHAF
KOHLE Uh
AAL — COA
IROPEA I l
"OMGEMEINS
EUROPÄISCH
3MUNITA' EUROPEA DEL CARBONE
IRTSCHAFTSGEMEINSCHAFT COMMUNAUTE
ECONOMIQUE
INDUSTRIESTATISTIK
STATISTIQUES INDUSTRIELLES
STATISTICHE DELL'INDUSTRIA
INDUSTRIESTATISTIEK
INDUSTRIAL STATISTICS
DELL'ACCIAIO
ATOMGEMEINSCHAFT COMUNITÀ' EUROPEA DELL'ENERGIA
ISCHE GEMEINSCHAFT FÜR KOHLE U N D STAHL COMMUNAUTE
»•'p E DELL'ACCIAIO EUROPESE GEMEENSCHAP VOOR
T"47Vo«w*'
V A I Q U E E U R O P E E N N E COMUNITÀ' ECONOMIC
* ύ Γ/—.
"
- COMMUNAUTE EUROPEENNE DE L'ENEI
*P VOOR ATOOMENERGIE - COMML
Í J ^
%STAHL COMUNITÀ' EUROPEA DEL
' nNOMIQUE EUROPEENNE EURO!
* · ( \ GEMEENSCHAP COMMUNAUTE
>* A
ELL'ENERGIA ATOMICA EURC
>MMUNAUTE EUROPEENNE DI
> Λ
MSCHAPVOOR KOLEN EN S
TA' ECONOMICA EUROPEA
NNE DE L'ENERGIE ATOMIC
•MMUNAUTE EUROPEENNE
t DEL CARBONE E DELL'AC
ROPÄISCHE WIRTSCHAFTS
MUNAUTE EUROPEENNE
/ICA EUROPESE GEMEENS
JPEENNE DU CHARBON ET I
ι EN STAAL EUROPÄISCHE !
* ROPEA EUROPESE ECONOMI
Λ /
i'OMIQUE COMUNITÀ* EUROF
V A '
¿ENNE DU CHARBON ET DE L'A<
• ^
DELL'ACCIAIO EUROPESE GEMEE
► SCHAFTSGEMEINSCHAFT - COMUNI!
&
<NE DE L'ENERGIE ATOMIQUE - EUROF
/EENSCHAP VOOR ATOOMENERGIE - EUR
. A R B O N ET DE L'ACIER - COMUNITÀ' EUROPEA
- EUROPÄISCHE WIRTSCHAFTSGEMEINSCHAFT - COA
OPEA - EUROPESE ECONOMISCHE GEMEENSCHAP - EUROPÄISCI
TOMIQUE - COMUNITÀ' EUROPEA DELL'ENERGIA ATOMICA - EU
[ENNE DU CHARBON ET DE L'ACIER - EUROPÄISCHE GEMEINSCH
NE E DELL'ACCIAIO - EUROPESE GEMEENSCHAP VOOR K O I
OPÄISCHE WIRTSCHAFTSGEMEINSCHAFT - COMUNITÀ' ECON
UNAUTE EUROPEENNE DE L'ENERGIE ATOMIQUE - EUROP
ATOMICA - EUROPESE GEMEENSCHAP VOOR ATOÓME
COMMUNAUTE EUROPEENNE DU CHARBON ET DE L'A
ROPESE GEMEENSCHAP VOOR KOLEN EN STAAL - EUROP
EUROPEENNE - COMUNITÀ' ECONOMICA EUROPEA - EU
tfOU5\£
d *
ONOMISCHE GEMEENSCHAP - EUROPÄISCHE ATOMGEMEINSCHAFT - COMMUNAUTE EUROPEENNE DE L'ENERGIE ATOMI
5MUNITA' EUROPEA DELL'ENERGIA ATOMICA - EUROPESE GEMEENSCHAP VOOR ATOOMENERGIE - COMMUNAUTE EUROPEENN
MWON ET DE L'ACIER - EUROPÄISCHE GEMEINSCHAFT FÜR KOHLE UND STAHL - COMUNITÀ' EUROPEA DEL CARBONE E DELL'A
EUROPESE GEMEENSCHAP VOOR KOL >PEENNE - EUROPÄISCHE WIRTSCHAFTS<
HAFT - COMUNITÀ' ECONOMICA EU 1 9 7 0 " HO. 2 - COMMUNAUTE EUROPEENNE DE L'ENE
)MIQUE - EUROPÄISCHE ATOMGEMEI fOMICA - EUROPESE GEMEENSCHAP VOC
/ENERGIE - EUROPÄISCHE GEMEINSCHAFT FÜR KOHLE UND STAHL - COMMUNAUTE EUROPEENNE DU CHARBON ET DE L'ACIE
JNITA' EUROPEA DEL CARBONE E DELL'ACCIAIO - EUROPESE GEMEENSCHAP VOOR KOLEN EN STAAL - EUROPÄISCHE WIRTSO
IEINSCHAFT - COMMUNAUTE ECONOMIQUE EUROPEENNE - COMUNITÀ' ECONOMICA EUROPEA - EUROPESE ECONOMISCHE GE.
lAP - EUROPÄISCHE ATOMGEMEINSCHAFT - COMMUNAUTE EUROPEENNE DE L'ENERGIE ATOMIQUE- COMUNITÀ' EUROPEA DÉ
ilAAT I S T I T U T O S T A T I S T I C O ATOOMENERGIE - COM B U R E A U V O O R DE S T A T I S T I E K
CIER-ISCHE DELLE C O M U N I T À E U R O P E E - COMUNITÀ'EUROPEA DER E U R O P E S E G E M E E N S C H A P P E N
5R KOLEN EN STAAL - COMMUNAUTE ECONOMIQUE EUROPEENNE - EUROPÄISCHE WIRTSCHAFTSGEMEINSCHAFT - COMUNITÀ
STATISTISCHES AMT
DER EUROPÄISCHEN GEMEINSCHAFTEN
Anschriften
Luxemburg, Centre Louvigny, Postfach 130 — Tel. 288 31
1040 Brüssel, Bâtiment Berlaymont, 200, rue de la Loi (Verbindungsbüro) — Tel. 35 80 40
OFFICE STATISTIQUE
DES COMMUNAUTÉS EUROPÉENNES
Adresses
Luxembourg, Centre Louvigny, Botte postale 130 — Tél. 288 31
1040 Bruxelles, Bâtiment Berlaymont, 200, rue de la Loi (Bureau de liaison) — Tél. 35 80 40
ISTITUTO STATISTICO
DELLE COMUNITÀ EUROPEE
Indirizzi
Lussemburgo, Centre Louvigny, Casella postale 130 — Tel. 288 31
1040 Bruxelles, Bâtiment Berlaymont, 200, rue de la Lol (Ufficio di collegamento) — Tel. 35 80 40
BUREAU VOOR DE STATISTIEK
DER EUROPESE GEMEENSCHAPPEN
Adressen
Luxemburg, Centre Louvigny, Postbus 130 — Tel. 288 31
1040 Brussel, Bâtiment Berlaymont, Wetstraat 200 (Verbindingsbureau) — Tel. 35 80 40
STATISTICAL OFFICE
OF THE EUROPEAN COMMUNITIES
Addresses
Luxemburg, Centre Louvigny, P.O.Box 130 — Tel. 288 31
INDUSTRIESTATISTIK
STATISTIQUES INDUSTRIELLES
STATISTICHE DELL'INDUSTRIA
INDUSTRIESTATISTIEK
INDUSTRIAL STATISTICS
1970-No. 2
Vierteljährliche Ausgabe
Inhaltswiedergabe nur mit Quellennachweis
gestattet
La reproduction des données est subordonnée
à l'indication de la source
La riproduzione del contenuto è subordinata
alla citazione della fonte
Het overnemen van gegevens is toegestaan
mits met duidelijke bronvermelding
Vorwort
Avertissement
Avvertenza
Voorwoord
Im ersten Teil dieses Heftes werden die Indizes der industriellen Produktion in
den Mitgliedstaaten und in einer Reihe von Drittländern mitgeteilt. Bis
einschließ-lich Nummer 1968 wurden diese Indizes auf der Basis 1958 = 100 veröffenteinschließ-licht.
Seit einiger Zeit ist das Statistische Amt in Zusammenarbeit mit den Statistischen
Zentralämtern der Mitgliedstaaten bemüht, dieses Basisjahr auf 1963 = 100
umzu-stellen. Zwar hegen bis jetzt teilweise noch vorläufig umgerechnete Zahlen vor. Es
schien aber zweckmäßig, bereits im Jahrbuqh 1969 diese Indizes auf der Basis
1963 ==100 mitzuteilen. Das Amt hofft, so schnell wie möglich die endgültigen
Zahlen veröffentlichen zu können. Der zweite Teil enthält die mengenmässigen
Produktionsergebnisse von ungefähr 500 Erzeugnissen. Die Produktionsindices
Deutschlands beziehen sich auf das Bundesgebiet und Berlin (West), während
die mengenmässigen Produktionsangaben erst ab 1964 auch die Produktion in
Berlin (West) enthalten. Das Statistische Amt möchte an dieser Stelle den
interna-tionalen und nainterna-tionalen Dienststellen, den Regierungsbehörden und Fachverbänden,
die am Aufbau einer europäischen Industriestatistik mitgearbeitet haben, seinen
besten Dank ausdrücken.
La première partie de ce bulletin est consacrée aux indices de la production
in-dustrielle dans les États membres et dans certains pays tiers. Ces indices ont été
publiés sur la base 1958 = 100 jusqu'au n° 1968. Depuis un certain temps, l'Office
statistique s'est efforcé, en collaboration avec les Offices statistiques nationaux
des États membres, de convertir cette année de base en 1963 = 100. Cependant,
jusqu'à maintenant, les chiffres résultant de cette conversion sont encore
partielle-ment provisoires. Il s'est pourtant avéré souhaitable de publier ces indices
provi-soires sur la base 1963 = 100 dès l'Annuaire 1969. L'Office s'efforcera d'obtenir
les chiffres définitifs pour publication le plus tôt possible. La deuxième partie
porte sur la production en unités physiques d'environ 500 produits. Les indices
allemands de production couvrent le territoire fédéral et Berlin (Ouest); les
don-nées sur la production en unités physiques de l'Allemagne comprennent seulement
à partir de 1964 la production de Berlin (Ouest). L'Office statistique tient à
re-mercier les organismes internationaux et nationaux, gouvernementaux et
profes-sionnels, qui ont bien voulu apporter leur concours à l'édification d'une statistique
industrielle européenne.
La prima parte del presente bollettino è dedicata agli indici della produzione
in-dustriale nei Paesi membri ed in alcuni paesi terzi. Questi indici sono stati
pubbli-cati in base 1958 = 100 fino al n° 1968. Da qualche tempo l'Istituto statistico, in
collaborazione con gli Istituti statistici nazionali dei Paesi membri, ha cercato di
convertire l'anno base al 1963 = 100. Le cifre risultanti da questa conversione
sono per ora ancora parzialmente provvisorie; tuttavia è stato considerato utile
pubblicare questi indici in base 1963 = 100 già a partire dall'Annuario 1969.
L'Isti-tuto cercherà di ottenere le cifre definitive per la pubblicazione il più presto
possi-bile. La seconda parte riguarda la produzione in unità fisiche di circa 500 prodotti.
Gli indici tedeschi si riferiscono al territorio federale e Berlino (occidentale),
mentre le cifre di produzione per la Germania comprendono solamente dal 1964
anche la produzione di Berlino (occidentale). L'Istituto statistico ringrazia qui le
organizzazioni internazionali e nazionali, governative e professionali che hanno
voluto concorrere ad edificare una statistica industriale europea.
INHALTSVERZEICHNIS
TABLE DES MATIÈRES
Vorbemerkung
Inhaltsverzeichnis
Zeichen und Abkürzungen
1. T e i l : Indizes d e r i n d u s t r i e l l e n P r o d u k t i o n in den M i t g l i e d s t a a t e n d e r Gemeinschaft und in einigen d r i t t e n L ä n d e r n
2. T e i l : A n g a b e n über die P r o d u k t i o n von G r u n d
stoffen und Fertigerzeugnissen in d e r
G e m e i n s c h a f t
Gewinnung von Brennstoffen und Erzen
Gewinnung von Baumaterial und feuerfesten und kera
mischen Erden
Herstellung von ö l e n und Fetten tierischer und pflanzlicher
H e r k u n f t
Nahrungsmittelindustrie
Getränke und Tabakindustrie
Textilindustrie (Spinnerei und W e b e r e i )
W i r k e r e i und Strickerei
Sonstiges Textilgewerbe
Schuhindustrie
Herstellung von Bekleidung und Wäsche
Holzverarbeitung (außer Möbelherstellung)
Papier und Pappenerzeugung und Verarbeitung
Herstellung von Leder
Gummiverarbeitung
Chemiefasererzeugung
Stärkeindustrie
Herstellung chemischer Erzeugnisse
Mineralölverarbeitung
Ziegeleien
Herstellung und Verarbeitung von Glas
Herstellung von Steinzeug, Feinkeramik und feuerfesten Erzeugnissen
Herstellung von Baumaterialien und sonstigen Erzeugnissen aus Steinen und Erden
Eisen und stahlerzeugende Industrie (gemäß dem EGKS
Vertrag)
Stahlröhrenerzeugung; Ziehereien und Kaltwalzwerke . . .
Erzeugung und erste Verarbeitung von NEMetallen; Gieße reien
Schmiede, Preß und Hammerwerke sowie Stahlverformung
EBMWarenherstellung
Maschinenbau
Elektrotechnische Industrie
Fahrzeugbau
Feinmechanische und Uhrenindustrie
Baugewerbe
Elektrizitäts und Gaserzeugung
Aufstellung der in d e r Reihe „ I n d u s t r i e s t a t i s t i k " veröf f e n t l i c h t e n S o n d e r b e r i c h t e
Seite ■ Page 3
4
6
21
23
25
27
28
32
33
37
38
39
41
44
46
49
51
55
56
57
68
70
71
73
75
77
79
80
82
83
85
93
97
100
101
104
106
Avertissement
Table des matières
Abréviations et signes employés
Ie p a r t i e : Indices de la p r o d u c t i o n i n d u s t r i e l l e dans les pays de la C o m m u n a u t é e t certains pays t i e r s
2e p a r t i e : D o n n é e s sur la p r o d u c t i o n dans la C o m m u n a u t é d e c e r t a i n e s m a t i è r e s d e base e t d ' a r t i c l e s é l a b o r é s
Extraction de combustibles et de minerais
Extraction de matériaux de construction et de terres à feu
Industrie des corps gras végétaux et animaux
Industries alimentaires
Industrie des boissons et tabacs
industrie t e x t i l e (filature et tissage)
Bonneterie
Autres industries textiles
Industrie des chaussures
Fabrication des articles d'habillement
Industrie du bois (à l'exclusion de l'industrie du meuble)
Industrie du papier et fabrication des articles en papier
Tannerie mégisserie
Transformation du caoutchouc
Production de fibres artificielles et synthétiques
Industrie des produits amylacés
Industrie chimique
Industrie du pétrole
Fabrication de matériaux de construction en t e r r e cuite
Industrie du verre
Fabrication des grès, porcelaines, faïences et produits réfrac tai res
Matériaux de construction et produits minéraux non métalli ques
Sidérurgie (selon le traité CECA)
Première transformation de l'acier
Production et première transformation des métaux non
f e r r e u x ; fonderies
Forge, estampage, emboutissage et industries connexes
Fabrication d'outillage et d'articles finis en métaux
Construction de machines non électriques
Construction électrique
Construction de matériel de t r a n s p o r t
Mécanique de précision et horlogerie
Bâtiment et génie civil
Production d'électricité et de gaz
[image:6.595.64.566.43.703.2]INDICE
INHOUDSOPGAVE
Avvertenza Indice
Abbreviazioni e simboli impiegati
Ia p a r t e : Indice della produzione industriale nei paesi
della C o m u n i t à e in alcuni paesi t e r z i . . . .
2a p a r t e : D a t i sulla produzione di alcune ma
t e r i e p r i m e ed articoli elaborati nella C o m u n i t à
Estrazione di combustibili e di minerali metallici
Estrazione di materiali da costruzione e di terre refrattarie e per ceramica
Industria dei grassi vegetali e animali Industrie alimentari
Industrie delle bevande e del tabacco Industria tessile (filatura e tessitura)
Fabbricazione di tessuti a maglia, maglierie e calze A l t r e Industrie tessili
Industrie delle calzature
Fabbricazione di articoli d'abbigliamento e biancheria . . . Industria del legno (esclusa l'industria del mobile)
Industria della carta e della sua trasformazione Concia del cuoio e delle pelli
Trasformazione della gomma
Produzione di fibre artificiali e sintetiche Industria dei prodotti amilacei
Industrie chimiche Industria del petrolio
Fabbricazione di materiale da costruzione in laterizio . . . Industria del vetro
Fabbricazione di grès, porcellane, maioliche, terrecotte e prodotti refrattari
Materiali da costruzione e prodotti minerali non metallici . . Siderurgia (secondo il trattato CECA)
Prima trasformazione dell'acciaio
Produzione e prima trasformazione di metalli non ferrosi, fonderie
Forgiatura, stampaggio, imbutitura e industrie collegate . .
Fabbricazione di utensili e articoli finiti in metallo . . . . Costruzione di macchine non elettriche
Costruzione di macchine e materiale elettrico Costruzione di materiale da trasporto Meccanica fine ed orologeria
Costruzione e genio civile Produzione di elettricità e di gas
Elenco delle note pubblicate nella serie « Statistiche dell'industria »
Pajina - Blz.
3
5
7
21
23
25
27
28
32
33
37
38
39
41
44
46
49
51
55
56
57
63
70
71
73
75
77
79
80
82
83 85 93 97 I00 101 104
106
V o o r w o o r d Inhoudsopgave Tekens en afkortingen
Deel 1 : Indices van de industriële produktie in de landen van de Gemeenschap en in enige derde landen
Deel 2 : Produktiecijfers van enige basisgrond stoffen en b e w e r k t e produkten in de Gemeenschap
W i n n i n g van brandstoffen en ertsen
Winning van bouwmaterialen en van vuurvaste en keramische
klei
Vervaardiging van oliën en vetten van dierlijke of plantaardige oorsprong
Voedingsmiddelenindustrie
Vervaardiging van dranken; tabaksnijverheid Textielnijverheid (spinnerij en weverij) Tricot- en kousenindustrie
Overige textielnijverheid Schoenindustrie
Vervaardiging van kleding en huishoudgoederen
Verwerking van hout (m.u.v. de vervaardiging van meubelen) Vervaardiging van papier en papierwaren
Leerlooierijen Rubberfabrieken
Kunstmatige en synthetische vezelfabrieken Zetmeelfabrieken
Chemische industrie Aardolie-industrie
Baksteen- en dakpannenfabrieken Glas- en glaswarenfabrieken
Aardewerkfabrieken; vuurvast-materiaalfabrieken
Bouwmateriaalfabrieken; bewerking van niet-metalen mine-ralen
IJzer- en staalindustrie (volgens EGKS-Verdrag) Stalenbuizenfabrieken; trekkerijen en koudwalserijen
Vervaardiging en bewerking van non-ferrometalen ; gieterijen Smeed-, pers-, stampwerk e.d.
Gereedschappen-, ijzer-, staal- en andere metaalwaren-fabrieken
Machinebouw
Elektrotechnische industrie Transportmiddelenindustrie
Fijnmechanische en uurwerkindustrie Bouwnijverheid
Elektrlciteits- en gasbedrijven
ZEICHEN U N D A B K Ü R Z U N G E N
ABRÉVIATIONS ET SIGNES EMPLOYÉS
Nichts
Unbedeutend (im allgemeinen weniger als die Hälfte der kleinsten In der betreffenden Reihe verwendeten Einheit oder Dezimale)
Kein Nachweis vorhanden
Unsichere oder geschätzte Angabe
Schätzung des Statistischen Amtes der Europäischen Ge meinschaften
Änderung des Inhalts einer Reihe
Angaben für das Landwirtschaftsjahr, das im angegebenen Kalenderjahr endet
Erzeugung Lieferungen Montage
Materialverbrauch Gramm
Metrische Tonne
Liter
Stück
Meter
Quadratmeter
Kubikmeter
Paar
Kilowatt
Terawattstunde = 10* k W h
Kalorie
Terakalorie = 10* kcal
Oberer Heizwert Unterer Heizwert
Steinkohleneinheit (7000 cal Hu/g) Pferdestärke
KilovoltAmpere
Bruttoregistertonne
Million
Milliarde
Jahrestonne
M i t , , davon " werden alle Fälle gekennzeichnet, in denen sämtliche Unterpositionen einer Position angegeben sind; die Aufgliederung in nur einige Unterpositionen wird durch „ darunter " kenntlich gemacht.
0
11
II
•
ρ L M C
g
t
I p/st
m
m» m3
Pa
k W
T W h
cal
Teal
Ho/PCS Hu/PCI SKE/tec
CV
kVA
TB BRT Mio
Mrd jato t/an davon
soit darunter
dont
Néant
Donnée très faible (généralement inférieure à la moitié de la dernière unité ou décimale des nombres mention nés sous rubrique)
Donnée non disponible
Donnée incertaine ou estimée
Estimation par l'Office statistique des Communautés européennes
Changement de portée d'une série
Campagne de 12 mois finissant au cours de l'année indi quée
Production Livraisons Assemblage
Consommation de matières premières Gramme
Tonne
Litre
Pièces
Mètre
Mètre carré
Mètre cube
Paire
Kilowatt
Terawattheure = 10* k W h Calorie
Teracalorie = 10* kcal
Pouvoir calorifique supérieur Pouvoir calorifique inférieur
Tonne équivalent charbon (7000 cal PCI/ ) Chevalvapeur
Kilovoltampère
Tonneau de jauge brut
Million
Milliard
Tonne/an
ABBREVIAZIONI E SIMBOLI IMPIEGATI
TEKENS EN AFKORTINGEN
Nulla
Dato bassissimo (generalmente inferiore alla metà dell'ul tima unità o decimale delle cifre che appaiono nella colonna)
Dato non disponibile Dato Incerto o valutato
Valutazione fatta dall'Istituto statistico delle Comunità europee
Variazione del contenuto della serie
Campagna di 12 mesi terminante nell'anno indicato
Produzione Consegne Montaggio
Consumo di materie prime Grammo
Tonnellata Litro Pezzi Metro
Metro quadrato Metro cubo Paia Kilowatt
Terawattora = 10* k W h
Caloria
Teracaloria = 10* kcal Potere calorifico superiore Potere calorifico Inferiore
Tonnellata equivalente di carbon fossile (7000 cai PCI/g) Cavallo vapore
Kllovoltampère
Tonnellate di stazza lorda
Milione Miliardo
Tonnellate / anno
La parola « dont », dopo le cifre che si riferiscono ad un gruppo di articoli, indica la presenza di alcune suddi visioni particolari, mentre il termine « soit » significa che tutte le suddivisioni del gruppo generale sono pre senti.
0
[ ]
l
•
ρ L M C
g t
I P/st
m m" m» Pa k W T W h
cal Teal Ho/PCS
Hu/PCI SKE/tec CV kVA
TB BRT Mio Mrd
jato t/an davon
soit (ossia) (daarvan) darunter dont (di cui) (daaronder)
Nul
Zeer kleine hoeveelheid (in het algemeen minder dan de helft van de kleinste in de betreffende reeks gebruikte eenheid of decimaal)
Geen gegevens beschikbaar Onzekere of geschatte gegevens
Schatting van het Bureau voor de Statistiek der Europese Gemeenschappen
Wijziging in de inhoud van een reeks
Boekjaar (landbouw, oogstjaar) dat in het aangegeven kalenderjaar eindigt
Produktie Afzet Assemblage
Verbruik van grondstoffen Gram
Metrische tonnen Liter
Stuks Meter
Vierkante meter Kubieke meter Paar
Kilowatt
Terawattuur = 10» k W h Kalorie
Terakalorie = 10* kcal Kalorische bovenwaarde Kalorische onderwaarde
Steenkoleneenheden (7000 cal onderwaarde/g) Ρ aardekracht
Kllovoltampère
Brutoregisterton
Miljoen Miljard
Ton / jaar
Erster Teil
Indizes der industriellen Produktion
in den Mitgliedstaaten der Gemeinschaft
und in einigen dritten Ländern
Première partie
Indices de la production industrielle
dans les pays de la Communauté
et certains pays tiers
Prima parte
Indici della produzione industriale
nei paesi della Comunità
e in alcuni paesi terzi
Eerste deel
Indices van de industriële produktie
in de landen van de Gemeenschap
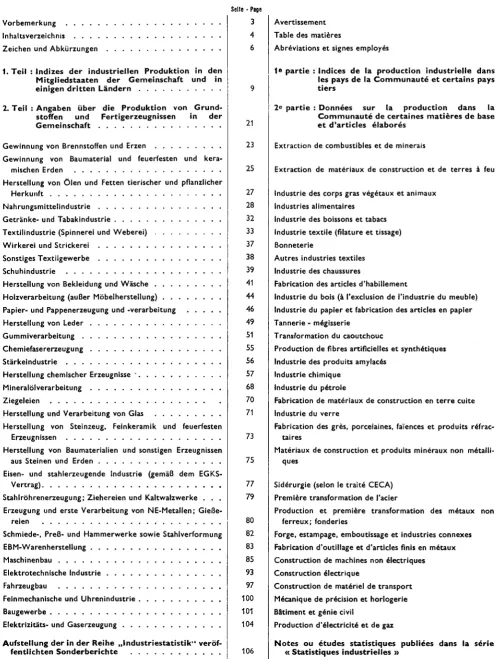
Index der industriellen Produktion
Indici della produzione industriale
Indices de la production industrielle
Indexcijfers van de industriële produktie
1963 = 100
Insgesamt (ohne Baugewerbe) Totale (esclusa l'edilizia)
Ensemble (sans bâtiment) Metallverar4eitende Industrie | Transformation des métaux [ Totñal (zonder bouwnijverheid) 300 Trasformazione dei metalli Metaalverwerkende i n d u s t r i e ,
280
260 240 220 200 180 160
140
120
100 90
Bergb Indus
au rie estrattive
j
ι ι 'Γ
_..;—
·./!
·
i "
>"
*"
. L
É
_|.
[
I
' ■ ·
·.
Indi
.··
str
_/
···
es
/'
...
îxtr Mi
\ .
acti nbc
ves uw
^»
.·
Nahrungsund Genußmittelindustrie ! I I i — [ — í — ! — I — j — Industrie alimentari e tabacchi Industries alimentaires et tabac 180
160
140
120
100
90
80
70
■/
'M
''s\
y£Û
i
*·
—
•
Voedinas en genotmiddelenindustrie
''*
^•;
<y
vjv
ff·
• »
\>
I
/j "■
ν
Textilindustrie Industrie tessili
Industries textiles Textielindustrie
220 200 180 160
140
120
100
90
80
Chemische Industrie . Industrie
I
1
L
"
chimiche
!
. L
ip
*
_ 4 —
1
i
...·
■ *·*"
Industries chimiques
...
Cht mische indus
<1
.«·
'
* '
rie
^
—
,*, ...
_^
,
•'"J, /
._
"·
2 3 4 2 3 4
1966
2 3 4 1967
2 3 4
1968
1 2 3 4 1
1969
2 3 4 1 1 2 3 4
1966
2 3 4 11967
2 3 4 | 1 2 3 4 | 1 1968 1 9 6 9
EWG CEE CEE EEG
UK UR ' UR v i
VS EU SU VS
JAPAN JAPON JAPPONNE JAPAN
Gesamte Industrie (ohne Baugewerbe)
Insieme dell'industria (senza edilizia)
Ensemble de l'industrie (à l'exclusion du bâtiment)
Gehele industrie (excl. bouwnijverheid)
1963 - > 100
Land
Pays 1964 1965 1966 1967 1968 1969
1968
II III IV
1969
I II III IV 1970
I
Paese Land
ohne Nahrungs- und Genußmittelindustrie senza alimentari, bevande e tabacchi Deutschland BR Allemagne R.F. Frankreich France Italien Italie Niederlande Pays-Bas Belglen Belgique Luxemburg Luxembourg EWG CEE 109 108 101 111 107 110 107 115 109 105 117 110 110 112 117 117 118 125 111 106 117 113 120 129 131 113 105 119 129 125 138 146 120 112 129 147 142 141 166 132 127 144 131 113 144 147 122 115 128 123 111 128 135 111 110 120 143 148 145 162 128 117 145 137 145 146 163 131 124 142 151 150 155 165 137 130 151 138 122 132 153 120 124 132 160 154 132 184 142 131 154 153 157 153 189 146 132 156
sans aliments, boissons et tabac excl. voedlngs- en genotmiddelenindustrie
Germania R.F. Duitsland BR Francia Frankrijk Italia Italië Paesi Bassi Nederland
Belgio
België
Lussemburgo Luxemburg CEE EEG einschl. Nahrungs- und Genußmittelindustriecompresi alimentari, bevande e tabacchi
y compris aliments, boissons et tabac incl. voedlngs- en genotmiddelenindustrie EWG CEE Österreich Autriche Griechenland Grèce Irland Irlande Norwegen Norvège Portugal a) b)
Portugal a) b)
Vereinigtes Königreich Royaume-Uni Schweden Suède Kanada Canada Vereinigte Staaten Etats-Unis Japan Japon U.d.S.S.R. U.R.S.S. 107 108 111 108 109 112 108 110 110 106 116 107 111 112 121 112 116 119 111 119 119 115 120 116 117 117 141 118 121 127 113 124 128 126 136 126 118 118 150 128 126 134 113 127 130 127 162 139 128 126 162 143 132 120 135 137 133 190 150 142 140 181 152 138 123 145 144 139 222 160 127 130 165 147 130 123 119 145 139 134 185 150 120 123 174 144 120 126 111 114 134 132 192 149 143 136 162 151 142 131 127 151 144 136 206 151 139 129 161 133 143 131 127 147 144 137 206 160 148 143 184 162 136 135 124 157 147 140 216 163 130 136 195 155 127 135 115 123 138 140 224 153 151 152 188 158 148 139 129 164 148 140 242 166 (154) 142 181 141 128 157 148 137 245 174 CEE EEG Austria Oostenrijk Grecia Griekenland Irlanda Ierland Norvegia Noorwegen Portogallo a)bì
Portugal a)b)
Regno Unito Verenigd Koninkrllk Svezia Zweden Canada Canada Stati Uniti Verenigde Staten Giappone Japan U.R.S.S. U.S.S.R.
a) Den Jahresindizes liegen andere Basisreihen zugrunde als den Viertel-jahrsindizes.
b) Ohne Elektrizität, Gas, Wasser.
a) Les indices annuels et trimestriels ont une portée différente. b) Sans électricité, gaz, eau.
Bergbau
Industrie estrattive
Industries extractives
Mijnbouw
1963 -> 100
Land Pays Deutschland (BR) Allemagne RF Frankreich France Italien Italie Niederlande Pays-Bas Belgien Belgique Luxemburg Luxembourg EWG CEE Österreich Autriche Griechenland Grèce Irland Irlande Norwegen Norvège Portugal *) Portugal *) Vereinigtes Königreich Royaume-Unl Schweden Suède Kanada Canada Vereinigte Staaten États-Unis Japan Japon 1964 103 110 100 102 102 95 105 96 103 108 106 96 100 111 113 103 101 1965 101 114 98 108 96 91 104 91 116 105 115 101 96 118 119 106 100 1966 98 113 104 110 86 91 102 89 123 146 120 102 90 119 123 112 105 1967 93 109 111 123 82 86 100 81 126 176 139 112 89 123 131 115 104 1968 97 108 122 163 77 86 104 78 137 219 144 85 137 138 117 105 1969 101 110 126 209 70 89 108 80 158 244 162 80 138 136 121 104 II 100 104 125 143 83 94 104 79 143 282 143 102 88 146 141 119 102 1968 III 98 97 131 132 68 89 99 77 154 277 144 101 76 110 139 119 104 IV 104 116 121 205 76 87 111 80 136 183 150 110 87 152 142 116 108 I 91 114 118 233 72 88 105 77 152 167 153 104 86 152 140 116 106 1969 II 104 120 132 184 75 95 112 81 163 291 162 96 83 150 137 123 103 III 102 97 129 163 62 90 102 79 173 314 162 90 73 122 126 122 101 IV 105 113 127 258 70 82 114 83 146 202 171 94 79 137 140 123 106 1970 I 95 120 310 57 77 84 166 150 83 102 151 123 102 Paese Land Germania R.F. Duitsland BR Francia Frankrijk Italia Italië Paesi Bassi Nederland Belglo België Lussemburgo Luxemburg CEE EEG Austria Oostenrijk Grecia Griekenland Irlanda Ierland Norvegia Noorwegen
Portogallo a)
Portugal *) Regno Unito Verenigd Koninkrijk Svezia Zweden Canada Canada Stati Uniti Verenigde Staten Giappone japan
a) Den Jahresindizes liegen andere Basisreihen zugrunde als den
Viertel-Jahrsindizes. a) Les indices annuels et trimestriels ont une portée différente.
V e r a r b e i t e n d e Industrie
Industrie m a n i f a t t u r i e r e
Industries manufacturières
V e r w e r k e n d e industrie
1963
->100
Land
Pays 1964 1965 1966 1967 1968 1969
1968
II III IV
1969
I II III IV 1970
I Paese
Land
ohne Nahrungs- und Genußmittelindustrie senza alimentari, bevande e tabacchi Deutschland BR Allemagne R.F. Frankreich France Italien Italie Niederlande Pays-Bas
Belgien
Belgique
Luxemburg Luxembourg EWG CEE 109 108 100 112 108 111 107 116 109 104 117 112 111 112 118 117 118 124 116 108 118 115 121 130 127 118 107 120 131 124 139 141 126 115 130 150 143 141 157 139 131 146 134 113 146 145 128 117 130 126 110 127 134 116 112 121 146 147 145 152 136 120 146 139 144 145 148 137 127 142 155 152 157 161 143 134 154 141 123 131 150 128 128 134 163 155 131 169 149 135 155 155 154 166 145 136sans aliments, boissons et tabac excl. voedlngs- en genotmiddelenindustrie
Germania R.F. Duitsland BR Francia Frankrijk Italia Italië Paesi Bassi Nederland
Belgio
België
Lussemburgo L u x e m b u r gCEE EEG
einschl. Nahrungs- und Genußmittelindustrie compresi alimentari, bevande e tabacchi
y compris aliments, boissons et tabac Incl. voedings- en genotmiddelenindustrie EWG CEE Österreich Autriche Griechenland Grèce Irland Irlande Norwegen Norvège Portugal a)
Portugal a)
Vereinigtes Königreich Royaume-Uni Schweden Suède Kanada Canada Vereinigte Staaten Etats-Unis Japan Japon 107 108 111 107 108 112 109 110 110 107 116 111 112 120 113 115 119 112 119 120 116 121 117 117 137 116 121 127 114 124 128 127 137 119 118 141 125 126 134 114 128 129 128 164 127 127 151 138 129 121 135 135 134 194 143 141 168 147 136 126 146 143 139 227 129 131 156 140 129 122 122 145 139 135 188 120 123 163 137 118 125 115 114 133 132 195 144 138 151 149 138 131 128 151 142 137 210 139 129 147 132 139 128 126 146 140 137 209 151 144 171 155 135 133 127 157 147 141 221 131 137 183 147 127 134 119 123 139 139 229 152 155 169 156 147 137 131 165 145 140 248 142 167 138 127 160 141 137 250 CEE EEG Austria Oostenrijk Grecia Griekenland Irlanda Ierland Norvegia Noorwegen Portogallo »)
Portugal a)
Regno Unito Verenigd Koninkrijk Svezia Zweden Canada Canada Stati Uniti Verenigde Staten Giappone Japan
a) Den Jahresindizes liegen andere Basisreihen zugrunde als den V i e r t e l -jahrsindizes.
a) Les indices annuels et trimestriels ont une portée différente.
Nahrungs- und Genußmittelindustrie Industries des denrées alimentaires, des boissons et du tabac
Industrie alimentari, delle bevande e del tabacco Voedings- en genotmiddelenindustrie
1963 -> 100
Land Pays Deutschland BR Allemagne R.F. Frankreich France Italien Italie Niederlande Pays-Bas Belgien Belgique Luxemburg Luxembourg EWG CEE Österreich Autriche Griechenland Grèce Irland Irlande Norwegen Norvège Portugal a)
Portugal a)
Vereinigtes Königreich Royaume-Uni Schweden Suède Kanada Canada Vereinigte Staaten Etats-Unis Japan Japon 1964 105 104 102 105 106 105 104 102 109 104 100 109 103 105 105 104 109 1965 110 106 105 109 107 112 107 104 112 107 105 115 105 107 110 106 116 1966 113 105 108 111 112 117 109 116 127 111 114 120 109 113 115 110 126 1967 116 106 113 119 119 116 113 118 123 119 111 128 111 116 119 113 133 1968 122 109 118 124 121 120 118 120 128 124 114 115 120 123 116 142 1969 127 109 123 128 127 120 121 127 126 129 118 119 121 126 119 149 II 124 103 128 118 124 138 119 116 153 126 117 104 112 126 124 113 132 1968 III 118 100 107 119 119 128 111 111 175 132 110 125 115 111 136 123 130 IV 134 121 127 150 133 105 130 150 97 134 120 117 122 137 125 119 147 I 117 112 121 114 111 110 116 106 91 101 112 98 111 112 111 112 163 1969 II 128 114 130 122 129 135 125 119 138 137 120 105 118 126 128 116 140 III 124 94 114 122 127 132 114 115 179 140 115 126 119 116 139 128 138 IV 138 116 129 153 140 105 132 168 98 137 126 119 128 137 128 121 156 1970 I 122 131 123 121 117 113 94 105 112 121 113 115 174 Paese Land Germania R.F. Duitsland BR Francia Frankrijk Italia Italië Paesi Bassi Nederland Belgio België Lussemburgo Luxemburg
CEE
EEG
Austria Oostenrijk Grecia Griekenland Irlanda Ierland Norvegia Noorwegen Portogallo a)Portugal a)
Regno U n i t o
Verenigd Koninkri Svezia Zweden
Canada
Canada Stati Uniti Verenigde Staten Giappone Japan ka) Den Jahresindizes Hegen andere Basisreihen zugrunde als den
Viertel-jahrsindizes. a) Les indices annuels et trimestriels o n t une portée différente.
Textilindustrie
Industria tessile
Industries textiles
Textielindustrie
1963 > 1 0 0
Land Pays
Deutschland BR Allemagne R.F.
Frankreich France Italien Italie Niederlande PaysBas Belgien Belgique Luxemburg Luxembourg
E W G CEE
Österreich d) A u t r i c h e d)
Griechenland Grèce
Irland c)
Irlande c)
N o r w e g e n Norvège
Portugal a) c) Portugal a) c)
Vereinigtes Königreich RoyaumeUni
Schweden Suède
Kanada c) Canada c)
Vereinigte Staaten EtatsUnis
Japan b)
Japon b)
1964 103 101 93 105 101 70 101 105 110 109 102 109 106 103 109 105 111 1965 107 90 83 101 98 55 97 107 119 111 102 120 108 101 115 115 119 1966 107 100 95 106 103 47 103 113 130 113 104 129 108 94 120 122 131 1967 100 92 93 96 96 39 96 111 134 122 102 132 105 99 118 121 142 1968 116 94 92 108 103 26 104 119 139 135 93 119 97 125 129 151 1969 128 104 98 113 112
—
114 131 155 144 98 123 107 130 132 165 II 122 90 98 111 107 24 107 124 131 136 91 117 118 103 124 130 148 1968 III 104 77 81 94 88 21 90 107 135 126 78 104 112 78 123 126 151 IV 127 109 94 122 115 29 115 128 157 148 98 106 128 109 131 131 155 I 129 110 98 113 111 116 132 148 135 106 110 125 110 131 132 159 1969 II 138 115 105 121 120 123 137 147 149 92 119 127 123 134 135 163 III 110 79 86 98 95 95 118 148 135 83 107 113 81 125 128 167 IV 135 111 104 117 122 121 139 173 155 112 105 129 121 128 130 172 1970 I 131 101 122 115 134 167 108 123 118 126 131 177 Paese LandGermania R.F. Duitsland BR
Francia Frankrijk
Italia Italie
Paesi Bassi Nederland Belglo België Lussemburgo Luxemburg CEE EEG
Austria d)
O o s t e n r i j k d)
Grecia Griekenland
Irlanda c)
Ierland c)
Norvegia N o o r w e g e n
Portogallo ■) c)
Portugal a) c)
Regno U n i t o Verenigd Konink
Svezia Zweden
Canada c)
Canada c)
Stati U n i t i
Verenigde Staten
Giappone b)
Japan b)
ijk
a) Den Jahresindizes liegen andere Basisreihen zugrunde als den V i e r t e l jahrsindizes.
b) A b 1968 sind die Vierteljahresangaben saisonbereinigte Indizes. c) Einschl. Bekleidung und Schuhe.
d) Einschl. Bekleidung.
a) Les indices annuels et t r i m e s t r i e l s o n t une portée différente.
b) A p a r t i r de 1968, les indicateurs trimestriels sont des indices désaison nalisés.
c) Y compris habillement et chaussures. d) Y compris habillement.
Papierindustrie
Industria della carta
Industrie du papier
Papierindustrie
1963 ->100
Land Pays
Deutschland BR Allemagne R.F. Frankreich
France Italien
Italie Niederlande
Pays-Bas Belgien
Belgique Luxemburg
Luxembourg
EWG CEE
Österreich Autriche Griechenland
Grèce Irland
Irlande Norwegen Norvège Portugal a)
Portugal a)
Vereinigtes Königreichb)
Royaume-Uni b)
Schweden Suède Kanada
Canada Vereinigte Staaten
Etats-Unis Japan c)
Japon c)
1964
107
105
107
112
111
107
109
102
111
116
109
113
107
113
1965
113
107
116
120
116
112
116
119
118
124
111
121
114
116
1966
117
116
135
129
123
120
119
144
121
115
132
122
130
1967
117
119
151
133
128
124
123
154
125
114
133
123
145
1968
132
121
158
145
145
133
136
163
135
118
131
159 1969
145
134
178
160
161
148
150
189
146
123
140
179 II
133
115
163
149
149
134
136
163
128
120
132
158 1968
III
129
101
142
138
130
123
136
162
127
110
129
160 IV
142
138
170
150
160
146
140
170
146
124
136
164 l
139
138
175
160
158
146
144
175
153
125
140
168
1969
II
147
143
182
165
164
153
151
188
137
125
142
176 III
140
108
163
149
147
134
149
187
141
114
138
183 IV
154
145
190
167
177
158
155
200
155
129
141
190 1970
I
148
191
167
172
156
208
146
125
141
198 Paese
Land
Germania R.F. Duitsland BR Francia
Frankrijk Italia
Italië Paesi Bassi
Nederland Belgio
België Lussemburgo
Luxemburg
CEE EEG
Austria Oostenrijk Grecia
Griekenland Irlanda
Ierland Norvegia
Noorwegen Portogallo a)
Portugal a)
Regno Unito b)
Ver. Koninkrijk b)
Svezia Zweden Canada
Canada Stati U n i t i
Verenigde Staten Giappone c)
Japan c)
a) Den Jahresindizes liegen andere Basisreihen zugrunde als den V i e r t e l -jahrsindizes.
b) Einschl. Druckerei und Verlagswesen.
c) Ab 1968 sind die Vierteljahresangaben saisonbereinigte Indizes.
a) Les indices annuels et trimestriels ont une portée différente. b) Y compris imprimerie et édition.
c) A partir de 1968, les indicateurs trimestriels sont des indices désaison-nalisés.
Lederindustrie
Industria del cuoio
Industrie du cuir
Lederindustrie
1963
->
100
Land Pays
Deutschland (BR) Allemagne RF
Frankreich France
Italien Italie
Niederlande Pays-Bas
Belgien Belgique
Luxemburg Luxembourg
EWG CEE
Österreich Autriche
Griechenland Grèce
Irland Irlande
Norwegen Norvège
Portugal Portugal
Vereinigtes Königreich Royaume-Uni
Schweden b)
Suède b)
Kanada b)
Canada b)
Vereinigte Staaten b)
États-Unis b)
Japan c)
Japon c)
1964
104
96
93
107
101
a
)
100
99
96
106
130
103
108
103
105
1965
104
89
90
103
97
a
)
96
91
95
101
133
104
107
108
107
1966
98
95
103
102
105
a
)
98
90
106
132
102
109
112
111
1967
88
86
104
94
103
a
)
89
80
103
112
90
104
107
113
1968
101
91
113
102
114
a
)
98
91
98
109
93
112
138
1969
106
97
124
101
124
a
)
104
99
101
111
94
102
150
II
101
92
118
103
115
a
)
99
97
93
105
94
113
137
1968
III
94
74
104
97
102
a
)
87
89
88
98
86
108
138
IV
119
108
124
107
132
a
)
115
91
107
120
98
109
145
I
103
102
127
105
121
a
)
105
100
106
117
102
108
142
1969
II
106
109
135
107
137
a
)
110
109
100
115
95
102
147 III
98
67
106
94
111
a
)
86
95
88
91
85
98
153
IV
116
110
128
99
126
a
)
114
91
110
116
93
99
159
1970
I
99
126
108
108
a
)
100
107
113
94
100
156
Paese Land
Germania RF Duitsland BR
Francia Frankrijk
Italia Italië
Paesi Bassi Nederland
Belgio België
Lussemburgo Luxemburg
CEE EEG
Austria Oostenrijk
Grecia Griekenland
Irlanda Ierland
Norvegia Noorwegen
Portogallo Portugal
Regno Unito Ver. Konlnkrl|k
Svezia b)
Zweden b)
Canada b)
Canada b)
Stati Uniti b)
Verenigde Staten b)
Giappone c)
Japan c)
a) Produktion unterbrochen. b) Einschl. Schuhherstellung.
c) Ab 1968 sind die Vierteljahresangaben saisonbereinigte Indizes.
a) Production interrompue.
b) Y compris la fabrication de chaussures.
c) A partir de 1968, les indicateurs trimestriels sont des indices désaison-nalisés.
Chemische Industrie
Industria chimica
Industrie chimique
Chemische industrie
1963 -+- 100
Land Pays
Deutschland (BR) Allemagne RF
Frankreich France
Italien Italie
Niederlande a)
Pays-Bas a)
Belgien Belgique
Luxemburg c)
Luxembourg c)
EWG CEE
Österreich Autriche
Griechenland Grèce
Irland d)
Irlande d)
Norwegen Norvège
Portugal b) d)
Portugal b) d)
Vereinigtes Königreich Royaume-Uni
Schweden d)
Suède d)
Kanada d)
Canada d)
Vereinigte Staaten États-Unis
Japan c)
Japon c)
1964
111
111
121
108
109
115
106
107
107
110
115
109
107
113 1965
121
120
141
113
119
124
127
122
115
117
128
118
117
124 1966
132
134
161
114
128
148
144
135
118
123
142
128
130
140 1967
143
146
176
125
134
214
164
138
124
130
160
130
137
164 1968
162
160
199
137
149
243
202
141
140
179
138
149
190 1969
184
192
192
150
167
278
207
147
149
204
142
161
223
1968
II
166
140
205
139
156
237
185
146
104
142
184
140
149
189 III
160
150
186
138
142
241
208
135
134
135
157
133
149
195 IV
172
182
205
143
154
263
226
143
119
141
199
140
155
198 I
175
191
199
152
160
263
216
141
110
149
200
145
157
208 1969
II
188
197
214
155
175
277
212
146
109
152
214
142
163
219 III
180
175
187
134
160
271
186
148
128
145
184
139
161
228 IV
191
202
170
156
175
300·
214
153
113
151
224
143
162
237 1970
I
195
211
168
180
291
•
147
153
232
148
163
241 Paese
Land
Germania RF Duitsland BR
Francia Frankrijk
Italia Italië
Paesi Bassi a)
Nederland a)
Belgio België
Lussemburgo c)
Luxemburg c)
CEE EEG
Austria Oostenrijk
Grecia Griekenland
Irlanda d)
Ierland d)
Norvegia Noorwegen
Portogallo b) d)
Portugal b) d)
Regno Unito
Verenigd Koninkrijk
Svezia d)
Zweden d)
Canada d)
Canada d)
Stati Uniti
Verenigde Staten
Giappone c)
Japan c) a) Veröffentlichung unterbrochen für die chemische Industrie im engeren
Sinne.
b) Den Jahresindizes liegen andere Basisreihen zugrunde als den V i e r t e l -jahrsindizes.
c) A b 1968 sind die Vierteljahresangaben saisonbereinigte Indizes. d) Einschl. Erdöl- und Steinkohlenderivate.
e) In Überarbeitung befindliche Reihe.
a) Publication interrompue pour la chimie p r o p r e m e n t d i t e . b) Les indices annuels et trimestriels o n t une portée différente. c) A partir de 1968, les indicateurs trimestriels sont des indices
désaison-nalisés.
d) Y compris les dérivés du pétrole et du charbon. e) Série en cours de révision.
Metallverarbeitende Industrie
Industrie meccaniche
Industrie transformatrice des métaux
Metaalverwerkende industrie
1963
+■
100
Land Pays
Deutschland (BR) Allemagne RF
Frankreich France Italien Italie Niederlande PaysBas Belgien Belgique Luxemburg Luxembourg
E W G CEE Österreich Autriche Griechenland Grèce Irland Irlande Norwegen Norvège
Portugal a) Portugal a)
Vereinigtes Königreich RoyaumeUni
Schweden Suède
Kanada Canada Vereinigte Staaten
ÉtatsUnis Japan Japon 1964 108 107
93
110 10496
105 108 109 112 108 108 109 109 113 107 122 1965 115 10895
115 11094
110 112 120 118 115 109 113 121 130 121 124 1966 115 115 113 120 11393
115 114 125 119 122 123 116 130 145 137 144 1967 107 117 126 123 11487
114 117 125 124 127 130 115 131 145 136 187 1968 120 122 131 131 11681
123 125 130 143 128 122 138 152 141 239 1969 143 140 132 147 13694
140 147 143 153 134 127 152 165 146 293 1968II
124 105 141 134 11583
121 129 135 147 126 113 121 150 159 142 232 III 112 106 115 125 10776
111 119 132 131 110 102 114 114 143 136 246IV
140 150 140 143 12784
142 139 133 156 136 135 130 159 165 146 267 1969I
131 137 143 132 12991
134 129 131 144 141 122 128 151 163 146 262II
150 149 155 151 13996
150 150 148 163 130 132 128 165 170 148 285 III 130 116 119 142 12389
125 142 146 144 119 122 119 124 156 144 300IV
161 155 112 162 153 100 152 165 146 163 147 143 133 181 172 146 326 1970 I 151 148 154 151 14299
150 154 154 142 132 167 161 142 330 Paese LandGermania RF Duitsland BR
Francia Frankrijk
Italia Italië
Paesi Bassi Nederland Belgio België Lussemburgo Luxemburg CEE EEG Austria Oostenrijk Grecia Griekenland Irlanda Ierland Norvegia Noorwegen Portogallo ■) Portugal *)
Regno Unito
Verenigd Koninkrijk
Svezia Zweden
Canada Canada
Stati Uniti
Verenigde Staten
Giappone Japan
a) Den Jahresindizes liegen andere Basisreihen zugrunde als den Viertel jahrsindizes.
a) Les indices annuels et trimestriels ont une portée différente.