COMMISSION
OF
THE
EUROPEAN
COMMUNITIES
Brussels,
27
September
1976
FARM
ACCOUNTANCY
DATA NETWORK
FOR THE
EEC
•!i!l!llllllll ' '
COMMISSI(>N
OP
THE
EUnOP£AN
COMMUNITIES
Brussele,
27
September
1976
FARM
ACCOUNTANCY
DATA NETWORK
FOR THE
EEC
FORmWORD
1
-THE E.E.C. FA.Ri\1 ACCOUlTTANCY DATA
l~TWORKRE!SULTS
FOR
"1974"
···~···
3
PART
I : FEA'IURES OF THE FADN
Il~
"1974" •••••••••••••••
5
I. FIELD OF SURVEY OF THE FARM ACCOUN1'AJIJ'CY
DATA NETWORK •••••••••••••••••••••••••••••••••
5
II.
"197 4"
ACCOU1fTII~G
SAMPLE • • • • • • • • • •••••••••• • •
8
III.
PRESEtiTA
1riON OF THE FIELD OF SURVEY BY
ACCOUNTANCY
S.AblPLE •• • • •• • • • • • • • • • • • •. • • • • •...
'i
2
PART II : PRII'iCIPAL ACCOUNTANCY
RESULTS
"197 4" • • • •• •.. 15
IV. PRESENTA'I'ION OF ACCOti'NTANCY RESUL'I'S •• •. •. • • • • •
16
V.
VALIDI'I'Y
OF THE
"1974"
ACCOl.Hf'l'A.UCY RESULTS ••••
19
VI. PRINCIPAL RESULTS
FOR
"1974" ••••••••••••••••• 21
VII. TREND IU INCOME
ON REWRI\fiNG HOLDINGS
BE'~~T
"197 3"
A.."''D
"197 4" • • • • • • • • • • • • • • • • • • • •
32
FD\fAL
COUSimRATIONS
••••••••••••••••••••••••••••••••••
46
-
3-FOREWORD
The accounting year
"1974" relates to the second year of the Farm
Accountancy Data Network (FADN) working within the framework of
the enlarged Community.
For the first time the results of
FADN
not
only enable one to examine the economic si tua.t ion of a.gricul tural
holdings in
1974 but also to measure the annual development of
each main type of holding in the different regions of the Community.
The
"1
97 4" results are based on a sample of 13 5
00
returning holdings
representing around two million farms.
The treatqtent and structure of the accounting sample
"1974" are
almost the same
as for
"197
3". The remarks made on the subject of
representativity of the accounting sample remain therefore broadlY
applicable.
The field of survey of FADN (all rep:resented holdings) has not been
the subject of a statistical up-dating in
"1974"• Consequently the
data referring to this aspect in the report giving the
"1973" results
represent the only material to which reference can at present be
made.
The
''1974" results are presented in a framework and according to
definitions identical to those used for the
"1973" results.
Community authorities with a direct interest in the FADN results have
several times expressed the wish to see them made available more
quickly.
The
"197 4" results are appearing six months ahead of the
publication date of the results for
"1973" which had also appeared
six months ahead of the preceding publication.
The date of presentation
of this report to the Council demonstrates the considerable progress
made as a result of the efforts made by the Member State services and
those of the Commission in speeding up the presentation of FADN.
The data which have been gathered every year for over
6
years and the
improvements in the
everyd~administration of the network have thus
-
5-PART I
F.EAIDRES OF THE FADN IN "1 97
4"
Before presenting the "1974" results and drawing conclusions from
a.
general analysis of the data collected from the various types of farms
in the different regions of the Community, some of the main features of
the
FADN
field of survey and the accountancy sample for "197
4"
will be
described ( 1 ).
I. FIELD OF SURVEY OF THE FARM ACCOUNTANCY DATA NETWORK
1. Under the basic Council Regulation setting up a network for the
collection of farm accountancy data on incomes and business
operation of agricultural holdings in the EUropean Community (2),
the field of survey covers those agricultural holdings which
- are run
as
market-oriented holdings, and
- constitute the main occupation of the operator.
The implementation of the Commission Regulation concerning the
selection of returning holdings for the purpose of determining
incomes of agricultural holdings (3) specifies also that
:
- "a
holding is to be regarded
as
market-oriented if normally
at least half its output is marketed;
- an
agrioul tural. holding is to be regarded
as
providing the
main occupation of the operator if the latter devotes at least
three-quarters of his annual working time to the holding."
(1)The
FADN
years are given in inverted commas because
they
do not
alw~s
correspond to calendar years, but sometimes to a period of 12 months
beginning in the first ha.lf of the calendar year.
Thus
"1974" can
mean the aocou.nt ing year from 1
January
197
4
to 31 December 197
4,
1
M~1974 to 30 April 1975 or 1 July 1974 to 30 June 1975.
(2)Cou.ncil Regulation 79/65/EF£ of 15 June 1965,
OJ
No. 109 of 23 June 1965.
(3)Commission Regulation No. 91/66/EEC of 29 June 1966, OJ No. 121 of
-
6-In "1974"
1as for previous years, the FADN field of survey h,as been
confined to holdings of five or more hectares; this limitation
did not apply to holdings producing wine, fruit, horticultural
produce or olive products (1).
2. From the statistical data available, it is not
alw~spossible to
determine the exact number of holdings covered by the FADN field
of survey; once again, the number therefore has been estimated (2 ).
On the basis of the latest statistics available, most of which are
taken from the 1970 agricultural census, the FADN field of survey
covered about 3 130 000 holdings at the beginning of this decade.
Given the changes in agricultural structures observed since 1970
in Member States holding a.n annual census, it can be estimated that
the nUmber of holdings covered
slight~less than 3 million in
"1974"• When in this report reference is made to the field of survey,
the 3 130 000 holdings for which alone the breakdown by region and type
are available (type of farming and size), will be taken into account.
3.
About nine-tenths of the holdings covered by the FADN field of
survey are in the original six Member States. France and Italy
alone account for about two-thirds of the total.
Holdings concentrating exclusively or mainlY on grazing stock
-especially cattle - make up almost half of the field of survey.
One farm in seven specializes mainly or exclusively in arable
farming; one in ten in permanent grazing crops, and one in twenty
in horticulture.
Almost three-quarters of the holdings covered by the field of
survey are between five and fifty hectares (UAA).
They are
divided evenly between the three size categories 5-10
110-20 and
20-50 hectares.
Of the others - i.e., a little more than a
quarter of the total - 18% fall into the very small category (less
than 5 hectares) and
'ffr;
into the large category (50 hectares and
over).
(1)The restricted field of survey is applied for the second time in "1974",
the last accounting }[_ear before the entry into effect of Council
Regulation No. 2910/73, under which the number of returning holdings
will gradually be increased from ''1975" to "1978".
-
7-BREAKDOWN OF REIJ.UR.l'J"ING HOLDINGS COVERED BY THE FADN FIELD
OF SURVEY FOR TEE
197
Os
Number of
,-?holdings
7.?
Member States
Deutschland
581 618
18.6
France
1 022 485
32.6
It alia
922 497
29.5
Belgiqu.e/Belgie
84 778
2.7
Luxembourg
4 732
0.2
Nederland
122 938
3.9
Da.nmark
118 266
3.8
Ireland
112 900
3.6
United Kingdom
160 973
5.1
E.E.c.
3 131 187
100.0
bY;ne of farming
111
General agriculture
183 844
5.9
130
Arable - grazing stock
267 821
8.5
310
Grazing stock - arable
443 799
14.2
336
Cattle
803 969
25.7
340
Grazing stock - pigs and poultr.y
240 970
7.7
430
Pigs and poultr,y - grazing stock
121 742
3.9
112
Horticulture
162 700
5.2
223
Fruit
130 296
4.1
224
Vines
181 003
5.8
Other
595 043
19.0
Size
oat!«P&Y
<
5
ha UAA
566 306
18.1
5 - 10
ha. UAA
667 699
21.3
10 - 20
ha. UAA
835 794
26.7
20- 50
ha UAA
784 992
25.1
-
8-II.
"1974" ACCOUNTING SAMPLE
4•
Of the
15 209
holdings selected for
"1974", 13 458
provided a
farm return at the end of the year complying with the legislative
provisions {1).
The rate of wastage of the accountancy sample
between the time of selection of the holdings and the receipt of
the farm returns was of the order of
11.5%
for
"1974"•
The
13 458
farm returns thus provide the basis for the data
available to the
FADN
for
"1973".
The breakdown by country, type of farming and size of returning
holdings submitting a. properly completed
farm
return for
"1974"
has remained similar to that of
"1973".
ACCOUNTANCY SAMPLE
111974"
Number of
fa
holdings
Member States
Deutschland
2 104
15.6
France
3 175
23.6
It alia
2 935
21.8
Belgique/Belgie
556
.4.1
Luxembourg
50
0.4
Nederland
992
7.4
Danma.rk
1 578
11.7
Ireland
567
4.2
United Kingdom
1 501
11.2
E.E.C.
13 458
100.0
'Iiroe of farming
111
General agriculture
1 064
7.9
130
Arable- grazing stock
678
5.0
310
Grazing stock - arable
1 537
11.4
336
Cattle
4 421
32.9
340
Grazing stock - pigs and poultry
1 124
8.4
430
Pigs and poultry - grazing stock
641
4.8
112
Horticulture
567
4.2
223
Fruit
558
4.1
224
Vines
743
5·5
Other
2 125
15.8
Size category
<
5
ha
UAA
1 274
9·5
5 - 10
ha.
UAA
1 758
13.1
10- 20
ha
UAA
3 280
24.4
20 - 50
ha.
UAA
4 543
33.8
~
50
ha
UAA
2 603
19.3
(1)Commission Regulation
No
118/66/EEC
of
29
July
1966,
OJ
No
148
of
-9-FADN
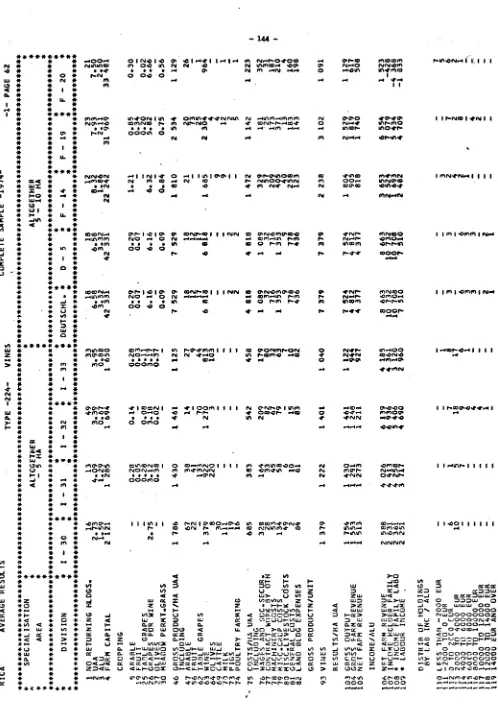
BREAKDOWN BY DIVISION OF RETURNING HOLDINGS
10
-5.
Given that the sample does not cover the entire field of survey,
the overall FADN results have had once again to be presented by
groups of ten or more returning holdings.
The sub-group thus
obtained from the sample therefore includes
11 824
individual holdings,
of which
9 195
appeared in the
"197 3
11FADN (constant sample).
6.
The
11 824
returning holdings falling within groups of
10
or more
holdings are classified in
365
groups each corresponding to a
specific type of farming and a particular size categor,y. Each
group includes on average
32
returning holdings, the extremes
ranging from
10
to
200
or more.
The number varies considerably
from one countr,y to another.
The average number of groups of
returning holdings for
"1974"
has hardly changed in relation to
the previous year
(31
in
"1973").
DISTRIBUTION OF GROUPS OF RETURNING HOLDINGS IN "1974"
BY NUMBER AND COUNTRY
Number
Number of groups
of
holdings
D
F
I
B
L
NL
DK
Irl.
UK
EEC
10- 19
18
38
64
2
1
2
5
1
10 141
20 - 29
18
38
27
4
-
3
5
-
6 101
30 - 39
7
16
7
4
1
1
5
-
4
45
40- 49
7
4
4
1
-
1
6
1
2
26
50- 74
7
6
2
2
-
2
5
-
3
27
75- 99
-
1
-
-
-
-
5
1
3
10
100- 149
1
1
-
1
-
1
1
-
4
9
>
150
1
-
-
-
-
3
-
2
-
6
Average
number per
33
27
20
37
22
74
48
108
45
32
11
-DIAGRAM SHOWING THE STRUCTURE ·aF THE FADN ACCOUNTING SAMPLE
"1974"
•+---·-
Returning holdings selected
(15 209) -·---....,.•
efaulting
holdings
KEY
~roups
~10
hold.
1
national.
level
Regional
groups~10
holdings
New holdings
Constant sample
(9 195).
~-·-~~ .... ~;;:-::::-.;;;;;;.;.;:--:,;;;;;.;..;... ::-
--·~
...
____...
·--..--·-~···
...
,.,... .
, ... t• ... ·-. •• • ... ..
...
. ...----·'"-·-···-~--·-···
... .
·--~··
···••*···-··· ... .
... ... ,...
.
... .
•••••• I • t l l l l l a l l t . l l l l l l L.llt8Wt•llllllllt ••11 ••
•••••• ••••••••••••••u•••~•••••••••••••• •••• ••
f----
Complete sample :regional basis
(11
824)~~
·Complete sample : national basis (12
942)
~(:---····Total sample
(13 458) ·
7
I
'IIIIIIIIISel:cted returning holdings which ceased to keep accounts
.~•~~~~.dur~ng
the year or for which the farm return was not properly
completed.
J
1ZZZZt;lZAHoldings falling within categories represented both at regional
'trrrr rrv
(division) and national levels by less than
10
returning holdings.
Hoidings falling within categories represented at regional level
~~~~~~(divisions)
by groups of less than 10 returning holdings and at
~~~~MM~national
level by groups of more than 10 returning holdings •.
r====~~
Holdings falling within groups of less than
10
returning holdings
.,_ ___ -tappearing in the
"1974"
sample for the first time.
I
Holdings falling within groups of less·· than
10
returning holdings
1111111111
vThi
Ch already appeared
in
the
1119
7 3
11sample •
(
) Number of returning holdings in a category.
Category of holding : All holdings engaged in the same type of farming
and falling within the same UAA size category.
Group of holdings : All the holdings falling within the same category
in a given division (regional group) or in a given country
(national group) where no other details are given, the term
"group of holdings" refers only to the regional group.
A
The total constant sample also includes holdings belonging to regional
groups
<10. It
is made up of
10
394
holdings, of which 10.37_9correspond
-
12-III. PRESENTATION OF THE FIELD OF SURVEY BY ACCOUNTANCY SAMPLE
7.
On
the basis of the 11
824
holdings falling within groups of
10 or more returning holdings, it
was
possible to represent only
about 1
860 000
out of the total of
3 000 000
holdings covered
by the field of survey.
The average rate of coverage of the
field of survey by sample is therefore about
5~fo;
it differs
widely from country to country, type of farminga.nd the size of
holding (UAA), as can be seen below.
PERCENTAGE OF THE FIELD OF SURVEY
REPRESENTED BY THE ACCOUN'll.ANCY SAMPLE
(groups of 10 or more holdings)
"19'{4"
Member States
Deutschland
France
It alia
Belgique/Belgie
Luxembourg
Nederland
Danrnark
Ireland
United Kingdom
E.E.c.
'IYpe of farming
111
General agriculture
130
Arable - grazing stock
310
Grazing stock - arable
336
Cattle
340
Grazing stock- pigs
&
poultry
430 Pigs
&
poultr,y - grazing stock
112
Horticulture
223
Fruit
224
Vines
Other
Size
cate~S;O!Z<
5
ha
UAA
5 - 10
ha
UAA
10 -
20 ha UAA.
20 -
50
ha UAA
"?
50
ha UAA
Number
of holdin
301.527
696.909
398.191
65.094
1.816
99.6o7
106.454
83.400
107.678
1.860.676
94.912
82.413
312.706
725.844
159·945
83.813
79.352
73.750
121.968
125.933
217.207
269.345
583.700
611.159
179.265
%
(*)
52
68
43
77
38
81
90
74
67
59
52
31
70
90
66
69
49
57
67
21
38
40
70
78
65
-
13-8.
For France the representation of the field of survey is better in
"1974"
compared to
"1973" (66.6%
to
68.2%),
but the position has
worsened in Belgium, Ireland, and the United Kingdom
(80.1~
to
76.8%, 77
.9'/~
to
73.9';~
and
72.3%
to
66.9;~
respectively). (1)
The "Cattle" type of farming is represented by
90~f
of the number
of holdings corresponding to the field of survey while the
corresponding figure for the "arable-grazing" type of farming is
barely
31'%.
Uearly
80'fo
of farms in the 20-50 ha category are
represented while the corresponding figures for classes of less
than 10 ha are only half this percentage
(40'}b).
9.
The representation of the field of survey
also
differs widely
(cf. following table) from one divison to another.
The extremes
for the rate of coverage range from
4%
(Saarland) to
9CY;~
(Denmark).
In
14
(i.e. one third) of the
41
divisions studied (cf. map in
Annex I C) less than
5o%
of the field of survey is represented.
But in 11 of these 41 divisions the accounting sample covers more
than
7o%
of the holdings in the field of survey.
10. Thus the farm accountancy data network in its present state covers
the field of survey only very imperfectly. As a result, for the
majority of cases, the grossing up of results of the accounting
sample for the entire field of survey is not possible. For the
present it is necessar,y. to take account of this handicap in
analysing results and in the future it will be necessar,y to fill
this gap with the aid of the substantial increase in the number of
returning holdings expected over the years
"1975"
to
"1978".
-
14-BREAKDOWN OF THE DIVISIONS OF FADN
ON THE BASIS OF THE RATE OF COVERAGE
OF THE FIELD OF SURVEY OF THE ACCOUNTING SAMPLE
Low representation
Medium representation
IHigh representation
~50%
50 - 70 %
>
70%
08
Saarland
4% 01
(Schleswig-
)50%
18
~Limousin,
)
71
%
05
Rheinland-Pfalz
19
%
(Holstein
)
Auvergne
)
28
Umbria, Marche
20% 26
~Emilia.-
Romagna
)
)50%
13
(Haute-Normandie)
(Basse-Normandi~)
72
%
27
Toscana
22% 23
Lomba.rdia
51
%
39
Northern Ireland
72 %
31
~Puglia,
Basilioata
~
29
%
17
~Lorraine,
)
) 52
%
38
Ireland
74
%
Alsace
40
Scotland
75
%
33
Sardegna
34% 19
Rh8ne-Alpes
54% 34
Belgique/Belgig
77
%
35
Luxembourg
38%
(Nordrhein-
)
32
Sicilia
39%
03
(Westfalen
) 55
%
42
Wales
1a
r~
06
(Baden-
(Wiirttemberg
) 42
)
%
22
(Piemonte,
(Valle d'Aosta )
)
56
%
016
~Franche-Comte,)
Champagne,
)
80%
Bourgogne
)
04
Hessen
46%
20
~A
quit aine,
~
59
%
36
Nederland
81
%
(Campania,
)
Midi-Pyrenees
30
~Calabria,
~
46%
~England
~60%
rretagne, pays)
Molise
44
East Region
14
de la Loire, )
Poitou-Cha.ren-)
83
%
(Lazio,
~
47
%
(Languedoc,
)
te
)
29
(Abruzzi
21
~Provence-C6te
)
61% 37
·nanmark
90%
d
1Azur-Corse
)
12
Nord, Picardie
49%
~Veneto,
)
25
Liguria
49% 24
Trentino-Alto )
61%
Adige, Friuli-)
(Venezia Giulia)
02
Niedersachsen
62%
43
:(England
(West Region
~
63
%
07
Bayern
64%
15
~Centre,
parisienne
R8gion)
)
66
%
1 (England
-
1.5-PART II
PRINCIPAL ACCOUNTANCY RESULTS
"1974"
11. The FADN results are presented in two distinct parts, namely
- in absolute terms (EUR) for the entire
"1974"
sample
- in the form of indices for the
"1973/74"
constant sample.
The average results of all ad hoc groups made up for specific
analytical purposes are presented either in the form of
- tables (Annexes VI and VII)
- or graphs (Annex VII).
12. The results thus presented are those of the actual accounting sample.
They can therefore diverge from the results published for the same
groups in the Member States, because the accounting samples are not
al~s
the same. FUrther, in certain Member States a weighting
coefficient is applied to the results of the accounting sample, with
a view to grossing them up for the entire field of survey
represented, and different methods of calculation are used (1).
(1) For example: the labour income per ALU in horticultural holdings
in the Netherlands (Division
36)
in the present publication shows
a.n
increase to
7 535
EUR (Fl. 25 280 ). -
According to the
Netherlands' calculations, the labour income for these same
holdings is Fl 18
563.
The difference between these two
results is basically due to three causes :
- difference in fixed rate of interest applied
to capital
F12
814
- difference in the method of calculation of ALU F12 619
16
-IV. PRESENTATION OF ACCOUNTANCY RESULTS
13. The presentation of the
"1974"
results is made in the same
manner as the
"1973"
results.
A. Averese results by group of returning holdings
14.
The average results by group of returning holdings are presented
in the form of computerized tables in which each column is
reserved for the average results from a well defined group of
holdings and in which each of the 46 lines is attributed to one
of the
119
criteria used for classif,ying the groups of returning
holdings (see Annex III).
15.
The choice of
46
criteria is provided to characterize a given
group of holdings depending upon the type of farming of the
holdings of the group in quest ion.
Thus the type "Vinegrowing"
is characterized by data on the growing of table grapes and wine
production while for the type "Cattle" the details are not given
but are replaced by data on the production of beef or milk etc.
16.
Certain basic characteristics relating to the structure of the
holding, the production and income are however given systematically
for all groups.
The information includes, for example, UAA
(Utilizable Agricultural Area), ALU (Annual Labour Units ) , Labour
Income per ALU, etc. (see Annex III Band C).
17.
The columns of the tables giving results representing each
group of holdings are arranged according to type of farming
-and for a given type of farming- by area; in addition they
follow (from left to right) in increasing numerical order by
division.
For the four Community countries which have more than one
division, namely
Germ~,
France, Italy and the United Kingdom {1),
the tables show also columns with the averages for the groups
constituted at national level.
(1) For the other countries, namely Belgium, Luxembourg, Netherlands,
Denmark and Ireland, the inclusion of a column for national
-
17-These columns precede those giving the results of corresponding
regional groups. The advantage of inserting headings only by
the name of the country in full and not by a number is that the
characteristics of all holdings of a given type of farming and
UAA category {category of holdings) can be seen at a glance at
Member State level. Because the new columns enable the national
and regional data to be compared easily, the columns showing the
average of the groups represented at the national level make it
possible to measure the disparities between the regional averages
and the corresponding average for the entire accountancy sample
of
eac~Member State which comprises more than one division.
18. The columns giving the average results of the national sample of
the four largest Community countries however do not all ai:pea.r in
the present document.
In fact they are omitted wherever there
is a repetition of results
alre~appearing in a column for
regional averages {e.g. where a single regional sample covers a
given category of holdings for the whole of the countr.y concerned).
Neither were the national averages given where, after consultation
with the appropriate national agencies, doubts about the
statistical validity arose.
19.
Several categories of holdings elsewhere which were too
heterogeneous have been subdivided to facilitate assessment and
the analysis of income levels. The following categories are thus
subdivided : "General Agriculture", ''Horticulture", "Fruit",
''Vines", "Cattle" a.nd "Pigs".
Each of these specific types has
thus been rearranged into more highly specialized sub-groups.
For example, "Horticulture" ha.s been subdivided into five sub-groups,
namely "outdoor market gardening", "market gardening under glass",
"outdoor flowe:r-growing"
1"flowe:r-growing under glass", and
"field-scale vegetable-growing", whilst "Cattle" ha.s been subdivided into
"beef a.nd veal", "milk" a.nd "mixed" {no specialization).
20. The refinement of the Community system for the classification of
holdings will considerably enhance the scope of the FADN results,
some of which related to excessively heterogeneous groups of
holdings.
To retain the maximum number of points of comparison
between the
"1973"
and
"1974"
results on the one hand and those
published earlier on the other hand, groups of holdings constituted
on the basis of the
alre~-e:x;istingclassification have been
-
18-'Dm.s, for example, the
"1974"
results include not only the group
averages for
"milk:",
"beef' and
veal"
and "mixed" (no specialization),
lm:t
also the average results for all three groups combined under
"Cattle".
21.
Resu1ts
are
presented
only
f'or
groups
of ten or more holdings
constituted at
regional
(or national) level for
"1974"•
The
resu.lts of
the
corresponding constant sample
in
this respect
are
p».blished
only
vhere the number of holdings is at least
5.
'The
user
shOill.d
first of' all note the figure at the head of' each column
g.iv.i.IDg
the :number of holdings in the
grou.p
(first criterion) as it
provides
an
indication of the scope of' the data appearing in the
colw:m..
B. GraOO.s for
the
ana.!vsis of' the trends
in
incomes
22. !he reoorl contai.ns a series of graphs prepared
by
computer (see
.Annex
VII
B).
'Dlese
graphs
show the trends
in
income from one
year
to another.
1
i'he
points
in
the
spread on each graph represent retum.ing holdings.
Bothe the regression line and its equation
and
the line
(in
nominal
te:nms) on llhich the "status quo" points are located are also shown.
ihe
graphs
are
accompanied
by
a distribu.tion of the number of
:re-tuun:ing
holdings considered according to their national origin
-
19-V • .19-VALIDITY OF THE
111974
11.A.CC<Xi'NTAlfCY RESULTS
23.
The
"1974"
results as with preceding years m.st
be
used with caution.
In
anal.ysing them it is essential to take account of the fact that
at its present stage of development the FADll has not yet achieved
an entirely satisfactory degree of representativity.
In
certain circumstances they are
very
reliable with
regard
to a
given geographical area, b.tt m.ch less so if considered on a larger
scale. A group of returning holdings adequately' representing
a category of holdings
in
a particular division is not necessarily'
an adequate sample to represent all the holdings
in
the same
category at the national level, where the country concerned mq have
divisions which include this categoey wi thou.t its
being
represented
by
the returning holdings.
Conversely
in
certain groups of some ten returning holdings are
barely adequate to represent the corresponding category of holdings
in
a.
given region, while several groups can at a more aggregated
geographical level give a satisfactocy picture of the situation.
24.
Further, certain average results for excessively heterogeneou.s
holdings can conceal very different situations, even contrary
tendencies pass unnoticed.
The presentation of detailed and more
aggregated results whether geographically or
by
type of farming
reveals the limitations and pitfalls of a too hasty analysis of
su.mmary of the averages presented.
25.
Some groups of holdings emerged following the Community
reclassification of holdings carried ou.t a posteriori, on the basis
of fa.rm return data..
The regional committees responsible for the
selection
had
not envisaged that these groups weald be represented
in the accounting sample.
The average results for such groups
-
20-26. All the groups of holdings falling within the specialized farming
types (details introduced in the Community classification when
the
111973"
results were presented) similarly result only from the
a posteriori classification of holdings selected to represent
certain far less specific types.
27.
It is also to be noted that among the criteria adopted to determine
the situation of the groups of holdings under consideration,
labour income is assessed on the basis of data some of which are
obtained from sources other than the farm accountants.
The level
of such income depends, among other things, on the notional re·l;urn
on the.farm and working capital employed.
28.
~~eeconomic or financial results of the returning holdings are
expressed in EUR using the conversion rates for each national
currency (see Annex III B).
In
a period of generally high
inflation at rates varying from one country to another, i.e. the
situation since
1973,
the comparability of the accountancy data.
could be affected by the fact that the various inflationary forces
a.re not taken into account fully in determining the conversion rates.
To avoid part of these difficulties at least, the trend in economic
results - particularly incomes - of the groups of holdings studied
have been established directly on the basis of results expressed
in national currencies.
29.
It should also be borne in mind that because the Member States'
accounting years are not synchronized (they are out of step
by
21
-VI. PRD,TCIPAL RESULTS FOR
"1974"
30.
This chapter is basically devoted to the general observations
resulting from an initial overall analysis of the economic
situation of various types of holding found in the different
regions of the Community.
This first analysis was mainly
based on the labour income per
ALU
(LI/ALU); it concentrates
on determining the size of the differences in income observed
and on ascertaining certain essential causes.
The following chapters (chapters VI and VII) will examine another
aspect, namely the development of labour income per ALU, in
particular between
"1973"
and
"1974"•
A.
Profile of the a.vera.ge
FADN
returning holding in
"1973"
31.
The average farm corresponding to the total sample of some
13 500
returning holdings observed in
"1974"
in the Conmru.nity has the
following characteristics :
PROFILE OF THE AVERAGE
FADN RETURNING
HOLDING
"1974"
Factors and means
Production and Income
of production
UAA
42.80
ha
Gross production
701
EUR/ha.
Gross output
654
EUR/ha
Labour
2.1
ALU
Net farm income
330
EUR/ha
Working capital 30
534
ET.JR
Labour income
4 661
EUR/ha
Comparing the accounting sample in the
"1973"
report and the
"1974"
report, there is a slight increase in area. per holding
(41.69
ha to
42.80
ha.) and an appreciable increase in capital
per holding
(28 670
EUR to
30 534
EUR). The manpower shows no
perceptible change.
Production is slightl7 up but the labour
income per ALU is slightly down
(4
661
EURfALU from
4 824).
The average Coiill"ntA.nity returning holding in
"1974n
is certainly
not entirely identical to the average farm in the Community.
The latter, excluding farms of less than
5
ha, has an area of
-
22-Community returning holding is an initial point of reference for
analysing the structural and economic diversity of all returning
holdings observed by the FADN in
"1974"•
32. Labour income per ALU in the average Community returning holding
(4 661
EUR) is the result of a. very wide variation. Among the
13 500 or so returning holdings observed, more than half (about
7
300) have a labour income of less than
4
000 EUR/ ALU (the
labour income for around 20% of these being between 2 000 and
4
000 IDR/ALU), while barely a tenth (1 000) have a labour
income of over 10 000
EL~/ALU.
Thus, a. little under
4Q%
of
the re:turning holdings are to be found in an intermediate zone
of between
4
000 and 10 000 EUR/ALU (1).
B. Distribution of income among farms according to type of farming
and size
33.
An
examination of incomes according to the main types of farming
or the farm area shows that :
a) farms with both the highest overall income and the highest
labour income per ALU are those in the "arable" or "pigs
and poultry" classes, followed by farms concentrating on
"grazing stock" and finally those concerned primarily with
"permanent crops" (2).
The level of labour income in
accounting holdings engaged mainly in grazing stock does·
not achieve
6Q%
of the income of those farms engaged in
arable cropping, even though the latter type requires more
labour (
+
20Cfo),
while using pra.ct ica.lly the same land area
and requiring approximately the same working capital.
(1) Similar observations were established in
"1973".
(2) In
"1973"
the relative position of the categories of holding
:
I
Sub-groups of
accounting
sample
-
23-CHARACTERISTICS AND INCOMES "1974
11IN ALL
REWRlfiNG HOLDINGS ACCORDING TO TYPE OF
HOLDING OR UTILIZED AGRICULWRAL AREA
Humber
Net
Labour
of
UAA
ALU
Capi-
farm
income
hold-
tal
revenue/ per
ings
(ha)
(IDR)
ALU
ALU
(EUR)
(EUR)
1
2
3
4
5
6
(6)
LI/AW
(5)
Xlowest
100
=
100
1
8 __
Sub-group
byfarm
type
• product ion of
arable
2.625 49,72
2,44 34.202 9-511
§.699
70
185
• permanent crops
1.898
9,77
2,18 15.161 4.740 3.625
75
100
• grazing stock
(cattle, sheep)
7-491 51,30
2,03 32.217 5.855 3.962
68
109
• pigs and poultr,y
1.426 29,63
1,67 35.575 8.547 5-461
64
151
Sub-groups by UAA
.
<
5
ha
UAA
1.274
2,6o
2,0
13.591 6.928 4.871
10
156
.
5 - 10
ha UAA
1.758
7,65
1,8
11.109 4.044 3.124
77
100
• 10 -
20 ha U
AA.
3.280 15,17
1,7
19.126 4.761 3.373
71
108
• 20 - 50
ha UAA
4.543 31,67
1,9
32.061 6.348 4.252
67
136
~
50
ha UAA
2.6o3 140,49
3,1
63.658 9.545 6.523
68
209
b)
t·li th the exception of a very composite group of farms with
an area of less than
5
ha, which include highly intensive
and specialized holdings, in particular in the field of
horticulture under glass and pigs or poultry, both the net
income per ALU and the labour income per ALU increase with the
farm area; they are
respective~1 :
2.4
and 1 :
2.1
which
means that when the category changes from
5
ha to
10
ha to
over 50 ha, the income doubles (1).
{1)
The average area of this last type is of
140
ha. This category
is characterized by a very large variation over the agricultural
area. These vary from 50-60
ha
to nearly 300 ha (beef cattle in
~J:pe
of
-24-c) According to type of farm, the labour income represents between
7o%
and
8o%
of total return on production factors consisting on
the one hand of the total labour force of the holding and on the
other of the farmers' own capital (land and buildings and working
capital).
The larger farm, the less important the part
pl~edby wages in the return on all production factors.
Depending on
the size of the farm, the share of the labour force varies from
i
(5-10 ha) to 2/3 (
~
20 ha).
c.
Distribution of income according to types of farming
34.
There is considerable variation between labour income of farms
carrying on the same type of farming.
AVERAGE CHARACTERISTICS OF RETURNING HOLDINGS FOR
"1974"
ACCORDING TO TYPE OF FAJWIING
(total of returning sample)
Number
Capital
Net
rbour
1(6)
of
UAA
ALU
(EUR)
revenue
ALU
5
¢
LI/
ALU
=
farm
incomy
n
X<t1{~)
farming
return.
~oldings(ha)
ALU/EU:R IDR
100
1
2
3
4
')6
1
8_,
111
General
1.064 70,37
2,2 39.159 11.845 8.399
71
180
I
agriculture
130
Arable - grazing
678 56,59
2,5 38.264
1·566
5.375
71
115
stock
310
Grazing stGCk -
1.537 42,02
2,2 32.778 6.137 4.280
10
92
arable
milk
2.396 30,62
2,0 32.267 6.024 4.191
70
90
336
Cattle meat
1.007 72,73
1,8 30.864 4.615 2.866
62
61
mixed
1.018 45,66
2,2 38.047 6.255 4.216
67
90
340
Grazing stock -
1.124 25,85
1,7 29.742 6.352 4.016
63
86
pigs and poultry
430 Pigs, poultry -
641 27,34
1,7 34.511 7.340 4.777
65
102
grazing stock
44S.
Pigs
455 27,21
1,6 38.66o 10.141 6.516
64
140
I
112
Horticulture
567
6,43
3,0 24.306 9.108 6.351
70
136
223 Fruit
558
7,84
2,3 10.549 4.961 3.979
00
85
-
25-35.
The level of labour income per ALU in the general agriculture
holdings reaches almost triple that of those cattle holdings
specializing in beef production while the latter holdings use
approximately the same area of land (70 ha instead of 73 ha) a.nd
need virtually the same amount of capital (17 800 EUR instead of
17
100 ).
36.
With the exception of the holdings in the classes horticulture, fruit
and vines, the average capital employed in the majority of the types
of holdings is between 30 000 and 38 000 EUR whatever their
specialization. While this is a relatively limited range, at the
level of individual holdings the variation is considerably more
important.
The horticulture, vine and fruit holdings fall below the range for
they do not require working capital of much importance; but the
value of their fixed equipment, including plantations, is significant.
D. Variations of income among farms carrying on the same type of
farming
37. The variation of labour income per ALU is also considerable within
groups of farms of a given type of farming.
The following outline
gives an idea of the number of farms in each of 10 classes of
labour income per ALU varying from less than 2 000 EUR to more than
14 000 EUR, each step corresponding to 2 000 EUR.
The diagram (following) shows that in "1974" as in "1973", for each
type of farming under consideration, the dis·tribution of incomes
is large; it is spread more broadly for general agriculture and
pig farming, types of farming where the average income was relatively
high, than for fruit cultivation and beef production where average
incomes are relatively low.
The size of the variation offers to a number of holdings favourable
prospects for increasing their incomes without making major changes
in their management.
Nevertheless these prospects can be realized
-26-DISTRIBUTION OF RETURNING HOLDINGS - FADN " 1974 "
RELATED TO CERTAIN TYPES OF FARMING ACCORDING TO TEN CATEGORIES OF LABOUR INCOME PER ALU (TOTAL SAMPLE)
1- GENERAL AGRICULTURE 40
"
30
20
10
0
GRAZING STOCK- 40
"
30
20
10
0
-GRAZING STOCK
"
40
.---.%
112- HORTICULTURE
40 224-VINES
30
20
10
0
"
40
30
20
10
0
"
40
30
20
10
0
3361- MILK
3362- BEEF
3365- MILK+ BEEF
NOTICE
Categories of labour income EUR I ALU40
30
20
10
0
"
40
30
20
10
0
"
40
30
20
10
0
340 -GRAZING STOCK-PIGS, POULTRY
43o- PIGS, POULTRY-GRAZING STOCK
448- PIGS
1
=
<-2000 5=
4000 - 6000 9=
12000- 140002
=
-2000- 0 6=
6000- 8000 10=
~140003
=
0 - 2 000 7=
8 000 -10 0004
=
2 000 - 4 000 8=
10 000 -12 000 0=
Average labour income per ALU40
30