White Rose Research Online URL for this paper:
http://eprints.whiterose.ac.uk/9961/
Monograph:
McHardy, J., Reynolds, M. and Trotter, S. (2007) Network Regulation Using an Agent.
Working Paper. Department of Economics, University of Sheffield ISSN 1749-8368
Sheffield Economic Research Paper Series 2007004
[email protected] https://eprints.whiterose.ac.uk/ Reuse
Unless indicated otherwise, fulltext items are protected by copyright with all rights reserved. The copyright exception in section 29 of the Copyright, Designs and Patents Act 1988 allows the making of a single copy solely for the purpose of non-commercial research or private study within the limits of fair dealing. The publisher or other rights-holder may allow further reproduction and re-use of this version - refer to the White Rose Research Online record for this item. Where records identify the publisher as the copyright holder, users can verify any specific terms of use on the publisher’s website.
Takedown
If you consider content in White Rose Research Online to be in breach of UK law, please notify us by
Sheffield Economic Research Paper Series
SERP Number: 2007004
Jolian McHardy*, Michael Reynolds and Stephen Trotter
Network Regulation Using an Agent
February 2007
* Department of Economics
University of Sheffield
9 Mappin Street
Sheffield
S1 4DT
United Kingdom
Abstract
This paper introduces a new regulatory concept: the independent profit-maximising regulatory agent, as a possible
model for regulating network industries where complex demand interdependencies, in particular demand
complementarities, make traditional methods of regulation difficult. We derive a simple theoretical network
model with differentiated demands and explore alternative competitive and regulatory strategies. We show that
the employment of an independent profit-maximising agent may offer a partial solution to the problem of network
regulation, yielding outcomes which involve all parties pursuing their own interests yet are relatively desirable to
both firms and society.
JEL #s: D43, L13, R48
1. Introduction
Economists know that where there are two perfectly complementary goods or services each provided by a single
(monopoly) firm, the overall price to the consumer will be lower if the firms are allowed to collude on price than
if they set prices independently (Cournot, 1838). In such situations price collusion should be preferred to the
alternative of independent pricing: both society and the firms involved will be better-off. This sort of reasoning
underlies, for instance, the „block exemption‟ from the relevant provisions of the 1998 Competition Act given to
multi-operator public transport pricing schemes in the UK (see Office of Fair Trading, 2002). However, this
conclusion may not carry over to a situation with more complicated demands. Networks often have demand
structures which include both complementary and substitute relationships between commodities. Thus,
encouraging collusion on some parts of the network may undermine the potency of potentially beneficial
independent pricing on other parts. Economides and Salop (1992) explore the issue of pricing on a network by
extending Cournot‟s model of complementary monopoly. They show that breaking up a monopoly, even in the
presence of substitutes, can result in higher prices. However, this is dependent on the form the monopoly split
takes. McHardy (2006) addresses a related question: if collusion is ruled-out, how much competition is required
amongst rival (substitute) producers of complementary goods in order to yield a welfare improvement relative to a
situation of perfect collusion between the complementary producers. It is shown, in the two complementary good
case at least, that relatively little competition in one or other of the complementary goods is required to achieve
this.
Of course, the general idea that collusion can be beneficial is at the very least somewhat counter-intuitive, and
there is a widespread tendency to introduce a regulator to control pricing across a network, especially where the
services are all operated by a single monopolist. An alternative approach is to enforce a vertical separation in the
industry by inserting a (supposedly) competitive layer between the network provider and the consumer. This was
done in the early days of mobile telephony in the UK, when Cellnet and Vodaphone were obliged to sell to the
public through service providers, but did not prove to be a very satisfactory solution (see Cave and Williamson,
Communications Commission in the USA or the Office of the Rail Regulator in the UK, and in these
circumstances even an active, pro-competition regulator is likely to be seen as the „dead hand‟ of the state. The
rising importance of network industries in modern economies coupled with the difficulties of applying traditional
regulatory approaches makes this area one of considerable interest for policy-makers. This paper introduces a
different type of regulatory agent (that we have not seen before in the literature), one who operates much more
within the industry and who may even take a share of the industry‟s profits. We examine how the employment of
an independent agent may provide a useful instrument for regulators in separating the pricing decisions on
complementary and substitute aspects of a network: allowing collusive pricing on complementary aspects of the
network without compromising the benefits of independent pricing amongst substitutes.
The following section introduces a simple network model with differentiated demands in the context of a
monopoly or perfectly collusive duopoly (we use the two terms interchangeably). In Section 3, the equilibria
under three regimes are derived and compared: a network monopoly which (i) is unregulated (ii) faces an
independent profit-maximising agent who sets the price on the cross-network commodity bundles, taking an
arbitrarily small share of the associated profit (iii) faces an agent, but the agent takes all profit on the
cross-network commodity bundles. Section 4 repeats the analysis for the case of independent (non-collusive) cross-network
duopoly. Section 5 examines the relative size of equilibrium values of key variables under each regime. Section
6 is a conclusion.
2. THE MODEL
Consider a simple demand system where consumption involves two commodities X and Y in fixed and (for
simplicity and without loss of generality) equal proportions. Whilst fixed proportions is a reasonable assumption
in the context of networks, it is easily shown that given this assumption along with (i) the fact that all agents
maximise objective functions over a complete bundle of commodities rather than an individual commodity and
(ii) the symmetry of the model, the further assumption of equal proportions changes nothing within the model.
( , ) ( = 1,2). Assuming that the distinct versions of each commodity are interchangeable (but not perfect
substitutes), we refer to commodity bundle ( , ) as the single-network bundle and ( , )( = 1,2),
as the cross-network bundle. For example, transport companies provide interchangeable tickets (tickets which
can be used on other companies‟ services), mobile phone service operators charge different prices for access to
their own network relative to other service providers‟ networks, Microsoft and Apple both produce operating
systems and software which are interchangeable to some extent and there are now a few companies who offer
broadband/telephone-TV hybrid deals as well as the stand-alone products.
For simplicity, we denote demand for commodity bundle ( , ) as . Let demand be linear in its own
price and also in the prices of all the possible alternative (substitute) commodity bundles:
= + . ( , = 1,2) (1)
In this specification, , which is related to the partial own-price elasticity of demand, is common for each
commodity bundle as is the unit cross-price co-efficient which is common across all alternative commodity
combinations to : all the alternative commodity bundles are equally good substitutes. Of course, the unit
cross-price coefficient indicates the degree to which services are differentiated and might realistically be expected to
feature as a strategic choice variable of a firm rather than be parametric and equal to one as it is here. It is
important to note, however, that the system of demand functions satisfies integrability and hence is supported by a
utility function.
Given (1), the following restriction is required to ensure a system of gross substitutes:
> 3. (2)
Having established the demand structure for the model we now briefly turn our attention to costs. The central
concern of this paper is with the relative prices, outputs and profits under different regulatory regimes. For
simplicity we assume marginal cost is constant and equal to zero. Given that the structure of the model (the
prices or quantities across regimes and are also assumed to be zero. This assumes away possible co-ordination
costs under collusive regimes and assumes the introduction of the regulatory agent (whose role involves making
only price decisions – it produces no physical outputs) is at zero fixed cost.
The case of first-best social welfare maximisation is a trivial one. With zero marginal costs a social planner
will set the price for each commodity equal to zero. Thus in all regimes revenue, costs and hence profits are all
zero; hence, from (1), = , ( , = 1,2). However, reference to a benchmark first-best variable (price,
quantity or surplus) is of limited use in the present case as with the inter-related demands, changing from one
regime to another, prices and quantities may move in different directions in different sectors of the network
making general conclusions about welfare difficult. Given our assumptions about the demand structure (in
particular symmetry) welfare is not path dependent, but for our purposes the expressions are too complex to work
with. However, all the equilibrium variables of interest are multiplicative, and of the same order (for each
variable across the regimes), in . Hence, any absolute comparisons with the first-best are as arbitrary as .
Since in the absence of negative externalities, more consumption is generally privately and socially better than
less, we construct a social preference ranking for the regimes which is non-decreasing in the total consumption
across the network. The (weighted) average price across the network is also included in the social preference
ranking: regimes with lower average prices are at least weakly preferred. The emphasis on total quantity is
appealing for a number of reasons. Indeed, an “output-related profits levy” which would reward faster growth of
output was one regulatory mechanism considered when British Telecom was privatised in 1984, and of course a
(weighted) average price is the focus of the „RPI–X‟ regulation that was actually introduced. Alternatively,
maximising passenger-miles was adopted as a target by London Transport (see Glaister and Collings, 1978, and
the references therein). It was also put forward by Sir Peter Parker, when Chairman of British Rail, in his 1978
Haldane Lecture.
The social welfare function can be summarised by (subscripts on S denote partial derivatives):
where is the total consumption on the network and is the (weighted) average commodity bundle price. Given
the above discussion, we suggest that the weight on the former term would be strictly greater than that on the
latter. We refer to a regime which improves both terms, (+, ), as strictly superior or preferred, whilst one
regime is weakly superior or preferred to another regime if (+, +), i.e. total consumption increases but (despite
this) there is a rise in the (weighted) average price.
With the theoretical framework of the paper established, we now proceed to consider the relative merits of two
different regulatory regimes against the free market case under, first, network monopoly in which a single firm (or
two perfectly collusive firms) provide(s) all the services on the network, and second, non-collusive network
duopoly, in which two rival firms offer differentiated single-network operations which can be combined into two
cross-network operations.
3. PERFECT COLLUSION OR NETWORK MONOPOLY
In this section we consider the equilibrium prices and outputs in a situation of network monopoly where all
commodity bundles ( , ) ( , = 1,2) are provided by a single profit-maximising firm or by two perfectly
collusive firms with firm m producing ( , ) = 1,2 . To maintain general applicability of the modelling
framework, we allow the network to be a monopoly or perfectly collusive duopoly, as appropriate to the case
being considered. There is a possible distinction to be made between the network monopoly and perfectly
collusive network duopoly in terms of the optimal choices of the number of commodity variants and the degree of
differentiation between them. However, in this paper we treat them as a constant across all regimes.
In this section, we are interested in examining three regimes. The first regime (M1) is the free-market case in
which the unregulated monopolist sets all prices to maximise profit across the network. In the context of this
paper, this is equivalent to two single-network providers being allowed to collude on all prices. The advantage of
such a policy is that it acts against the negative cross-network externalities in the model: private incentives are, to
some extent, aligned with social incentives in that by colluding on prices on this part of the network firms
were to insist on separating the network monopoly into two single-network operations or to eliminate all collusion
on pricing between two single-network operators. Clearly this policy does not come without its drawbacks: by
allowing collusion on the network or by not splitting up the network monopolist, the potential gains in terms of
decreased prices through competition between single-network commodity bundles is lost. In the second regime
(M2), the social planner employs an independent agent who is responsible for setting the price for the
cross-network commodity bundles ( , ) ( = 1,2) and who maximises profit which is assumed to be an
arbitrarily small proportion of total profit on the cross-network operation. An independent, profit maximising
agent is again employed in the third regime (M3). However, in this case the agent keeps all the cross-network
profit. As in the case of M1, it is assumed that the social planner is unable or unwilling to either prevent collusion
between a network duopoly or split up a network monopoly. In examining regimes M2 and M3, we are asking
whether, in such cases, the employment of an agent can yield an improvement upon a situation where firms are
simply allowed to collude on all commodity bundle prices.
Beginning with regime M1, the network monopolist‟s profit, in general terms, is given by:
1= +
=1,2 =1,2 . (4)
where for ease of reference and given the symmetry of the model, (= = ; = 1,2) is the price of
the cross-network commodity bundle. The choice of this simplifying notation on cross-network price becomes
apparent in Section 4. However, it is important to note that the imposition of this symmetry at this point has no
bearing on the solutions given the general symmetry of the model and the assumption of monopoly, and later a
single agent.
Using (1) and maximising (4) with respect to and yield the following equilibrium single- and
cross-network prices:
Hence, the network monopolist does not discriminate on price across the different commodity bundles. This
result has to do with the symmetry of the model. Substituting (5) into (1) yields the following equilibrium
expressions for quantity demanded of single- and cross-network commodity bundles:
1 = 1 = /2. ( = 1,2) (6)
It follows that the (weighted) average, and in this case common, price and the total quantity consumed of the
commodity bundles under regime M1 are, respectively:
1 = 2 3 , (7a)
1= 2 . (7b)
Finally, using (5) and (6) in (4), we have the equilibrium aggregate profit under regime M1:
1
= 2 3 . (7c)
We now consider the second monopoly regime, M2, in which an agent is employed by the social planner to set
the price on the cross-network commodity bundle. Pricing is simultaneous and the agent seeks to maximise profit
over cross-network demands, from which it gets an arbitrarily small fixed proportion, . The monopolist now sets
and the agent sets ( = 1,2), in order to maximise their respective profit functions:
M = =1,2 + (1 ) =1,2 , (8a)
A = =1,2 . (8b)
Solving the maximisation problems simultaneously yields:
= (1 + )/{2 1)2+ 2 ,
Taking limits yields the following equilibrium single- and cross-network prices under regime M2:
lim 0 M2 = (1 + )/{2 1)2 2 , (9a)
lim 0 M2 = /{2 1)2 2 . (9b)
It is important to note that this regime introduces strategic interaction between the firm(s) and the agent, making
the case distinct from one in which = 0 is imposed in the general profit functions (8). The latter simply returns
the network monopoly case, M1.
Substituting (9) into (1), the equilibrium quantities in regime M2 are given by:
M2 = /2, (10a)
M2 = ( 1)/{2 1)2 2 . (10b)
Finally, the (weighted) average price, the total quantity of commodity bundles consumed across the network and
aggregate profit accruing to the network monopolist, are, respectively:
P 2= {[ 1)2 2 + 1 + 2 1 }/{2[ 1)2 2 2 1 1 2 }, (11a)
Q 2 = { 2 1 1 2}/{( 1)2 2}, (11b)
2
= 2{[ 1)2 2 + 1 + 2 1 }/{2 1)2+ 2 2 . (11c)
Comparison of (11) and (7) yields the following proposition.
Proposition 1.1 (i) The network monopolist strictly prefers the free market regime M1 over the agent regime M2:
M1
> M2. (ii) The social planner strictly prefers regime M2 over regime M1: 2, 2 1, 1 .
The third monopoly regime, M3, involves an agent who sets the price on the cross-network commodity
bundles, but keeps the entire share of profit on this part of the network, i.e. = 1. Imposing = 1 in (8), (9) and
(10), yields the following equilibrium prices and quantities:
3 = 3= /{2 2 }, ( = 1,2) (12a)
3 = 3 = ( 1)/{2 2 }. (12b)
Note that under M3, like M1, there is symmetry in single- and cross-network prices and outputs.
Substituting (12) in (8) with = 1 yields the following equilibrium average price, total quantity of commodity
bundles consumed across the network and profit for the monopolist, respectively:
PM3 = /{2( 2)},
QM3 = 2 1 ( 2),
M3 = 2( 1)/{2 2)2 .
Note, M3 captures the total profit accruing to the firm(s), excluding the agent since for our purposes, we are only
interested in comparing profits to establish the relative benefits of each regime from the viewpoint of the firm(s)
not the agent. In cases M1 and M2 profit to the firms and profit across the industry are the same (only
industry-wide terms are indicated by a tilde).
Proposition 2. (i) The network monopolist strictly prefers the agent regime M2 over the agent regime M3:
M2
> M3. (ii) The social planner strictly prefers regime M3 over regime M2: 3, 3 2, 2 .
Corollary 1. By Propositions 1 and 2 (i) M1 > M2 > M3 and (ii) 3, 3 2, 2
To summarise, so far, the preference ranking of the network monopolist over the three regimes is the reversal
of the ranking for the social planner with the case of the agent taking all cross-network profit being the least
favourable to the monopolist and best for the social planner, and the free-market case being best for the
monopolist and least good for the social planner. M2 is a compromise regime for both firm(s) and the social
planner.
4. NON-COLLUSIVE NETWORK DUOPOLY
In this section, we examine the effects of introducing greater strategic interaction in the model by assuming a
duopoly in which two separate non-collusive firms provide the substitute single-network operations, and also
contribute to two cross-network commodities: firm m provides the m component of (i) , (ii) , and, (iii)
( = 1,2). Essentially, this section seeks to address the question, could the monopoly or perfectly
collusive regimes in Section 3, with and without an agent, be improved upon by forcing independent
(non-collusive) pricing between the duopolists or splitting up a network monopoly? Note, when comparing regimes in
terms of attractiveness to the firms it is now important to treat the monopoly case as a perfectly collusive duopoly
where each firm shares half of the overall profit. Thus a duopoly regime will be preferable from the firms‟
viewpoints to a monopoly (perfectly collusive) regime if profit for each firm in the former is greater than half that
in the latter case.
We begin, as in section3, by considering a regime, D1, in which the duopolists operate in a free (unregulated)
market and set their single-network and component of the cross-network commodity bundle prices independently
and simultaneously. Regime D2 involves the employment of an agent in the setting of the price for the
cross-network commodity bundle in such a way as to maximise its arbitrarily small share of profit on the cross-cross-network
operation whilst regime D3 involves employment of an agent, who retains all the profit on the cross-network
We assume each firm m sets the price of its own component, ( = 1,2), of the cross-network commodity
bundle price. Given the symmetry of demands, the cross-network commodity bundle price, , is the sum of these
two component prices for both cross-network combinations:
= = =1,2 ( = 1,2). (13)
Given (13) the general expression for the profit of firm m is given by, 1:
1= + ( + ) = 1,2 . (14)
Using (1) and (13) in (14) and maximising with respect to and for = 1,2 yields the following first
order conditions, respectively:
2 + + 4 + 2 = 0, (15a)
1 + 2 + 2 + = 0, = 1,2 . (15b)
Given the symmetry of the problem, in equilibrium, = and = , and given (13), solving (15a) and
(15b) simultaneously yields the equilibrium expressions for the cross- and single-network commodity bundle
prices, respectively:
1 =
11+ 21= 4 /{3 2 5 }, (16a)
1 = 2 5 . (16b)
Using (16) in (1) yields the following equilibrium expressions for cross- and single-network demands,
respectively:
1 = 3,
The (weighted) average price, total quantity and aggregate profit across the network are then, respectively:
1 = (17 32)/{3(2 5)(5 9)},
1= 2 (5 9)/{3(2 5)},
1
= 2 2(17 32)/{9 2 5)2 .
Proposition 3. (i) The firms strictly prefer regime M1 over D1 and D1 over M3: M1 > D1> M3. (ii) The
firms prefer M2 over D1 if > 5.15. (iii) The social planner strictly prefers regime M2 over regime
D1: 2, 2 1, 1 . (iv) The social planner prefers regime M1 over D1 if > 6.00.
Corollary 2. By Propositions 1 and 3 and if is sufficiently large: (i) M1 > M2 > D1> M3 and (ii)
3, 3 2, 2 1, 1 1, 1 .
This is an important result. First, network monopoly (M1) may be preferred by society to unregulated duopoly
(D1) if is sufficiently large: hence the positive effects through competition on substitute services created by
splitting up a monopoly network are outweighed by the negative complementary externalities. Second, for
society, the monopoly under regulatory agent M2 is always preferable to unregulated duopoly (D1). McHardy
(2006) concludes that social planners wishing to make improvements upon monopoly (perfectly collusive
complementary monopoly) should not split up the monopoly and create a situation of complementary monopoly if
there is little prospect of separation leading to entry and competition in the production of the complementary
goods. Proposition 3 suggests that where such post-separation entry is unlikely, employment of a regulatory
agent may provide a partial solution to this problem.
We now introduce regime D2 in which the independent agent sets the cross-network commodity bundle price
so as to maximise its own profit: an arbitrarily small fixed proportion, , of the profit on the cross-network
2= ( + )
( = 1,2).
of which the share to firm m and to the agent are respectively:
2 = (1 ) ( + )/2
, (17a)
2= ( + ) ( = 1,2). (17b)
In the simultaneous price-setting scenario, the agent sets to maximise its profit (17b), whilst firm m sets to
maximise its profit:
2= + (1 ) ( + )/2 ( = 1,2). (18)
Substituting (6a) into (18) and maximising with respect to , yields the following first order condition:
= + + 3 /(2 ) ( = 1,2). (19)
Similarly, substituting (6b) into (17b) and maximising with respect to :
= ( + + )/{2 1 }. (20)
Solving (19) and (20) simultaneously, yields:
= (1 + 2 )/{2 2 1) 1 (3 ) , ( = 1,2) (21a)
x = (1 + 2 )/{2 2 1) 1 (3 ) . (21b)
Taking limits yields the following expressions for the equilibrium single- and cross-network commodity bundle
prices, respectively:
lim 0 D2 = /{2( 2)}, ( = 1,2). (22a)
Substituting (22) in (1) yields the following equilibrium commodity bundle demands:
2 = 2 = ( 1)/{2( 2)}, ( = 1,2).
The (weighted) average price, total quantity and aggregate firm (non-agent) profit under regime D2 are then,
respectively:
P 2= /{2 2) ,
Q 2 = 2 1 ( 2),
2
= 2( 1)/{ 2)2 .
Proposition 4. (i) The firms strictly prefer regime M2 over D2 and D2 over M3: 2> 2> 3. (ii) The
firms prefer D2 over D1 if > 6.68. (iii) The social planner is indifferent between regimes D2 and M3:
2, 2 ~ 3, 3 .
Finally, we introduce regime D3, in which the independent agent keeps all profit on the cross-network bundle.
Setting = 1 in (21) yields the equilibrium single- and cross-network prices, respectively:
3 = /{ 2 1 1 2}, ( = 1,2) (23a)
3 = (2 + 1)/ 2[ 2 1 1 2] . (23b)
Substituting (23) in (1) yields the associated equilibrium commodity bundle demands:
3 = 2 + 1 1 /{2[ 2 1 1 2]}, ( = 1,2)
3 = 2/{ 2 1 1 2}.
Finally, the (weighted) average price, total quantity of commodity bundles consumed and aggregate firm profit
3 = 8 3 3 1 2 4 2 1 2 1 1 2 ,
3= 4 2 1 2 1 1 2 ,
3= 2 2 3/{ 2 1 1 2}2.
Proposition 5. (i) The firms strictly prefer regimes D1 and M3 over regime D3: ( 1, 3) > 3. (ii) The
social planner strictly prefers regime D3 over regime D2: 3, 3 2, 2 .
5. DISCUSSION
The propositions of Sections 3 and 4 have provided information on rankings over six regimes for the
profit-maximising firms and for the social planner whose preferences are given by (3). Based on these findings, we can
generate a complete ranking for both sets of preferences. The positions of certain regimes in the rankings are
dependent on the level of . These conditional rankings are reproduced in Table 1, below.
First, for the firms, not surprisingly, the unregulated monopoly regime M1 is always most preferred. However,
it is least preferred for the social planner for sufficiently low levels of . If is sufficiently high, then regime D1
is actually worse than M1 for the social planner: splitting up the profit-maximising network monopolist into
independent duopoly reduces welfare. This is a variant of the result that complementary monopoly is worse than
monopoly. Indeed, regime D1 is never high ranking for either the firms or the social planner. Regime D3, on the
other hand, is always the most preferred for the social planner and least preferred for the firms. Regimes M3 and
D2 are always (level) second highest ranking for the social planner, but for the firms D2 ranks well if is
sufficiently large. Finally, regime M2 is highly ranked for the firms if is relatively high, and is mid-ranking for
Table 1 – Firm (Non-Agent) and Social Rankings of the Six Regimes (from most to least preferred)
< 5.15 5.15 < < 6.00 6.00 < < 6.68 > 6.68
Firm Ranking Social Ranking Firm Ranking Social Ranking Firm Ranking Social Ranking Firm Ranking Social Ranking
M1 D3 M1 D3 M1 D3 M1 D3
D1 M3=D2 M2 M3=D2 M2 M3=D2 M2 M3=D2
M2 M3=D2 D1 M3=D2 D1 M3=D2 D2 M3=D2
D2 M2 D2 M2 D2 M2 D1 M2
M3 D1 M3 D1 M3 M1 M3 M1
D3 M1 D3 M1 D3 D1 D3 D1
Note: The social planner only weakly prefers M1 to D1 if < 7.30.
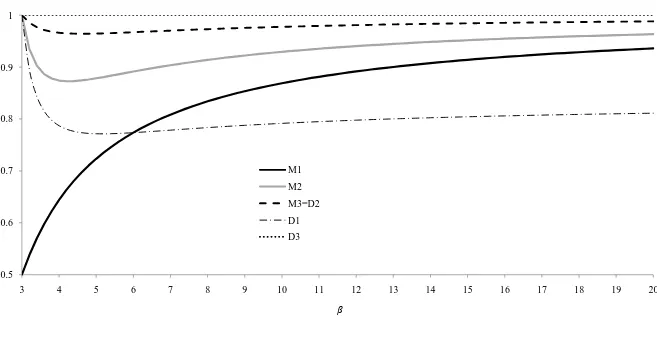
However, in order to draw more insightful judgements about the various regimes, it is necessary to have some
indication about the relative payoffs for each party (excluding the agent) in each regime. Figures 1 to 3 illustrate
the relative levels of firm profit, total output and the (weighted) average price, respectively. Regime D1 is clearly
damaging to all parties, standing out in particular in terms of high prices and low output. From a profit point of
view, D3 and M3 are at best around 50% of the monopoly level. In all other cases, the price and profit variables
converge on the unregulated monopoly M1 levels and the output variable converges on D3 from below as
increases. However, in terms of output, regimes M3=D2 lie within just 3% of the D3 level (society‟s most
preferred regime). In terms of average price, M3=D2 are marginally worse (higher) than D3. Finally, in terms of
profit, regime D2 is at worst (for the firms) 75% of the monopoly level, but the percentage quickly approaches
100% as increases. In summary, D2 appears to be favourable compromises for both firms and the social
planner, more so for the former as increases.
6. CONCLUSIONS
In this paper we have explored possible partial solutions to the problem of regulating firms in a network industry
planner (with preferences over output and average industry price) across alternative regulatory regimes. The idea
of separating a network monopolist along substitute lines, without any further intervention, was shown to be a bad
policy from the social planner‟s view-point and also for the firms for sufficiently high levels of (which is related
to the own-price elasticity). Indeed, maintaining an unregulated monopoly or perfectly collusive duopoly on the
network, whilst obviously best for the firm(s), may be better, too, for the social planner. However, unless is
very large, this strategy is still greatly inferior to solutions involving the agent. Unfortunately, the socially-best
agent regime is very harmful to the firms: such a regime might suffer from significant efforts by firms to avoid
such regulation (e.g. rent seeking) or to distort the information available for the agent to make optimising
decisions. However, two of the agent regimes, one where an agent faces a monopolist and takes all cross-network
profit, and one where an agent faces a duopoly and takes an arbitrarily small share of cross-network profit, were
shown to be equivalent to the social planner with the firm(s) strictly preferring the latter. It turns out that these
two regimes yield a network output less than 4% below the social planner‟s preferred regime, and the latter yields
a profit to the firms which approaches the monopoly level for increases in . It follows, therefore, that regime D2
which involves splitting up a network monopoly but imposing an agent who sets cross-network prices but earns
an arbitrarily small share of associated profit is a potentially important compromise regime for all parties.
END NOTE
1. The proofs to all propositions follow from straightforward manipulations, use of L‟Hôpital‟s rule and/or are
confirmed by the Figures.
ACKNOWLEDGEMENTS
The authors gratefully acknowledge useful comments made by Peter Else, Jon Stern and Peter White and
REFERENCES
Cave, M. and Williamson, P. (1996). "Entry, competition, and regulation in UK telecommunications", Oxford
Review of Economic Policy, 12, 100-121.
Cournot, A. (1838). Researches into the Mathematical Principles of the Theory of Wealth, originally published in
French, translated (1897) by Nathaniel Bacon, New York: MacMillan.
Department for Transport (2004). Evaluating the Processes and Impacts of Integrated Transport and the
Cross-Sector Benefits of Improved Accessibility. Prepared by NERA and MVA.
Economides, N. and Salop, S.C. (1992). “Competition and Integration Among Complements, and Network
Market Structure”, Journal of Industrial Economics, March, 40, 105-123.
Else, P.K. and James, T.J. (1995). “Privatisation and the Quality of Rail Services” Transportation Research A,
29, 387-400.
Glaister, S. and Collings, J.J. (1978). “Maximisation of Passenger Miles in Theory and Practice” Journal of
Transport Economics and Policy, September, 12, 304-321.
McHardy, J. (2006). “Complementary Monopoly and Welfare: Is Splitting up so Bad?” Manchester School, 74,
334-349.
Parker, P. (1978). A Way to Run a Railway. Haldane Memorial Lecture, Birkbeck College, London.
United Nations Framework Convention on Climate Change (1997). Kyoto Protocol to the United Nations
0.3 0.4 0.5 0.6 0.7 0.8 0.9 1
3 4 5 6 7 8 9 10 11 12 13 14 15 16 17 18 19 20
M1
M2 M3
D1 D2
[image:22.792.85.755.100.451.2]Figure 2 – Total Output by Regime Relative to Regime D3 (D3 = 1)
0.5 0.6 0.7 0.8 0.9 1
3 4 5 6 7 8 9 10 11 12 13 14 15 16 17 18 19 20
M1
M2
M3=D2
D1
Figure 3 – Weighted Average Price by Regime Relative to Regime M1 (M1 = 1)
0.3 0.4 0.5 0.6 0.7 0.8 0.9 1 1.1
3 4 5 6 7 8 9 10 11 12 13 14 15 16 17 18 19 20
M1
M2
M3 = D2
D1