3-1965
Generation and testing of random number
sequences
Frank S. Carlsen
Iowa State University
Follow this and additional works at:
http://lib.dr.iastate.edu/ameslab_isreports
Part of the
Computer Sciences Commons, and the
Mathematics Commons
This Report is brought to you for free and open access by the Ames Laboratory at Iowa State University Digital Repository. It has been accepted for
inclusion in Ames Laboratory Technical Reports by an authorized administrator of Iowa State University Digital Repository. For more information,
please contact
digirep@iastate.edu
.
Recommended Citation
Carlsen, Frank S., "Generation and testing of random number sequences" (1965).
Ames Laboratory Technical Reports
. 96.
Abstract
Two methods of generating pseudo-random numbers in a decimal computer are described. Methods of
testing the sequences of generated numbers are discussed and the two methods of generation are compared to
determine which method is superior for general usage. A computer routine to generate both uniformly and
normally distributed numbers is presented, with a table of 9000 three digit numbers uniformly distributed on
the unit (0 -1) interval.
Disciplines
Computer Sciences | Mathematics
IOWA STATE UNIVERSITY
GENERATION AND TESTING OF
RANDOM NUMBER SEQUENCES
by
Frank S. Carlsen
RESEARCH AND
DEVELOPMENT
REPORT
U.S.A.E.C.
~
UNITED STATES ATOMIC ENERGY COMMISSION
Research and Development Report
GENERATION AND TESTING OF
RANDOM NUMBER SEQUENCES
by
Frank S. Carlsen
March, 1965
Ames Laboratory
at
Iowa State University of Science and Technology
F. H. Spedding, Director
This report is distributed according to the category Mathematics and
Computers (UC-32) as
listed in TID-4500, January 1, 1965.
LEGAL NOTICE
- - - ,
This report was
prepared
as an account of Government sponsored
work.
Neither the
United States,
nor the Commission, nor any person acting
on behalf of the Commission:
A.
Makes any warranty or representation, expressed or implied,
with respect to the accuracy,
completeness,
or usefulness of
the
information contained in this report, or that the use of any
information, apparatus, method, or process disclosed in this
report
may not infringe privately owned rights; or
B.
Assumes any liabilities with respect to the use of, or for
damages
resulting from the use of any information, apparatus,
method, or process disclosed in this report.
As
used in the above,
"person acting on behalf of the Commission"
includes
any
employee or contractor of the Commission, or
employee
of such contractor, to the extent that such employee or contractor of the
Commission, or employee of such contractor prepares, disseminates,
or provides access to, any information pursuant to his
employment
or
contract with
the
Commission, or his employment with
such contractor.
Printed in USA.
Price$
2. 00
.
Available from the Clearinghouse for
Federal Scientific
and Technical Information, National
Bureau of Standards,
U. S. Department of
Commerce, Springfield,
TABLE OF CONTENTS
ABSTRACT . . .
INTRODUCTION.
STATEMENT OF THE PROBLEM.
SOL UTI ON OF THE PROBLEM .
Method 1
Method 2
Testing Considerations.
Tests
TABLES .
Results for Method 1
Results for Method 2
INTERPRETATION OF RESULTS
FINDINGS
NORMAL DISTRIBUTION.
PROGRAM LISTING
REFERENCES,
APPENDIX
I I
Page
1
1
1
2
2
3
3
4-9
10
10
15
22
24
25
26
27
GENERATION AND TESTING OF
RANDOM NUMBER SEQUENCES
Frank S. Carlsen
ABSTRACT
Two methods of generating pseudo-random numbers in a decimal
computer are described.
Methods of testing the sequences of generated
numbers are discussed and the two methods of generation are compared
to determine which method is superior for general usage.
A computer
routine to generate both uniformly and normally distributed numbers is
presented, with a table of 9000 three digit numbers uniformly distributed
on the unit (0 -1) interval.
INTRODUCTION
In many problems it is often desirable to have available either a
table of random numbers or a computer routine to generate such numbers.
There are many problems where a solution may be found by using Monte
Carlo techniques.
Some typical problems are those involving
permuta-tions and combinapermuta-tions of variables, evaluation of definite integrals, the
solution of ordinary and partial differential equations, solution of integral
equations, solution of linear algebraic equations, and simulation studies
in nuclear physics.
STATEMENT OF THE PROBLEM
The problem was to provide in subroutine form a program for the
IBM 7074 computer, which would generate long sequences of numbers
sequence as possible.
The routine should be
fast and the numbers
gener-ated should have a long period
before
the sequence
repeats.
In
addition,
statistical tests should be performed to insure
that the generated
se-quences of uniformly distributed
numbers meet various criteria for
ran-domness.
SOL UTI ON OF
THE
PROBLEM
Several methods of generating random
numbers by computers are
generally believed to be acceptable.
Two
such methods are the
multipli-cative congruential and the mixed congruential
methods. In this paper
no proofs will be given as to the
choice of
parameters,
proofs are given
by the references.
A
table of
9000
three-digit
numbers uniformly
distrib-uted on the unit interval is included as
an Appendix to the paper.
Method 1:
where
A
is a fixed odd integer
called
the
multiplier.
To start the process
we follow the suggestion
of
[5]
and
choose
x
as any integer not divisable
0
by 2 or 5.
A
is chosen as the
form
A
=
200
t
:±.
r
( 2)
where tis any integer and r is
any of the values
3, 11, 13,
19, 21, etc.
A
value of
A
close to lOd/ 2
is
desirable.
Since
d
=
10 for the
IBM
7074
computer, a t of 50 and an r of
ll were chosen giving a
A
of 10011, hence
=
10011 x.
It
can be proven that this procedure will yield 500, 000, 000
numbers
before
repeating.
Ax forms a product 2d-digits long, the high order
d-digits
are
dis-a
carded and the d low-order
digits
are the value x
1
when properly edited
to floating point arithmetic format. The low-order digits are
used
to
pro-duce xi+
1
using Eq.
(1).
Method 2:
The mixed congruential method takes the form
(4)
where
A
according to
[
l ], 1s of the form
(5)
Reference [ l] further states that c should be odd and a
>
2.
Hence for
this method A was chosen as
10 l and c as l yielding
xi+l
=
lOlxi + l
(6)
The above method should yield
10 10 numbers before repeating.
In a
deci-mal machine,such as the IBM 7074 where multiply time is dependent upon
the size of the multiplier, Method 2 should be slightly faster, as well as
having a somewhat longer period.
Testing Considerations:
The values of x should be uniformly distributed over the unit interval
regardless of the number
of values computed.
Successive values of x
Many different tests have been used to determine the statistical
behavior of the sequences.
The testing as reported by references [1],
[ 2], [3], [4],
CsJ, Cs],
and
[9]
indicates that the behavior of both
methods is acceptable.
It
was decided to use the following statistical tests; frequency test,
serial correlation test, runs up and down, runs above and below the mean,
auto-correlation, digit frequency test, and the mean square difference
test.
These tests were all performed using various lags. Lag 1 is
de-fined as picking every consecutive generated number as the random
quan-tity, lag 2 as picking every other generated number and so on.
Each of the above tests was applied to 100 blocks of 1000 numbers
each, for lags 1 to 10 for each method.
It
has been shown by [
4
]
that
the choice of x
for Method
2
makes little or no difference, so most of
0
the testing was done with x
= 7 which also meets the criteria that x
0
0
should not be di vi sable by
2
or
5
for Method 1 as suggested by [
5
]
.
Frequency Test:
For the frequency test the 1000 numbers were "binned" into 10 equal
subintervals with the expectation that 100 numbers should fall into each bin.
The following Chi-squared test was then applied to determine the
reason-ableness of the results.
Let f.(i=l,
2, ... ,
10) be the number of members x
.
satisfying
1
J
(i-1)/10
<X.<
i/10, then
xi
was computed
J
10
xi
=
rio
r;
(f. -
1oo) 2
(7)
Reference [ 6]
states
that
X
2
1 is distributed asymtotically as x
2 with 9
degrees -of-freedom.
x1 was computed for the 100 blocks
2
.
Then let F.
1
2
be the number of the resulting 100 values of xl which were between the
(i-1) th and the ith deciles for the x
2
-distribution with 9
degrees-of-free-dom.
The following quantity was then computed.
(8)
Serial Test:
For the serial test
the interval [0,
1] was divided into 10 parts,
then the numbers were
"binned'' into a 10
x
10 matrix. A 1 was added in
row i column j, when xn was in
the ith subinterval and followed by
xn+
1
in the jth subinterval.
The expected
result would be 10 counts in each
position of the matrix.
The
following x
2
test
was
then applied
1
10
=
~
TO
. .
1
1,
J
=
2
(f .
.
-
10)
1J
(9)
It
has been shown by [
8]
and
[ 9] that
X~
-
x;
should be distributed
asymptotically as x
2
with 90
degrees -of-freedom.
X
2
1 -
X
2
1
was computed
for
each
of the 100
blocks.
Then
let
s.
be
the number of the
resulting 100
1
2
2
values of x
2
-
X
1
which were
between the (i-1)
th
and the ith
deciles for
x
2
with 90 degrees-of-freedom.
The
following was
then comput
ed:
10
x
2
=
1
~
(s. - 10)
2
(10)
s
TO"
i=l
1
Several other
interesting
statistics were also computed using the 10
x
10
sum count would occur in each element of the row.
Similar results would
be expected for the column sums and the column elements.
To test these
assumptions a
x
2 test Was performed on the COmposite 10
X10 matrix
obtained by summing the matrix over all 100 blocks.
Auto-Correlation Test:
For the auto-correlation test the auto-correlation coefficient Ch
was computed for h
= 0, 1, 2, 3, . . . , 10 for each of the 100 blocks
1
ch=
m
1000
~
i =1
xi x i+h
( 11)
Statistical theory shows that truly random samples give values of
Ch for h
= 0 of . 3333 and for h > 0 Ch "" . 25.
Runs Test:
To find the runs up and down,a sequence of digits is formed whose
nth term is defined as 0 if x
1 <x
1 and as 1 if x
>
x + 1 . A
subse-n+
n+
n
n
quence of k zeros, bracketed by ones at each end forms a run of length k,
similarly for runs of ones.
The test involves counting the number of
occurrences of runs of different lengths and comparing to expected
re-sults.
The expected results, based on a truly random sample, are:
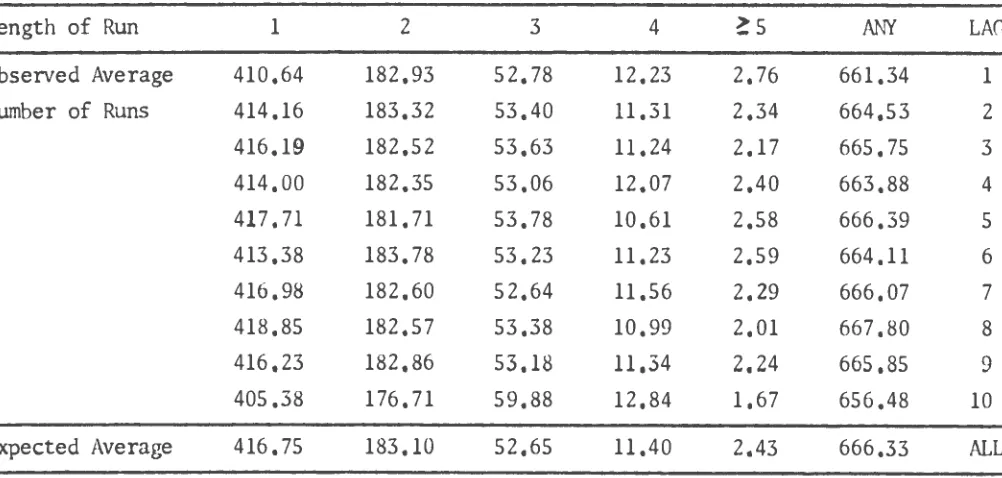
(2N -1) /3 runs total or 666. 33 for the case at hand.
Other expected runs
are: 416.75 runs of length 1, 183. 1 runs of length 2, 52.65 runs of length
2
3, 11. 4 runs of length 4, and 2. 43 runs of length 5 or greater. A
X
test was performed on each set of runs up and down for each block of
1000 numbers to check for reasonableness.
formed whose nth term is defined as 0
if
x
<
1/2 or 1 if x
>
1/2.
n
n
Again runs are counted with the results being checked by a
x
2
test. In
this case the expected results are: 500. 5 total runs of any length, 250. 0
runs of length 1, 125. 0 runs of length 2, 62. 5 runs of length 3, 31. 25 runs
of length
4,
15. 625 runs of length 5, 7. 8 runs of length
6,
and 8. 325 runs
of length
7
or greater.
For both of the run tests above, an average over the 100 blocks is
computed for each of the length runs involved in the respective tests.
Mean Square Difference Test:
The mean square difference test involves computing
M=
1000
1
1000
~
i=l
(x
.
1
( 12)
where d
=
1, 2, 3, 4, 5, 10, 100, 10
l.
M has an expected value of . 16667.
For this test the M
1s obtained from each block of 1000 numbers were
averaged over the 100 blocks and this average was tabulated for each value
of d
.
Digit Frequency Test:
Although the purpose of the computer program under development was
to produc
e
random numbers, some information about the distribution of the
individual digits making up the numbers is also desirable. For the digit
frequency test a count is kept of the occurrance of each digit (0, 1, 2, . . . , 9)
for the 1000 words.
Since each random number in its floating point
repre-sentation contains only 8 possible digits in each number, there are 8000
100 times in each digit position. A
X
2 test was used to check the
reasonableness of this assumption.
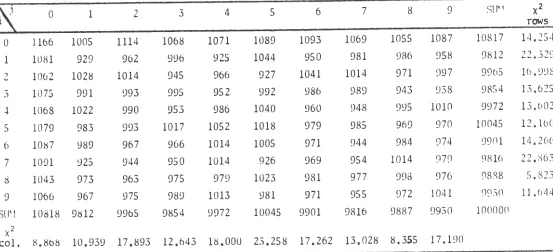
Another possible check is to group the digits together and check for
frequency of occurrances of each digit; positions 1,
2, and 3, 300
occur-rences; positions 1,
2,
3, and 4, 400 occurrences; ... ; 1,
2,
3, 4, 5,
6, 7,
and 8, 800 occurrences of each digit.
A
X
2 test was then applied to check
the results for each block of 1000 numbers. In addition, these two
x
2 for
the 100 blocks should be distributed asymtotically as
X
2
with
9
degrees-of-freedom.
Following the procedure outlined in the Frequency Test section
two additional sets of
X
2
were computed, one for each of the eight
individ-ual digit position
X
2, and one for each the seven grouped digit
X
2
In addition to the above tests the mean and variance of all numbers
comprising a block were computed using:
1
X
=
""I"''()TT
1000
!;
i=l
v
=
1
(10~0
1000
i=l
X,
1
2
(1000
)
2
)
xi -
L;
x.
i=1
1
1000
( 13)
( 14)
The expected values of these quantities are 0. 50000 and 0. 08333
respectively.
The following was then computed using the entire 100
blocks
100
1
XM =
TOO
L;
X.
j
=1
J
( 15)
1
100
VM =
TOO
!;
v.
j
=1
J
9
In the tables that follow these definitions apply.
Let k be the
number of times
xi
for the frequency test exceeds 21. 666,
the
99% level
for
X
2with 9 degrees-of-freedom. In a similar manner let 1 and m be
the number of times
X
2 for runs up and down and runs above and below
the mean exceed 21. 666.
n is the number of times
X
2 for the digit
h
=
Observed
Expected
TABLE lA
XM
VM
k
xr
2
x2
s
.49809
.08384
1
6.4
4.0
.49889
.08376
1
6.4
5.2
.49919
• 08372
1
9.2
6.8
.49876
.08366
3
8.0
16.8
.49923
.08314
2
5.6
9.2
.49837
.08362
1
7.0
14.2
.49921
.08353
2
7.2
10.2
.49871
.08383
2
12.4
11.2
.49848
• 08372
3
21.6
6.6
.49868
.08288
1
6.8
9.4
TABLE lB
Auto-Correlation based on
100
sets of
1000
0
1
2
3
4
5
6
.33243 .24853
.24843 .24847 .24860 .24846 .24823
.33268 .24901 •
24871 .24896 .24929 .24860 .24910
.33266 .24864 .24882
.24918 .24878 .24946 .24865
.33260
.24906
.24904
• 2485 7 .24912 .24885 .24893
.33268 .24891
.24969 .24994 .24946 .24933 .24933
.33159 .24746
.24741 .24805 .24793 .24791 • 24 771
.33269 •
24911
.24923
.24898 • 24913 .24917 .24892
.33248 •
24877
.24893
.24892
.24900
.24879 .24829
.33214 .24914 .24842
.24827
.24803
.24881 .24840
.33189 .24914 .24867
.24929 .24906 .24908 .24884
.33333
• 25000
1
rn
Lag
0
0
1
0
0
2
0
0
3
0
1
4
0
1
5
0
0
6
0
0
7
1
0
8
0
0
9
0
0
10
7
8
9
10
Lag
[image:17.593.138.458.83.346.2] [image:17.593.29.562.420.656.2]TABLE lC
~~an
Square Difference based on
100
sets of
1000
(x. - x. d)
1
1+
2
d
=
1
2
3
4
5
10
100
101
LAG
OBSERVED
,16780
,16800
,16793
,16766
,16745
,16756
,16722
,16734
1
.16733
,16797
,16745
,16679
,16817
,16747
,16758
.16 729
2
.16803
,16767
.16696
,16774
,16639
,16756
,16748
,16871
3
,16708
,16711
,16805
,16695
,16749
.16800
,16 722
,16749
4
,16753
,16597
,16548
.16642
.16668
,16592
,16666
,16684
5
,16825
,16836
,16708
,16731
,16735
,16807
,16760
,16899
6
.16715
.16691
,16741
.16712
,16703
,16665
,16764
.16724
7
,16742
,16709
,16712
,16695
,16738
,16714
,16828
,16819
8
,16598
,16742
,16772
,16820
,16664
,16767
,16731
,16806
9
.16552
,16644
,16520
,16565
,16562
,16534
,16673
,16639
10
EXPEC1ED
.16667
ALL
TABLE
10
Runs above and below the mean based on
100
sets of
1000
Length of run
1
2
3
4
5
6
'>7
AW
LAG
Observed ave • no. of runs
250,98
125,11
62,37 31,36 14,95
7,80 7,87
500,44
1
248,66 123,86 64,07 30,74 15,09
7,79 8,14
498,35
2
249,08 126,44 62,44 31.09 15,10
7,60 7,97
499,92
3
249,38 123,48 62,71 31.51 16,04
7,67 7,68
498.47
4
252,07 124.98 61.40 30,90 15.76
7,60 8,02
500,73
5
251.10 127.42 62,59 30,53 14,94
7. 71
7,78
502,07
6
250.11 125,65 61.82 31.28 16,05
7,46 7,73
500.10
7
250,63 125,51 62,71 30,35 15,32
8,02 7,80
500,34
8
245.30 124.04 62.30 32,23 15,15
7,89 8,23
495.14
9
248.22 125.73 62,56
30,74
15.12
7,73 8.29
498.39 10
[image:18.593.42.557.76.748.2]TABLE lE
Runs up and down based on 100
sets of 1000
Length of run
1
2
3
4
25
A.
'Iff
LAG
Observed
ave. no. of runs
415.33
184,64
52.16
11.57
2.14
665,84
1
415.29
183.22
53.12
11.44
2,19
665.26
2
415.78
183,04
52.37
11.48
2.61
665.28
3
417.16
182,56
53.49
10.97
2,26
666.44
4
420.47
182,07
52.72
10,87
2,34
668.47
5
415.68
183,58
51.82
12,32
2,07
665,47
6
416,87
182,05
53,09
11.11
2,63
665.75
7
414.40
182.70
53.75
11.29
2,37
664.51
8
412.84
182.99
53,04
12.00
2.36
663.23
9
415.06
184.14
52,33
11.84
2,09
665.46
10
Expected
ave. no. of runs
416.75
183.10
52.65
11.40
2.43
666,33
ALL
For the digit frequency
tests it is convenient to tabulate the number
of times
x
2
exceeds
the x
2
value of 21,666 for the 99% level. It is
expected that
x
2
should
exceed this value once in every 100 samples.
TABLE lF
Digit
frequency test
for 100 sets of 1000
Digit position
1
2
3
4
5
6
7
8
LJ\C
w
1
2
0
0
2
4
1
0
1
1
0
0
2
1
1
0
4
2
1
0
1
2
0
4
0
0
3
3
1
0
1
1
1
0
0
4
2
0
2
1
1
4
1
0
5
1
2
1
1
0
1
0
0
6
2
1
1
1
2
0
2
2
7
2
2
0
2
0
1
0
4
8
3
1
1
1
2
3
2
0
9
1
0
0
2
0
0
0
0
10
[image:19.593.28.554.115.364.2] [image:19.593.77.495.461.704.2]-• TABLE lG
n for Grouped Digit Frequency Test based on 100 sets of 1000
Digit position
1-2
1-3
1-4
1-5
1-6
1-7
1-8
LAG
0
0
1
6
17
22
14
1
0
1
1
1
1
1
1
2
0
1
0
0
0
0
1
3
0
4
2
3
3
3
1
4
1
0
1
1
2
1
2
5
2
0
1
0
0
0
0
6
1
2
2
1
0
1
2
7
3
2
2
1
0
1
0
8
2
1
1
0
0
2
1
9
2
1
1
0
0
1
0
10
TABLE 1H
x2
for individual digit positions based on 100 sets of 1000
Digit position
1
2
3
4
5
6
7
8
LAG
6.4
9.0
13.4
14.2
16.0
10.2
3.8
9.6
1
6.4
9.2
16.8
9.6
16.4
13.6
s.o
16.8
2
9.2
12,8
12,0
6,0
9.6
6,0
8.2
24.8
3
8,0
10.2
15.2
6.4
7,4
5.0
9.8
26.4
4
5.6
7.4
11.6
12.2
3.6
8.8
23.0
100.0
5
7,0
6.0
22.6
11.4
9.8
9.8
6,8
45,6
6
7.2
5.4
18.4
6.0
19.2
7.2
18.2
16.0
7
12.4
13.2
6.6
19,0
13.2
8.6
8.2
32.8
8
21.6
10,2
7,0
7.8
7,4
8,8
6.8
16.0
9
[image:20.591.43.545.110.729.2]x2
for groupcJ Jigit positions bascJ on 100 sets of 1000
lli?,it y>o<>itions
1-2
1-3
1-4
1-5
1-6
1-7
1-S
Li\G
15.0
9.8
7.2
83.0
184,6
149.4
159.6
1
22.8
13.0
5.2
11.2
5.0
5,8
5.8
2
5.2
9.0
11.4
7.4
6.0
3.2
7,6
3
10.6
7,2
2.8
9.0
10,8
11.2
7,0
4
5,4
5.8
7.4
4.4
18.2
17.4
5,8
5
7.0
12.6
12.8
6.2
6.6
13,6
6,4
6
9,8
7,4
13.8
9.0
12,4
10.8
12.6
7
8.2
4.8
6.4
4.4
6,8
7,8
1.2
8
13.2
12.0
12.6
14.2
7,0
11.8
7,6
9
16.6
5.4
9,0
10.6
4.8
11.8
13.4
If\
TABLE 1
.
1
rrequency Uistribution Among 100,000 numbers paired for Lap, 1
~
0
1
2
3
4
5
6
7
H
9
Slf'
1
2
X
rows
0
1107
933
1001
1024
1011
1056
1036
1008
ll08
1028
10312 23.124
1
995
1020
1016
986
989
949
1033
986
1002
965
9941
5.799
2
1080
0043
991
1008
966
989
982
974
963
1015
10011
12.239
3
1022
990
1002
996
1000
985
971
967
996
1017
9946
2,787
4
977
980
1016
993
950
1017
1003
991
98H
1012
9927
3,897
5
1051
1008
97b
985
955
1020
972
995
1025
1014
10001
7,520
6
1049
1034
1057
966
979
1018
965
930
980
986
9964
15,374
7
1003
941:!
993
992
997
1018
974
964
976
985
9850
3,738
8
985
1006
981
1037
1017
1003
1027
1016
997
973
-10042
3,820
~)
1044
979
978
959
1063
946
1000
1019
1007
1011
10006 11.947
SU!-1
10313
9941
10011
9946
9927
10001
9963
9850 10042
10006 100000
x2
15.769 11.358 5.299 5,132 10,344 10.344 6,861
6,796
14,618 4.128
[image:21.587.44.553.359.697.2]For the remaining lags only the
row
and column
x2
will
be presented
for the composite matrix.
i=i=
0
1
2
3
4
5
6
7
8
9
Li\\-xz
7.328 10.644 10.779
6.152
8.314
5.298 12.663
7.491
5.527
6.509
2
rows
4.860
4.463
4.987 20.301
5,469
9.420
4.836
4.127
4.996 11.949
3
9.840
4.134
4.270
5.418
8.201
4.536
8.100 14.173
9.624 11.208
4
8.912
9.425
9.946
6.812
8.544 12.398
6.441 15.900 19.892 10.826
5
16.063
4.828
5.195
4.459 15.680 11.813 12.292 11.043 16.15 7 11.388
6
5.289 11.882
5.998
5.615 16.910
7,321
9.369
6.313
7,201
9.336
7
3,197 20.293 10,604 16.418
8.491 15.211
5,982 11.455
8,076 10,442
8
19.307
7,962
6,154
8,611 18.542 16.380
2,534
5.273 12.624
9.294
9
13.166 11.596
8.852
3.487 20.339 13.306
4,419
4.576
4.331
8.839 10
xz
4.017
9.939
9.464
9.478
7.210 16.40
3.801 8.907
2.8D4
8.613
2
columns
7.662
7.587
9.035
1.801
6.513
4.921
6.006
8,992
3.478 19.201
3
7,958 10.901
4,914 10.349 13.292
2.524 10.388
8.265
5,071
5,797
4
12.483 11.379
9.493 13,704
6.046
7.119
8.906
9.060 12.821 17,899
5
5.311 16.595
4.215
6.206
9.664 17,354 11.005 18,413
8. 775
11.774
6
9.166 11.458
7.05 7 10.803 14.090
6.223
4.122
6.420
6.452
9.374
7
14.159
9.478 10.453 12.516
9.264 25,633
6.516
8,488 10.778
2.847
8
14.295 12.802 10.920 11.916
9.585 11.329
4.983 15.206
7.088
8.984
9
6.323 17,673
7.917
4.107
9.012
6,553
9.106
8,4 77
9,061 15,073 10
Results for
~~thod 2:
TN~LE
2/\
X!'
I
\f.'
I
k
x2
F
xz
s
1
m
LN~
,49526
.08469
0
13,0
18,2
1
1
1
• 49592
.08487
1
8,4
8.4
0
1
2
.49301
.08494
1
4.6
15.2
0
0
3
,49664
.08479
0
7.4
18,6
0
0
4
,49610
.08459
4
9,2
4.6
2
1
5
• 49516
.08483
1
7,6
6,8
0
0
6
• 495 23
,08489
2
15.4
5,6
0
0
7
.49592
.08482
1
12,4
6,6
0
0
8
• 49767
,08491
3
20.0
12.2
0
1
9
TABLE 28
Auto-Correlation based on 100 sets of 1000
h=O
1
2
3
4
5
6
7
8
9
10
LAC
Observed .33035 .24655 .24568 .24585 .24585 .24565 .24597 .24556 .24552 .24550 .245 79 1
.33101
.24587
.245 77 .24641 .24600 .24648 .24569 .24626 .24608 • 245 72 .24633 2
.32820 .24342 .24344 .24298 .24293 .24326 .24328 .24374 .24354 .24339 .24282 3
.33135 .24618 .24598 .24642 .24659 .24709 .24646 .24638 .24672 .24662 • 24 720 4
.33090 .24626 .24667 .24600 .24594 .24606 .24546 .24660 .24801 .24665 • 245 75 5
.33022 .24540
.24484
.24504 .24560 .24510 • 24532 • 24561 .24492 • 24573 .24485 6
.33034 • 24559 .24567 .24493 .24539 .24546 .24505 .24508 .24540 .24558 .24510 7
.33110 .24611 .24658 .24608 .24630 .24663 .24586 .24612 .24697 .24595 .24569 8
.33022 .24517 .24535 .24533 .24542 .24562 .24513 .24541 .24538 • 24503 .24533 9
.33303 .24825 .24643 • 24813 .25059 .24813 .24745 .24789 .24810 .24844 .24792 10
Expected .33333
• 25000
ALL
TABLE 2C
~~an Square Difference based on 100 sets of 1000
2
(x. - x. d)
1
1+
d
=
1
2
3
4
5
10
100
101
LAG
Observed
.16762
.16935
.16902
.16902
.16943
.16913
.16979
.16913
1
.17028
,17048
.16919
.17001
.16907
.16937
.16986
,17027
2
.16957
,16952
,17044
.17054
.16988
.17076
,17135
.17049
3
.17035
.17074
.16987
.16954
.16854
.16831
.16859
.16895
4
.16928
.16845
.16981
.16992
.16968
.17031
.17028
.16954
5
.16964
.17077
.17036
.16924
.17025
.17075
.16927
.16958
6
.16949
.16933
.17082
.16991
,16975
.17047
.17024
.17033
7
.16997
.16904
.17005
.16960
.16894
.17079
.17053
.17036
8
.17009
.16975
.16979
.16961
.16920
.16981
.17024
.17088
9
.16956
.17321
.16980
.16488
.16981
.17023
.17018
.16956
10
[image:23.585.36.554.125.691.2]TABLE 20
Runs above and below the
~~an
based on 100 sets of 1000
Length of Run
1
2
3
4
5
6
~7
A.W
LAG
Observed Average
251.76
123.65
62.37
31.69
16.31
7.35
7.47
500.60
1
Number of Runs
248.63
126.20
61.89
32.27
14.90
7.34
7.99
499.22
2
248.71
124.17
63.30
31.46
15.29
7.70
7.92
498.55
3
249.01
125.95
63.43
31.40
14.63
7.76
7. 72
499.90
4
252.20
123.93
61.72
31.45
15
.oo
8.36
7.82
500.48
5
249.32
126.30
62.98
30.77
15.06
7.79
7.86
500.08
6
249.37
122.37
63.34
31.27
15.77
7.56
8.09
497.77
7
252.95
123.03
62.87
31.55
14.85
7.56
8.13
500.94
8
251.42
124.08
63.52
30.46
14.96
7.81
8.15
500.40
9
240.14
127.93
71.21
30.54
13.37
8.70
5.99
497.88
10
Expected
Average
250.00
125.00
62.50
31.25
15.625
7.80
8.325
500.50
ALL
TABLE 2E
Runs
up
and down based on 100 sets of 1000
Length of Run
1
2
3
4
~5
Pffl
LAG
Observed Average
410.64
182.93
52.78
12.23
2.76
661.34
1
Number of Runs
414.16
183.32
53.40
11.31
2.34
664,53
2
416.19
182.52
53.63
11.24
2.17
665.75
3
414.00
182,35
53.06
12.07
2.40
663,88
4
417.71
181.71
53.78
10.61
2.58
666.39
5
413.38
183.78
53.23
11.23
2,59
664.11
6
416.98
182.60
52.64
11.56
2.29
666.07
7
418.85
182,57
53,38
10.99
2.01
667.80
8
416,23
182,86
53,18
11,34
2,24
665,85
9
405.38
176.71
59.88
12.84
1.67
656.48
10
[image:24.595.33.564.114.351.2] [image:24.595.52.553.425.664.2]TABLE 2F
n for Digit Frequency Test based on 100 sets of
1000
Digit Position
1
2
3
4
5
6
7
8
LAG
0
2
1
3
1
2
3
0
1
1
1
0
2
0
0
0
0
2
1
1
1
0
0
3
0
0
3
0
2
0
0
1
0
0
0
4
4
6
0
1
0
2
0
0
5
1
6
1
1
2
5
0
0
6
2
4
0
0
2
1
1
0
7
1
1
2
0
1
0
0
60
8
3
3
0
3
1
1
0
0
9
5
5
2
0
2
0
0
0
10
TABLE 2G
n for Grouped Digit Frequency Test based on 100
sets
of
1000
Digit Positions
1-2
1-3
1-4
1-5
1-6
1-7
1-8
LA\.
3
18
22
17
12
10
9
1
3
0
1
0
0
1
0
2
4
0
0
1
1
1
1
3
3
3
1
0
1
0
1
4
5
6
5
7
7
5
2
5
2
1
0
1
3
1
1
6
4
3
0
1
4
3
1
7
0
1
0
0
0
3
4
8
7
4
3
3
2
3
1
9
[image:25.591.86.509.139.354.2] [image:25.591.62.532.440.655.2]TABLE 2H
x
2
for individual digit positions based on
100
sets of
1000
Digit Position
1
..
?
3
4
5
6
7
8
LAG
13.0
10.0
7.0
7.6
10.8
7.0
33.8
120.0
1
8.4
12.0
10.4
14.2
4.2
13.6
16.8
900.0
2
4.6
10.8
9.8
3.2
8.2
8.0
13.4
200.0
3
7.4
3.0
4.4
8.2
12.8
7.0
157.6
180.0
4
9.2
26.8
5.6
4.2
9.4
43.2
45 .o
900.0
5
7.6
18.0
4.4
12.6
8.8
11.0
12.8
900.0
6
15.4
21.8
10.4
14.0
5.2
9.0
11.4
440.0
7
12.4
7.4
11.2
6.4
8.8
11.4
80.8
420.0
8
20.0
6.4
10.0
11.8
6.8
6.4
16.2
180.0
9
13.2
17.2
3.6
8.2
23.6
35.0
140.0
900.0
10
TABLE 21
x2
for grouped digit positions based on
100
sets of
1000
Digit Positions
1-2
1-3
1-4
1-5
1-6
1-7
1-8
LAG
27.2
154.0
187.6
101.8
93.8
75.0
61.8
1
16.4
8.0
6.4
11.6
16.6
8.0
s.6
2
12.4
9.6
12.4
13.4
5.8
6.6
7.0
3
8.6
14.6
4.6
14.4
5.0
8.2
13.0
4
38.0
21.6
18.2
23.2
17.4
10.8
13.0
5
23.6
8.8
5.6
17.2
5.2
8.0
14.6
6
18.4
12.2
12.6
3.0
8.8
7.2
5.4
7
7.4
12.2
5.2
8.2
9.8
8.4
23.8
8
37.2
23.8
31.0
31.0
18.8
10.6
15.0
9
[image:26.591.35.562.118.332.2] [image:26.591.39.561.412.627.2]Frequency Distribution Among 100,000 numbers
paired for
Lap,
1
~
0
1
2
3
4
5
6
7
8
9
Sll'
1xz
rows
0
1166
1005
1114
1068
1071
1089
1093
1069
1055
1087
10817
14,254
1
1081
929
962
9~6
925
1044
950
981
986
958
9812
22.32~1
1
1062
1028
1014
945
966
927
1041
1014
971
~l97
9965
tb.~~s
'-3
1075
991
~93
995
952
992
986
989
943
938
9854
13.625
4
1068
1022
990
953
986
1040
960
948
995
1010
9972
13,602
5
1079
983
993
1017
1052
1018
979
985
9()9
970
10045
12. 16
(1
6
10H7
989
967
966
1014
1005
971
944
984
974
99()
1
1
4
.26(
1
7
1091
925
944
950
1014
926
969
954
1014
:J79
9H16
22
,
863
8
1043
973
963
975
979
1023
981
977
998
~l76
9888
5,823
9
1066
967
975
989
1013
981
971
955
972
1041
9930
11.6
44
su~
t
10818 9812
9965
9!554
9972
10045
9901
9816
9887
9930
10
0000
x2
col.
o,8b~
10,939 17,893 12.643 11:1,000 23.25 8
17.262 13.028 !5,355
17.190
r:or the rema1mng lags only the row and column
x
2
H
i
11 be
presen
ted
for the composite natrix,
TJ\13LE
2K
i:sj•
0
1
2
3
4
5
6
7
8
9
LAr
x2
rows 13.913 11.966 13,022
2.418 30,794 14.
866 13,970
12,401 1
9
,
B94
14.054
2
23.852 33,261 14.458
20.936
16.341 10,618
23.796 18,472 11,099
20
,53
5
3
18.682 15,087 10,417
28,537
14,461
26.768 20.723 21,4Hl
14.
738
18,320
4
23.~91
13,636
21,886 16.145 16,928 13,606 12,557
23,462
20
.
453
13,500
5
29,287 13.772 31,331
6,048
28,329
7,271
9.472 17.800
31.110
16.
995
b
28,637 17.402 12.652
22.786
1
4
.408
23.180 10,864 16.211 22,(>58
6
,
R70
7
18.077 29,114 15,H21 13.945 15.193
8,233 58.478 10,883 12
,
63~)
13,
008
8
31.968 22.100 14,320 25.982 23.032
9,027 15.657
21,006
15,67
6
6
,
68H
9
[image:27.591.23.576.125.377.2]L-
J
"'
0
1
2
3
X
20.619
8.836 16.136
9.035
co
lumns
1H.300 22.904 10.695 16.494
13.329
9,288 43.073 10.901
16.043
9.431 25.511 14.742
33.967 15.813 20.568 10.116
24.965 10.870 13.307 13.500
30.717 12.409 20.742 16.815
32.324
9,798 20,415 22.185
21.378 20.221 14.948 21.557
4
5
16.873 20.240
14.217 25.622
17.215 10.989
8,851 38.690
15.338 25.792
20.587 11.408
30,656 12.995
19.679 11.594
17.653 16,668
6
14.990
17.350
24.331
19.15 7
33,926
7.017
19.812
9.810
21.799
7
8
9
LAC
13.524 18.492
8. 072
2
21.704 37.493
9,315
3
11.773 21.095 27.180
4
13.884 16.200 13.929
5
13,439
7.391 14.353
6
[image:28.591.49.580.107.300.2]INTERPRETATION OF RESULTS
It is convenient to analyse the results according to the manner in
which the tables are arranged, comparing the two methods for each test.
For Tables lA and
2A
we would like our generators to yield values
of
X
2 and
x
2 that are not large and not more than about 1% in excess of
F
s
21. 666.
In addition, we would desire that
xf
not exceed 21. 666 more
than about 1% of the time or more than about once in every 100 samples
(tabulated ask). Furthermore the quantities 1 and m should not exceed
one.
Inspection of Table lA shows that
xi
and
x!
are well behaved. 1
and m have reasonable values for all lags. k has good values for lags 1,
2, 3, 6, and 10 whereas for lags 4, 5, 7, 8 and 9, k is somewhat large.
The values of VM are acceptable, however, XM for all lags is somewhat
low.
Although not tabulated, an examination of
x
for lag 1 revealed that
59 values of
x
are less than. 5 while 41 values are greater than. 5.
It
should be noted that the tests involving k,
X~,
x; ,
1 and mare really
tests of the most significant digit of each number, while the mean and
variance use all eight digits.
In this event we can conclude that probably
only the first 2 or 3 significant digits of each number are really random.
In view of this, XM and VM are reasonable and, based on these tests, we
conclude that Method 1 is quite acceptable.
Referring to Table 2A, we see again that
X~
and
x!
are reasonable
for all lags.
The quantity 1 is slightly large for lag 5 while m is too large
for lag 10.
The quantity k is acceptable for lags 1, 2, 3, 4, 6, and 8,
and 10.
We also notice that for all lags Method 2 yields values of VM
that are consistently larger than the expected value of . 08333. As with
Method 1 we notice that XM is lower than the expected value of . 5000,
only in this case to a more pronounced degree than with Method
1.
Based
on these tests we conclude that while Method 2 is probably acceptable,
Method 1 is preferred.
Considering Tables lB and 2B, the tabulation of the
Auto-Correla-tion tests for various values of h, both methods approach the expected
values
;
however, again Method 1 yields more acceptable results for all
lags.
The results of the Mean Square Difference Tests as tabulated in
Tables lC and 2C again show that Method 1 is superior to Method 2.
The
results for Method 1 for all lags agree quite well to the expected value of
. 16667, while the results for Method 2 are all higher than the expected
value.
Considering the results of the Runs Test both for runs up and down
and runs above and below the mean, both methods appear to be acceptable.
The noteworthy exception being Method 2 for lag 10 where, for runs above
and below the mean, the observed average number of runs of lengths 1
and 3 differ considerably from the expected values.
Again for Method 2,
for runs up and down of lengths 1 and 2, the observed average number of
runs differs significantly from the expected results.
This fact is
veri-fied for runs above and below the mean in Table 2A, where k
=
3 for lag
10, indicating excessive failures of the
x
2 test for reasonableness for
A comparison of the two methods, as given by the digit frequency
tests,
is one of the more graphic illustrations of the superiority of
Method
1.
Tables lH and
l i
illustrate that the numbers generated by
Method 1 have good individual digit distribution through the sixth
signi-ficant digit position and, with the exception of lag 1, this is also true
when the digits are grouped.
Tables 2H and 2I illustrate that this is
definitely not true for Method 2 where lag 1 fails for all digit groupings.
In this instance only lags
2, 3, 4,
?, and 8 pass this test. For the
indi-vidual digit positions for Method 2 all lags are acceptable for the most
part through the fifth significant digit position.
Using the information created by the Serial Test where numbers are
binned into a 10 x 10 matrix as previously described, we again conclude
that Method 1 is to be preferred over Method 2.
Inspection of Tables
lJ,
lK,
2J, and 2K reveals that the matrix row and column elements
re-sulting from using Method 2 fail the
X
2 reasonableness test with great
regularity, whereas the results obtained from Method 1 are most
satis-factory.
FINDINGS
A particular multiplier
A
may be considered as defining a group of
number generators. Hence before a particular
A
is judged to be satisfactory,
many such generators should be tested for acceptability by using different
x
values to start the sequence. Although not tabulated here, five different
0
values of x
were tested at selected lags for each generator.
These results
0
only the first three significant digits are random to the
desired
extent.
NORMAL DISTRIBUTION
The methods just described produce random numbers uniformly
distributed on the unit interval; however, often numbers drawn from a
normal distribution are really what is desired.
By applying the Central
Limit Theorm it is possible to obtain normally distributed numbers
from the uniform distribution. [ 6]
The Central Limit Theorm states
that
if
a population has a finite variance
a
2 and
mean~;
then as the sample
Xsize n increases, the distribution of the sample mean
x
approaches the
normal distribution with mean
~and
variance
r}jn.
For the uniform
Xdistribution,
~
is . 5 and
J
is l/12 or . 08333, hence
X~-
=x = . 5, and
( l 7)
X
2
2
0'
Xl
( 18)
0'-
=
--
=
lYrl
X