1
Photobleaching of Red
1
Fluorescence in Oral Biofilms
2C. K. Hope,*
1E. de Josselin de Jong,
1,2, M. R. T. Field,
3S. P.
3Valappil,
1and S. M. Higham
1 45
1
School of Dental Sciences, University of Liverpool, UK 6
2Inspektor Research Systems BV, Amsterdam, Netherlands
7
3Department of Human Anatomy and Cell Biology, University of Liverpool, UK
8 9
*Corresponding Author: Dr Chris Hope, University of Liverpool, School of Dental
10
Sciences, Research Wing, Daulby Street. United Kingdom, L69 3GN. Tel: +44(0) 151 706
11
5296 Email: chope@liv.ac.uk
12
13
Key Words: 14
Oral biofilm, plaque, fluorescence, quantitative light-induced fluorescence digital (QLFD),
15
porphyrin, photobleaching
16
17
2
Abstract
19
Background and Objective: Many species of oral bacteria can be induced to fluoresce due
20
to the presence of endogenous porphyrins, a phenomenon that can be utilised to visualise
21
and quantify dental plaque in the laboratory or clinical setting. However; an inevitable
22
consequence of fluorescence is photobleaching, and the effects of this on longitudinal,
23
quantitative analysis of dental plaque has yet to be ascertained.
24
Material and Methods: Filter membrane biofilms were grown from salivary inocula or single
25
species (Prevotella nigrescens and Prevotella intermedia). The mature biofilms were then
26
examined in a custom-made lighting rig comprising of 405 nm light emitting diodes capable
27
of delivering 220 W m-2 at the sample, an appropriate filter and a digital camera; a set-up
28
analogous to quantitative light-induced fluorescence digital (QLFD). Longitudinal sets of
29
images were captured and processed to assess the degradation in red fluorescence over
30
time.
31
Results: Photobleaching was observed in all instances. The highest rates of
32
photobleaching were observed immediately after initiation of illumination, specifically during
33
the first minute. Relative rates of photobleaching during the first minute of exposure were;
34
19.17, 13.72, and 3.43 (arbitrary units per minute) for P. nigrescens biofilms, microcosm
35
biofilm and P. intermedia respectively.
36
Conclusion: Photobleaching could be problematic when making quantitative measurements
37
of porphyrin fluorescence in situ. Reducing both light levels and exposure time, in
38
combination with increased camera sensitivity, should be the default approach when
39
undertaking analyses by QLFD.
3
Introduction
41
Porphyrins and oral bacteria
42
Fluorescent porphyrins are present in many members of our indigenous microbiota (1, 2),
43
including those found in the oral cavity (3-5). Whilst many bacterial porphyrins are
44
associated with photosynthesis, a relatively large amount of haem (iron protoporphyrin IX)
45
for example is incorporated on the cell surface of the putative periodontal pathogen
46
Porphyromonas gingivalis to protect it from hydrogen peroxide (6) with similar processes
47
occurring in Prevotella nigrescens and Prevotella intermedia (7) (both formerly classified as
48
Bacteroides melanogenicus) (8) . The molecular fluorescence of bacterial porphyrins is an
49
adventitious phenomenon which results from the absorption of a photon and the subsequent
50
re-emission of another photon of a longer wavelength as the electrons in the molecule return
51
from the excited (triplet) state to the ground state. Specific porphyrins have distinct
52
excitation spectra with different maxima; protoporphyrin at 593 nm and coproporphyrin 604
53
nm (9). The wavelengths suitable for the efficient fluorescent excitation of bacterial
54
porphyrins range from near ultraviolet (300 nm) to blue (450 nm). The discrepancy between
55
the colour of the incident light and the fluorescent emission, a phenomenon known as the
56
Stokes shift (10), allows for the selective capture and quantification of the emitted light via an
57
appropriate filter set-up.
58
Photobleaching occurs when a fluorophore is irreversibly damaged so that it no longer
59
fluoresces. Although the exact mechanisms by which photobleaching occur are not clear, it
60
has been suggested that the fluorophores undergo an oxidative reaction with highly reactive
61
oxygen species such as singlet oxygen (1O2) and hydroxyl radicals (OH·) (11). Molecules 62
already in the excited (singlet) state can also be destructively excited by an additional
63
excitation photon, an event dubbed two-photon excitation, but it is unlikely that this process
64
would occur in the experiments discussed herein. Other results have demonstrated
65
photobleaching reactions occurring between excited dye molecules (12) . The generation of
4
highly reactive oxygen species has also been demonstrated to cause cell death in P. 67
gingivalis, P. nigrescens and P. intermedia by the excitation of endogenous porphyrins (13).
68
Lethal photosensitisation (photodynamic therapy) either by the application of
69
photosensitising agents or via endogenous porphyrins has the potential to be an effective
70
means of treating plaque-related diseases (14) .
71
Fluorescence microscopy techniques can utilise the kinetics of photobleaching by
72
fluorescence loss in photobleaching (FLIP) and fluorescence recovery after photobleaching
73
(FRAP) to reveal rates of diffusion within cell membranes, organelles (15) and biofilms (16).
74
However, when undertaking quantitative measurements of fluorescence, photobleaching can
75
be problematic (17). A better understanding of photobleaching phenomena with respect to
76
indigenous bacterial porphyrins in situ is required to enable accurate quantitative analyses of
77
dental plaque to be undertaken.
78
79
Quantitative light-induced fluorescence
80
Quantitative Light-induced Fluorescence (QLF) uses violet light to induce fluorescence in
81
tooth enamel and collects the resulting emissions via a high band-pass filter (>520 nm) in
82
conjunction with a computer-controlled digital camera (18). When viewed under QLF lighting
83
conditions, areas of demineralised enamel fluoresce less than surrounding sound enamel
84
and so appear darker. Regions of demineralised enamel are visible under QLF lighting
85
conditions before they are visible to the eye as white spot lesions (19). Although QLF was
86
initially developed for the analysis of tooth enamel (20), it has been subsequently
87
demonstrated to be capable of revealing dental plaque due to the fluorescence of
88
endogenous porphyrins (5). Quantitative Light-Induced Fluorescence Digital (QLFD) is an
89
adaptation of QLF which employs a modified filter set (D007, Inspektor Research Systems
90
BV, Amsterdam, Netherlands), narrow-band violet light (405 nm) and a high-specification
91
digital SLR camera. This configuration has been specifically developed to enhance the
5
visualisation and quantification of plaque. During clinical investigations to assess plaque,
93
QLFD is typically used to identify regions of red fluorescence and capture a sequence of
94
images at different visits in order to quantify the progression of conservative dental
95
treatment.
96
Materials and Methods
97Filter membrane biofilms
98
Approximately 10 ml of unstimulated saliva was obtained from a healthy volunteer with no
99
previous history of periodontitis. This was split into 1 ml aliquots and frozen. Nitrocellulose
100
filter-membranes (47 mm diameter, 0.45 µm pore size, Invitrogen Ltd., Paisley,
101
Renfrewshire, UK) were laid, with their inked grid upwards, on top of blood agar (Oxoid,
102
Basingstoke, UK) supplemented with 5% defibrinated horse blood. A 50 µl aliquot of the
103
saliva sample was spread over the membrane before being incubated at 37ºC in anaerobic
104
conditions (80% N2, 10% CO2, 10% H2) for seven days to allow microcosm oral biofilms to 105
develop. Individual biofilm laden filter membranes were removed from the supporting agar
106
and placed in a Petri dish which had first had 200 µl of phosphate buffered saline (PBS)
107
beaded over the surface to help prevent the membrane biofilm from drying out. Similar
108
single-species biofilms were grown using heavy colony inocula of Prevotella nigrescens 109
(ATCC 25261)(seven day old cultures) or Prevotella intermedia (ATCC 25611)(five day old
110
cultures) suspended in 1 ml of PBS.
111
112
Fluorescence imaging
113
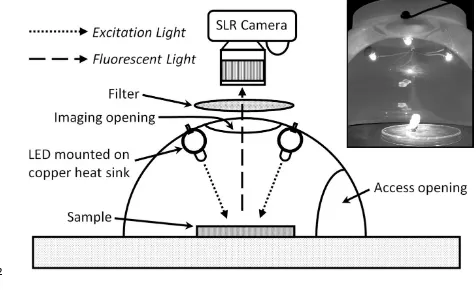
A custom-made rig, incorporating QLFD technology, was constructed to enable the capture
114
of fluorescent images under reproducible lighting conditions from surface-mounted indium
115
gallium nitride light emitting diodes (LED) (EWC 400 SC2C, radiant power 600 mW, 23º
116
beam angle; E Wave Corporation, London, UK) with a wavelength band from 400 nm to a
6
peak output at 405 nm (violet). To construct the QLFD in vitro rig, an LED was soldered
118
onto the outside of a copper ring, being a section of standard domestic plumbing material,
119
which acted as a heat-sink to prevent overheating. Three such mounted LEDs were then
120
fixed inside an approximately hemispherical plastic bowl so that the light beams converged
121
on the sample (Figure 1). A hole was cut into the base for the unimpeded viewing of the
122
sample by a camera, with another hole in the sidewall to allow the sample to be easily
123
manipulated. The LEDs were powered by a DC adaptor with an output of 5 volts at 1.2
124
amps connected in parallel. The distance between the LEDs and the sample was 100 mm
125
at an angle of incidence between camera and LEDs of 30º from the surface normal. The
126
light incident on the sample was measured as irradiance by a photosynthetically active
127
radiometer (PAR) with a cosine corrected detector (Q201 PAR with SD221Q Cos detector,
128
Macam Photometrics Limited, Livingston, UK). A cut-off filter (D007, Inspektor Research
129
Systems BV, Amsterdam, Netherlands) was placed in front of the camera lens to minimise
130
the transmission of light close to the excitation wavelength whilst maximising the
131
transmission of the red part of the spectrum. All illumination / photobleaching experiments
132
were undertaken in a dark-room.
133
Images were captured with a ‘live view’ enabled digital SLR camera, (Model: 1000D, Canon,
134
Tokyo, Japan) equipped with a 60 mm, f/2.8 macro lens (Model: EF-S, Canon) connected to
135
a computer. Proprietary software (C2 v1.0.0.7, Inspektor Research Systems BV) was used
136
to control the camera and store the images. Low apertures (i.e. f/2.8 to f/8) and ISO settings
137
of 200 – 400 were typically used to maximise the light sensitivity of the camera without
138
adversely affecting image quality. The camera’s on-board ‘custom white balance’ feature
139
was calibrated against a sheet of white paper before fluorescence imaging to effectively
140
eliminate the colouration of the filter in the resulting images. The camera resolution was set
141
to ‘low’ (3.4 megapixels) to facilitate the processing of large numbers of data files in the form
142
of uncompressed 24-bit bitmap files. The LEDs were switched on for at least 10 minutes
143
prior to use to allow their temperature to stabilise. Without moving the sample, or changing
7
camera settings, a series of images was captured over time using the in-built image
145
sequencer incorporated into the control software. Control experiments included membranes
146
that were partially covered with aluminium foil to shield portions of them from the light. Four
147
separate microcosm biofilm photobleaching experiments were undertaken whilst the
148
experiments for single species were conducted in duplicate.
149
150
Image analysis
151
Images were analysed with an open source software package (ImageJ 1.43q, The National
152
Institutes of Health, Bethesda, Maryland, USA, http://rsb.info.nih.gov/ij/). The images
153
comprising the time-lapse sequence were opened with ImageJ and compiled into a single
154
image ‘stack’. The stack was then split into its red, green and blue (RGB) component colour
155
channels; to isolate the red channel as an 8-bit greyscale (i.e. pixel brightness values from 0
156
to 255). A user-defined ‘rectangular selection’ region of interest (ROI) was created within
157
one of the inked grid squares on the filter membrane. The size of the grid squares was 4
158
mm x 4 mm and the ROI encompassed approximately 20 000 pixels. The ‘z-axis profile’ of
159
the ROI was then measured through the image stack and the mean pixel brightness values
160
at each time point were copied into Microsoft Excel. The ROI was then moved to an
161
adjacent square on the grid and the process repeated to give a total of eight discrete counts
162
from the same biofilm sample. The mean pixel brightness values from the eight sample
163
sights from the were then themselves averaged before being normalised to 100 at time zero
164
to yield the arbitrary unit used throughout these experiments; ‘normalised mean pixel
165
brightness’ (NMPB), which allowed the direct comparisons to be made between separate
166
experiments.
167
Changes in fluorescence (ΔF) were calculated in terms of the shift in NMPB per unit time to
168
yield results in terms of ΔF per minute. These ΔF values were then allocated into sub-sets
169
to determine mean ΔF between discrete time points within the photobleaching experiment;
170
from 0 to 1 minute, 1 to 2 minutes, 2 to 5 minutes, 5 to 10 minutes and 10 to 20 minutes.
8 172
Inter-operator reliability
173
Two researchers (CKH and MRTF) independently analysed the image stacks from two
174
photobleaching experiments in order to ascertain the reliability of the methods previously
175
described. This exercise was undertaken in light of the possible variability due to manual
176
selection of the ROI parameters; namely: size of ROI, placement of ROI within the
177
membrane square and choice of the eight membrane squares used for analysis. Results
178
were tested using Pearson Correlation with PASW Statistics 17.0 (equivalent to SPSS)
179
(Polar Engineering and Statistics).
180
181
Results
182Light exposure
183
The configuration of the LEDs at an angle of incidence to the sample of 30º (Figure 1)
184
corresponded to a radiant intensity of 0.87 per unit solid angle (Lambert’s cosine law). The
185
angle of incidence was within the angular response parameters of the cosine corrected PAR
186
detector. The maximum radiometer reading at the sample location was 750 µmol m-2 s-1,
187
which is equivalent to 220 W m-2 at 405 nm. Light leakage from the LEDs was minimal,
188
being measured at 1.8 µmol m-2 s-1 immediately outside the obvious pool of light from a
189
single LED. Due to the build-up of heat during operation, the LED’s light output dropped to
190
89% of their initial power after 10 minutes usage after which time their output stabilised (data
191
not shown).
192
9
Biofilm photobleaching
194
Photobleaching was evident in all of the samples analysed in this study; microcosm oral
195
biofilm, P. nigrescens and P. intermedia single-species biofilms. A control experiment was
196
designed to confirm that light was responsible for the reduction in fluorescence in which half
197
of the sample was shielded from direct illumination with aluminium foil. After 25 minutes, the
198
NMPB on the exposed half dropped to 31.23 whilst the covered half was 84.73 (figure 2).
199
Figure 3 shows the results from an individual QLFD experiment which demonstrates
200
photobleaching as a decrease in NMPB over time. NMPB data such as these were collated
201
to yield means along with their corresponding standard deviations (Figure 4).
202
Rates of photobleaching, expressed as ΔF were highest during the initial stages of exposure
203
to light (i.e. the first minute). In the case of microcosm biofilms and P. nigrescens biofilms,
204
photobleaching rates fell to approximately half their initial value after 10 minutes exposure
205
(Figure 5). Initial rates of photobleaching during the first minute of exposure, expressed as
206
ΔF (arbitrary units normalised to 100 at time zero) per minute, were; 19.17, 13.72, and 3.43
207
for P. nigrescens biofilms, microcosm biofilm and P. intermedia respectively.
208
Photobleaching dynamics were reproducible between replicate samples; Pearson correlation
209
coefficient values between the four microcosm biofilm samples ranged from 0.993 to 0.997
210
and were significant at the 0.01 level (2-tailed).
211
212
Inter-operator reliability
213
Pearson correlation coefficients for the two photobleaching experiments subjected to
inter-214
operator reliability testing were significant at the 0.01 level (2-tailed) with correlations of
215
0.992 and 1. The data presented herein was the first set of data that was analysed.
216
10
Discussion
218
Light exposure
219
A PAR detector was chosen to measure the light irradiance from the custom rig since
220
photobleaching is dependent on the amount of light energy incident per unit surface area
221
and not the power output of the LEDs per se (21). The camera / image analysis method of
222
quantifying pixel brightness proved far more sensitive to subtle changes in ambient lighting
223
conditions than the results from the PAR detector would have suggested. The data collected
224
from the automated image sequencer yielded fewer perturbations in the fluorescence curve
225
than when captured manually during preliminary experiments. This suggested that variation
226
in lighting from the laptop screen, reflected off the white laboratory coat worn by the
227
operator, was detectable in the analysed images. The inter-operator reliability data suggests
228
that the image analysis methods employed were robust and reproducible.
229
Whilst every effort was made to focus the light onto the centre of the filter membrane, an ad-230
hoc observation made using the PAR revealed that a single representative attempt to place
231
the detector in the ‘bright centre of the light beams’ by the unaided eye, yielded only 73% of
232
the actual maximum irradiance obtainable by scrutinising the meter readings. The difference
233
between these two positions was of the order of 10 mm. Although the foci of the LEDs were
234
generally convergent onto the sample, it is unclear how the extent of photobleaching relates
235
to specific positions within the pool of light incident on the sample. For example, an area
236
with less light incident upon it, will fluoresce less and will likewise have a lower rate of
237
photobleaching (22). The net result of this would be differential rates of photobleaching
238
across a (large) sample and a hypothetical example of this effect is demonstrated in Figure
239
6. Performing image analysis on adjacent sites on the biofilm membrane will help to
240
minimise the effects of heterogeneous lighting. Another confounding factor that should be
241
considered is the photo-shielding effect (23) which occurs when a relatively high
242
concentration of fluorophore absorbs excitation photons, which in turn reduces the number
11
of photons able to penetrate into deeper layers of the sample. ‘Iron porphyrin’ can account
244
for up to 50% of the dry weight of the biomass of Bacteroides (many of which have been
245
reclassified as Prevotella spp.) when growing on blood agar (24) . Photo-shielding could
246
reduce the observed effects of photobleaching due to decreased excitation within the sample
247
as a whole; in other words, there may not be a direct relationship between fluorescence
248
intensity / photobleaching and net porphyrin concentration within a heterogeneous,
three-249
dimensional microbial biofilm.
250
251
Biofilm photobleaching
252
Rates of photobleaching decreased during exposure to QLFD light for 20 minutes, after
253
which time there was very little further reduction in observed fluorescence. It is unlikely that
254
imaging (exposure) times beyond this would be representative of image capture in vivo. A
255
reduction in mean pixel brightness of ~14% after one minute’s illumination with QLFD
256
represents an unacceptable inaccuracy for the quantitative analysis of the red fluorescence
257
of dental plaque. Casual viewing and manipulation of a sample / patient under the 405 nm
258
lighting in order to correct the focus, determine other camera settings and image capture will
259
inevitably cause photobleaching. In order to minimise this effect, samples should be
260
positioned and focussed under normal, white-light conditions. It is however an unavoidable
261
fact that in order to observe fluorescence, one must perturb fluorescence.
262
The rates of ΔF observed suggest that this effect was immediate and replicated the
263
photobleaching kinetics of protoporphyrin IX previously observed in PLC hepatoma cells at
264
405 nm (25). In the current study, ΔF values were grouped to yield average values for all
265
data points within discrete time bands (0 to 1 minutes, 1 to 2 minutes, 2 to 5 minutes, 5 to 10
266
minutes and 10 to 20 minutes) to obviate the confounding effects of individual data points
267
with a positive ΔF value amongst predominantly negative ΔF (i.e. fluorescence decreasing)
268
values. During a longitudinal study, a system whereby the LEDs are only illuminated during
12
imaging should be employed. This will also maximise the power output of the LEDs as they
270
emit more light when they are at ambient (room) temperature as opposed to once they have
271
warmed to their operating temperature. Using the PAR detector it was determined that the
272
irradiance supplied by the lighting rig did not decrease due to heating effects when operated
273
for 5 seconds out of every minute, similarly lighting for 5 seconds out of every 30 seconds
274
only reduced light output to 99.45% (data not shown).
275
The differential fluorescence of oral anaerobic bacteria under ultraviolet light has been
276
suggested as a tool for their rapid identification. The fluorescence previously observed in
277
strains of Bacteridoes (now reclassified as Prevotella spp. and P. gingivalis) encompasses a
278
colour range that has been described as; red, yellow, red-orange, brilliant red, pink-orange,
279
orange, yellow-orange, and red-brown (26) . These colours also changed with age of the
280
culture and are almost certainly a manifestation of the sequential metabolism of porphyrins
281
(27) . No fluorescence was observed in P. gingivalis at any time, including when emulsified
282
in methanol – a technique which can reveal fluorescence in older cultures which have lost
283
this capacity (2) . The inability of P. gingivalis to fluoresce is probably due to the deposition
284
of haem as an µ-oxo dimer on the cell surface, as opposed to the monomeric form in
285
Prevotella (6, 7). It was observed in preliminary experiments that the fluorescence of P. 286
intermedia was greatly diminished when incubated for seven days, hence the use of younger
287
(five day) cultures.
288
Fluorescence imaging has the potential to be a useful tool for quantifying dental plaque in
289
the research environment (28). The methodology described herein for measuring
290
photobleaching of red fluorescence in microbial biofilms appears to be robust and
291
reproducible. However; the destruction of the endogenous fluorophores within dental plaque
292
by photobleaching phenomena needs to be considered and steps taken to curtail this effect
293
in both the research and clinical environments such as improving camera sensitivity, filter
294
characteristics and keeping irradiance to a minimum.
13
Acknowledgments
296
This work was undertaken as a final year research project by MRTF and was funded
297
internally by the University of Liverpool, School of Dental Sciences and Department of
298
Human Anatomy and Cell Biology.
299
14
Figures
301
[image:14.595.51.527.108.401.2]302
Figure 1. Schematic diagram of the 405 nm lighting rig, comprising of three equidistant
303
indium gallium nitride light emitting diodes (inset: a tooth sample illuminated by the lighting
304
rig).
305
15 307
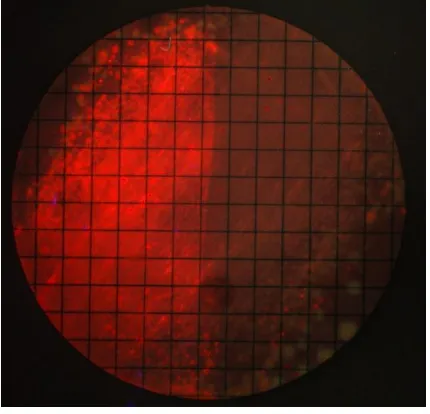
Figure 2. Microcosm filter-membrane biofilm viewed under the QLFD lighting system.
308
Photobleaching was demonstrated on the right-hand side of the membrane in this instance
309
by previously covering the left-hand side of the membrane with aluminium foil whilst 405 nm
310
light at 750 µmol m-2 s-1 (maximum) was incident onto the sample for 25 minutes. The foil
311
was removed immediately before this image was captured.
312
16 314
Figure 3. A representative microcosm biofilm photobleaching experiment following
315
illumination with the QLFD lighting system. The solid line is the mean pixel brightness from
316
adjacent regions of interest within the sample (n=8); the dotted lines show standard
317
deviations.
318
18
Figure 4. Mean red fluorescence observed in microcosm (n=4) (a), P. nigrescens (n=2) (b)
321
and P. intermedia (n=2) (c) filter-membrane biofilms viewed under QLFD lighting. The solid
322
lines represent the mean values with the dotted lines showing standard deviations.
323
19 325
Figure 5. Rates of photobleaching shown as the decrease in fluorescence (ΔF) with time
326
(Δt) within a range of time points; 0 to 1, 1 to 2, 2 to 5, 5 to 10 and 10 to 20 minutes. These
327
data corresponds to Figure 4. Error bars indicate standard deviations.
328
20 330
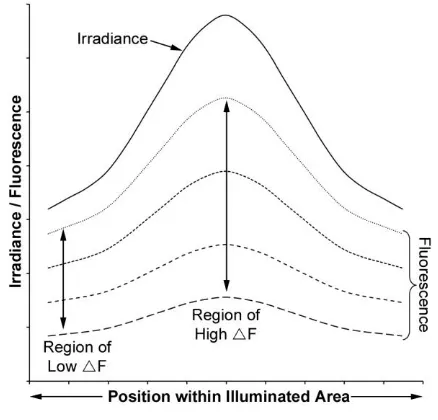
Figure 6. A theoretical model showing differential rates of photobleaching across a sample
331
illuminated with the custom lighting rig. Heterogenous irradiance of the sample is
332
represented by the solid line, whereas the resulting fluorescence values are shown by the
333
dotted lines at four times points. Fluorescence decreases over time and the rate of
334
photobleaching is directly proportional to the incident irradiation.
335
21
References
337
(1)
McGinley KJ, Webster GF, Leyden JJ. Facial follicular porphyrin fluorescence:
338correlation with age and density of Propionibacterium acnes
.
BrJDermatol
339
1980;
102
: 437-441.
340(2)
Myers MB, Cherry G, Bornside BB, Bornside GH. Ultaviolet red fluorescence
341of Bacteroides melaninogenicus
.
Appl Microbiol
1969;
17
: 760-762.
342(3)
Chow AW, Patten V, Guze LB. Rapid screening of Veillonella by ultraviolet
343fluorescence
.
J Clin Microbiol
1975;
2
: 546-548.
344(4)
Lennon AM, Buchalla W, Brune L, Zimmermann O, Gross U, Attin T. The
345ability of selected oral microorganisms to emit red fluorescence
.
Caries Res
346
2006;
40
: 2-5.
347(5)
Coulthwaite L, Pretty IA, Smith PW, Higham SM, Verran J. The
348microbiological origin of fluorescence observed in plaque on dentures during
349QLF analysis
.
Caries Res
2006;
40
: 112-116.
350(6)
Smalley JW, Birss AJ, Silver J. The periodontal pathogen Porphyromonas
351gingivalis harnesses the chemistry of the mu-oxo bishaem of iron
352protoporphyrin IX to protect against hydrogen peroxide
.
FEMS Microbiol Lett
353
2000;
183
: 159-164.
354(7)
Smalley JW, Silver J, Birss AJ, Withnall R, Titler PJ. The haem pigment of the
355oral anaerobes Prevotella nigrescens and Prevotella intermedia is composed
356of iron(III) protoporphyrin IX in the monomeric form
.
Microbiology
2003;
149
:
3571711-1718.
358(8)
Shah HN, Collins DM. Prevotella, a new genus to include Bacteroides
359melaninogenicus and related species formerly classified in the genus
360Bacteroides
.
Int J Syst Bacteriol
1990;
40
: 205-208.
361(9)
Lin DL, He LF, Li YQ. Rapid and simultaneous determination of
362coproporphyrin and protoporphyrin in feces by derivative matrix isopotential
363synchronous fluorescence spectrometry
.
Clin Chem
2004;
50
: 1797-1803.
364(10)
Stokes GG. On the Change of Refrangibility of Light
.
Philosophical
365
Transactions of the Royal Society of London
1852;
142
: 463-562.
366(11)
Tong-Sheng CS-Q, Z.; Wei, Z.; Qing-Ming, L. A quantitative theory model of a
367photobleaching mechanism
.
Chinese Physics Letters
2003;
20
: 1940-1943.
368(12)
Song L, Varma CA, Verhoeven JW, Tanke HJ. Influence of the triplet excited
369state on the photobleaching kinetics of fluorescein in microscopy
.
Biophys J
370
1996;
70
: 2959-2968.
371(13)
Soukos NS, Som S, Abernethy AD, et al. Phototargeting oral black-pigmented
372bacteria
.
Antimicrob Agents Chemother
2005;
49
: 1391-1396.
373(14)
Wilson M. Lethal photosensitisation of oral bacteria and its potential
374application in the photodynamic therapy of oral infections
.
375
PhotochemPhotobiolSci
2004;
3
: 412-418.
376(15)
Koster M, Frahm T, Hauser H. Nucleocytoplasmic shuttling revealed by FRAP
377and FLIP technologies
.
Curr Opin Biotechnol
2005;
16
: 28-34.
378(16)
Bryers JD, Drummond F. Local macromolecule diffusion coefficients in
379structurally non-uniform bacterial biofilms using fluorescence recovery after
380photobleaching (FRAP)
.
Biotechnol Bioeng
1998;
60
: 462-473.
381(17)
Hope CK, Wilson M. Induction of lethal photosensitization in biofilms using a
382confocal scanning laser as the excitation source
.
J Antimicrob Chemother
383
22
(18)
de Josselin de JE, Sundstrom F, Westerling H, Tranaeus S, ten Bosch JJ,
385ngmar-Mansson B. A new method for in vivo quantification of changes in
386initial enamel caries with laser fluorescence
.
Caries Res
1995;
29
: 2-7.
387(19)
Gmur R, Giertsen E, van dV, de Josselin de JE, Ten Cate JM, Guggenheim
388B. In vitro quantitative light-induced fluorescence to measure changes in
389enamel mineralization
.
ClinOral Investig
2006.
390(20)
Ando M, Hall AF, Eckert GJ, Schemehorn BR, Analoui M, Stookey GK.
391Relative ability of laser fluorescence techniques to quantitate early mineral
392loss in vitro
.
Caries Res
1997;
31
: 125-131.
393(21)
McCree KJ. Significance of Enhancement for Calculations Based on the
394Action Spectrum for Photosynthesis
.
Plant Physiol
1972;
49
: 704-706.
395(22)
Patterson GH, Piston DW. Photobleaching in two-photon excitation
396microscopy
.
Biophys J
2000;
78
: 2159-2162.
397(23)
Herzog M, Moser J, Wagner B, Broecker J. Shielding effects and hypoxia in
398photodynamic therapy
.
IntJOral MaxillofacSurg
1994;
23
: 406-408.
399(24)
Rizza V, Sinclair PR, White DC, Cuorant PR. Electron transport system of the
400protoheme-requiring anaerobe Bacteroides melaninogenicus
.
J Bacteriol
401