Phase stability control of interstitial oxide ion
conductivity in the La
1+x
Sr
1-x
Ga
3
O
7+x/2
melilite family
Chris I. Thomas, Xiaojun Kuang, Zengqiang Deng, Hongjun Niu, John B. Claridge and
Matthew J. Rosseinsky*
Department of Chemistry
University of Liverpool, Liverpool, L69 7ZD, UK
Received:
Corresponding author. E-mail: rossein@liverpool.ac.uk.
Abstract The two-dimensional polyhedral anion network melilites La1+xSr1-xGa3O7+0.5x exhibit interstitial oxide
ion conductivity. The solid solution is shown to extend to x = 0.64 and the variation of the conductivity with x is investigated. At high temperatures all of these compounds adopt the typical tetragonal melilite structure. When x > 0.6, cooling below 600 °C results in a reversible phase transition to an orthorhombic structure which reduces the ionic conductivity. Quenching experiments have shown the tetragonal structure has a higher conductivity compared to the orthorhombic structure of the same composition. Short-range order effects associated with this transition exercise an important influence on the composition- and temperature-dependence of the conductivity.
Introduction
Solid Oxide Fuel Cells (SOFCs) have particular advantages over other types of fuel cell such as modularity and fuel flexibility1 with the ability to use a range of fuels from high purity H2 to readily
available hydrocarbons.2 However current SOFCs require high temperatures e.g. above 700 °C for Yttria stabilized zirconia (YSZ)3 or above 500 °C for gadolinium doped cerium oxide (CGO)4 systems
for operation. At these temperatures the ions become mobile enough for efficient operation of the cell but the thermal expansion and reactivity of the fuel cell components becomes problematic5. For SOFCs to become competitive with current technology, oxide ion electrolytes with specific conductivities exceeding 10-2 Scm-1 at low (~ 500 °C) temperatures are required,6 motivating the search for materials
displaying new combinations of carrier and structure type.
Recently the two-dimensional complex anion network melilites7, 8 La1+xSr1-xGa3O7+0.5x have been
shown to exhibit interstitial9 oxide ion conduction of 0.02-0.1 S/cm at x = 0.54 over the 600-900 °C temperature range – this is unusual, as interstitials are usually found in isolated anion rather than network structures. Rozumek and co workers present data from x = -0.15 to x = 0.60 while Kuang and coworkers9 suggest that x = 0.6 is the maximum value of x which will retain the parent structure with disordered oxide ion interstitials. The x = 0 parent material LaSrGa3O7 is tetragonal (T) (atetra =8.056 Å,
ctetra=5.333 Å 10 (Figure 1)). La and Sr occupy the eight coordinate A site while the smaller Ga occupies
two distinct tetrahedral sites (3-connected, with a non-bridging terminal oxide, and 4-connected with all oxides bridging to neighboring tetrahedra) in a corner-shared tetrahedral 2D layer with a distorted pentagonal tunnel which is occupied by the interstitial oxygen charge carriers required for charge balance when x > 0. Above and below the center of each tunnel are the A sites (Figure 1). This paper addresses the limits on the extent of La substitution for Sr in single-phase materials and thus on the interstitial anion carrier density and ionic conductivity. The highest carrier concentrations produce long-range static structural ordering of the interstitials which strongly influences the ionic transport.
(a) (b)
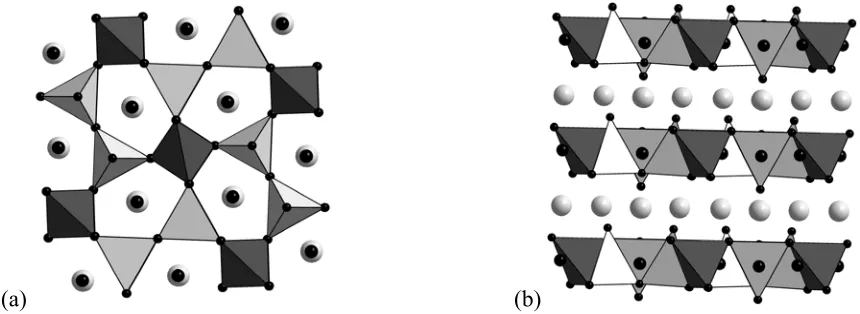
Figure 1. The melilite structure of LaSrGa3O7 showing the two types of GaO4 tetrahedra (dark grey
4-connected, light grey/white 3-connected). Light grey spheres show the La/Sr sites and the black spheres show oxygen. The spheres for the interstitial oxygen sites are larger than those for the framework oxygens. In (a) the view is down the c axis showing the Ga tetrahedra and the pentagonal tunnels. The view in (b) along [110] shows that the interstitial oxygen sits in the center of the Ga layers with La/Sr cations above and below.
Experimental:
Synthesis and processing: Phase relations of La2O3-SrO-Ga2O3 in the La1+xSr1-xGa3O7+0.5x series
were investigated by solid state reaction using La2O3 (99.999%, Alfa Aesar), SrCO3 (99.995%, Aldrich)
and Ga2O3 (99.999%, Alfa Aesar) as starting materials, which were mixed in ethanol and calcined at
1200 °C for 12 h. Due to La2O3 absorbing water and CO2 at ambient temperatures the La2O3 powder was
stored in a furnace at 950 °C prior to weighing. After regrinding, the powders were uniaxially pressed into pellets, placed on platinum foil (99.95%, Goodfellow Ltd), in covered alumina crucibles (Almath Crucibles Ltd 99.8 %) and fired at 1400 °C (x = 0-0.54 ) or 1350 °C (x = 0.56-0.64 ) for 12 h. To
temperatures than stated above are used a melilite phase is observed as the main phase but a perovskite phase is also visible in the powder XRD data.
Pellet samples with > 90% of the theoretical density for electrical measurements were made via cold-isostatic pressing (CIP) with 206.85 MPa pressure after being calcined at 1200 °C for 12 h, followed by the final firing at 1350 °C for 12 h.
Quenching experiments were carried out by removing the alumina crucible from the furnace at 1350 °C and tipping the pellet out onto a block of aluminium at room temperature.
Characterization: The phase purity was checked by powder X-ray diffraction data with a Panalytical X’pert Pro Multi-Purpose X-ray diffractometer (Co Kα1 radiation λ = 1.78901Å) collected
at ambient temperature. Silicon was added as an internal standard to refine the cell variation with composition. For the time resolved study a sample of metastable quenched T structured La1.64Sr0.36Ga3O7.32 in a 0.5 mm outside diameter amorphous fused silica capillary (Mark-Röhrchen
quarzkapillaren) was measured at station I11 of the Diamond Light Source. Data were collected step-wise over 1.821-141.953 2θ (λ = 0.82545 Å) in sequential five minute datasets collected at 400 °C. Using the same wavelength, a separate capillary was heated from 300 °C to 600 °C. Five minute datasets were collected over the same 2θ range in 5 °C steps with a ramp rate of 5 °C per minute between scans. At 600 °C a 20 minute scan was taken of the sample at the end of the heating protocol.
Conductivity Measurement: Ac Impedance Spectroscopy (IS) measurements in air were performed with a Solartron 1255B Frequency Response Analyzer coupled to a Solartron 1287 electrochemical interface over the 10-2-106 Hz frequency range for measurements in the 350-980 °C range.
rate was set at 5 °C per minute and the wires used to connect the pellet to the Solartron leads were Engelhard CPPT platinum wire.
For each sample the pellet being measured was heated to 950 °C and left to dwell for an hour before the measurement took place. Measurements were then taken every 50 °C down to 350 °C with the measurement for each temperature only occurring after the sample had been left for 1 hour at that temperature to ensure the sample had equilibrated.
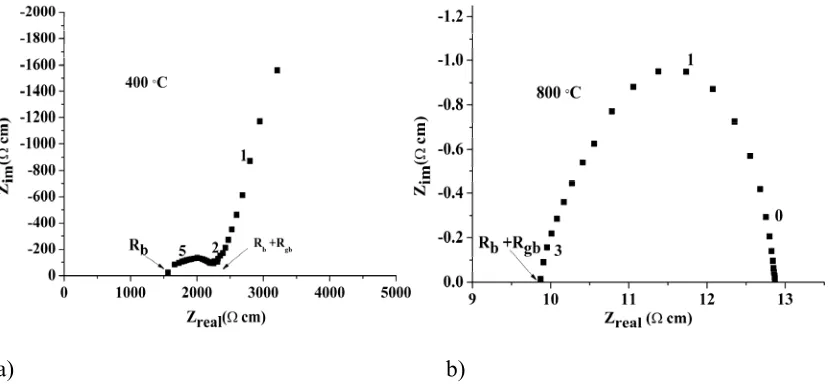
The bulk and the grain boundary responses at higher frequencies overlap to exhibit part of an asymmetric semicircular arc. The intercept of the semicircular arc at low frequency was extracted as the total resistivity Rb + Rgb. Above 400 °C, the electrode response dominated the impedance data and
gradually collapsed to a semicircular arc, giving two arcs in the impedance plot. The high frequency intercept of the second arc was taken as total resistivity Rb + Rgb while the high frequency intercept of
the first arc was taken as the bulk resistivity Rb. This allows the bulk and grain boundary resitivities to
be separated over the region where the two arcs are visible (Figure S4). As the temperature is increased the arc from the grain boundary response vanishes and only one semicircular arc from the electrode response was seen with the high frequency intercept being taken as the total resistivity Rb + Rgb..
[image:5.595.65.482.482.674.2]a) b)
Figure 2 Complex impedance plots of La1.6Sr0.4Ga3O7.3 at 400 ˚C (a) and 800 ˚C (b). The numbers in
Measurement of the conductivity of a quenched T sample of La1.64Sr0.36Ga3O7.32 on heating from
200 °C to 500 °C and subsequent cooling to 200 °C was performed to compare the conduction behaviors of tetragonal (T) and pseudo-orthorhombic phase (O) on materials with same composition. The measurement was taken in 25 °C intervals over the entire temperature range with one hour equilibration time at each temperature. For the quenched samples of La1.64Sr0.36Ga3O7.32 a Solartron
1296 dielectric interface was used instead of the Solartron 1287 electrochemical interface for measurements over the 10-2-106 Hz frequency range and the temperature range 200 °C – 500 °C on heating and cooling cycles. Instead of platinum electrodes, silver conductive paint which dries in air was used (Agar G3790) to allow for measurement to be carried out without the need to sinter electrodes at high temperatures. Note that at each temperature the samples dwell for 1 hour, so the points for both cooling post 500 °C and for the furnace cooled sample will be single phase O. Further measurement on one more heating and cooling cycle from 200 °C to 500 °C after the conversion from the T phase to the O phase described in the text did not show significant change in the conductivity, suggesting the O phase is stable to thermal cycling.
The a.c. conductivity as a function of partial pressure of oxygen (pO2) (monitored by a YSZ
potentiometric sensor) was measured at 600 °C over a pO2 range of 1-10-22 atm. The pO2 value was
controlled over 1-10-4 atm pO2 range by dilution of O2 with Ar, for 10-4-10-22atm by using mixed 1%CO
in Ar and 1% CO2 in Ar. The dwell time ranged from 5 – 24 h (~5-8 h for pO2 >10-4 and 12-24 h for pO2
<10-4to allow equilibration of the samples with the gas environment at each point.
Diffuse Reflectance: The band gap of LaSrGa3O7 was measured on a polycrystalline sample using
diffuse reflectance spectroscopy. Reflectance data were collected on a Perkin Elmer LAMDA 650 S UV/Vis spectrometer using BaSO4 reflectance standards and converted to absorbance (using
Infrared spectroscopy (IR): The IR measurement was carried out on a Perkin Elmer Spectrum 100 with ATR.
Thermo gravimetric analysis (TGA): The TGA measurement was carried out using a TA Instruments SDTQ600
Energy-dispersive X-ray analysis (EDS): The EDS was carried out using a JEOL 2000FX transmission electron microscope operated at 200 kV.
Results
Ceramic synthesis with slight (< 3% depending on x, see experimental details) excess Ga2O3 affords
the La1+xSr1-xGa3O7+0.5x (x ≤ 0.64) samples studied here (x = 0.65 and x = 0.67 were also studied but did
not afford single phases, instead forming a mixture of melilite and Sr-doped LaGaO3 (LSG). The
[image:7.595.55.289.458.593.2]powder X-Ray (XRPD) patterns (Figure 3) for x < 0.6 can be indexed using the T cell of the parent phase. However, for x > 0.6, the splitting of the h,k ≠ 0 tetragonal reflections requires indexing with a pseudo-orthorhombic (O) cell (aorth ≈ borth ~ √2atetra, c = ctetra).
Figure 3. XRD patterns of La1+xSr1-xGa3O7+x/2 (x = 0.56. 0.58, 0.6, 0.62 and 0.64).
(a)
[image:8.595.59.314.84.410.2](b)
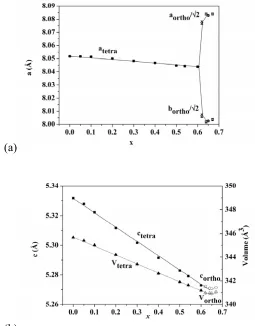
Figure 4. (a)a and blattice parameters (b) c parameter and unit cell volume of La1+xSr1-xGa3O7+x/2 , x =
0 to x = 0.67. Data for x < 0.6 are from 9 , for x > 0.6 this work.
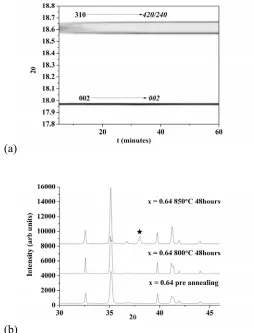
Variable temperature powder X-ray diffraction data for La1.64Sr0.36Ga3O7.32 ( Figure S3) shows the O
to T transition takes place at 565 oC on heating. This transition can also be observed in the conductivity data as a change in the gradient (activation energy) of a ln(σT) versus 1/T plot (Figure 8). An in-situ PXRD scan at 600 °C was fitted using the LeBail method shown in Figure 5 (a) showing that at 600 °C
(a)
[image:9.595.55.302.85.415.2](b)
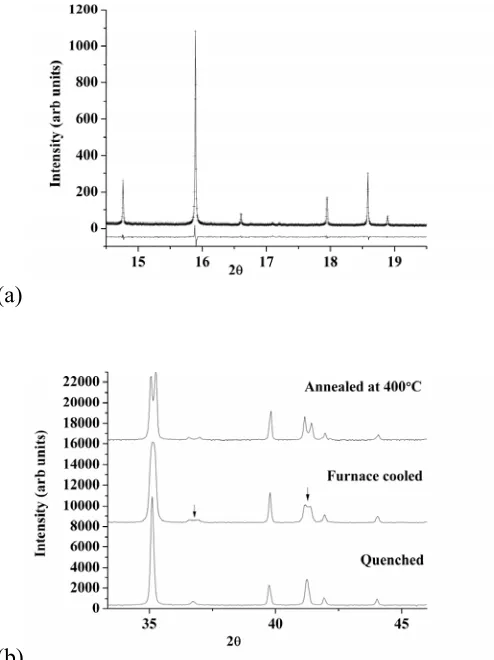
Figure 5. (a)LeBail fit of La1.64Sr0.36Ga3O7.32 at 600 ˚C using the tetragonal space group P4 21m (λ=
0.825451Å, Rwp =7.965%)(b)La1.64Sr0.36Ga3O7.32 after quenching, furnace cooling and annealing for 12
hours at 40O ˚C. The arrows indicate the tetragonal peaks in the pseudo-orthorhombic dominated furnace-cooled sample.
Pure T La1.64Sr0.36Ga3O7.32 can be prepared by quenching to room temperature from the high
temperature T phase stability region at 1350 °C, with the mixed O and T phases accessed by furnace cooling at 15 °C min-.1 . The pure O phase is produced by annealing either quenched T or furnace
(a)
[image:10.595.59.313.84.417.2](b)
Figure 6. (a) Diffraction from La1.64Sr0.36Ga3O7.32 at 400 ˚C showing the transition from metastable T
to stable O phase. T Miller indices in bold and O in italics. (b) XRD patterns of La1.64Sr0.36Ga3O7.32
before annealing, after annealing at 800 ˚C for 48 hours and after 850 ˚C for 48 hours. Black star shows the formation of strontium doped lanthanum gallate (LSG) perovskite.
The synthesized samples are stable to 800 ºC in air (Figure 6 (b)). For x ≥ 0.4, prolonged annealing above this temperature (for periods longer than the impedance measurements described later – all materials reported were examined by XRD post-measurement to ensure their single phase nature was retained) causes the melilite to partially decompose with formation of the Sr-doped LSG perovskite (Figure (6b), black star) and Ga2O3 as detailed in SI (Figures S9, S10), rendering conductivity
doping levels. The instability with respect to LSG only occurs over a limited temperature range – reheating the phase separated mixture at 1350 °C affords the initial melilite, suggesting a complex
sequence of phase stability (Figure S11).
Impedance data from the La1+xSr1-xGa3O7+0.5x materials (Figures 2a & 2b) at < 400 °C exhibit a
significant Warburg electrode11, 12 response with an associated large capacitance (>10-7 F cm-1) in the
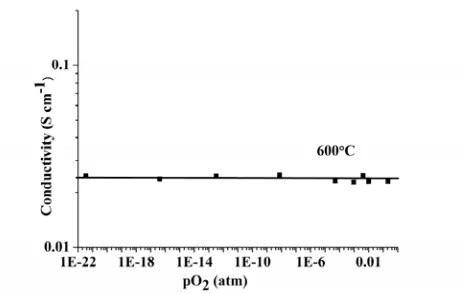
low frequency range (<10 Hz), which is characteristic of ionic conduction with partially blocking electrodes. The total conductivity of La1.64Sr0.36Ga3O7.32 at 600 °C is independent of oxygen partial
pressure over the 1-10-22 atm range (Figure 7), as found earlier for La1.54Sr0.46Ga3O7.27 9 showing that
there is pure ionic conductivity across the entire series La1+xSr1-xGa3O7+x/2 to the solid solution limit x =
0.64. Post measurement XRD of La1.64Sr0.36Ga3O7.32 (Figure S12) shows that the sample remains single
[image:11.595.66.301.407.554.2]phase.
Figure 7. pO2 dependence of the total conductivity of La1.64Sr0.36Ga3O7.32 at 600 ºC.
The band gap of LaSrGa3O7 (measured by diffuse reflectance Figure S7) is 5.0 eV, consistent with the
absence of an intrinsic electronic contribution over the entire temperature range measured.
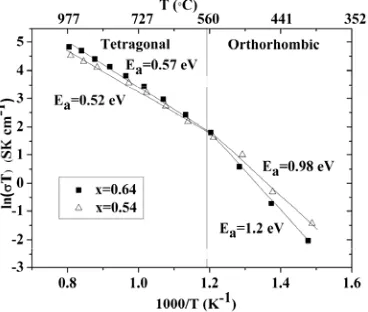
The transition at 565 °C to the O structure on cooling in La1.64Sr0.36Ga3O7.32 produces a sharp
Figure 8. Conductivity of La1.64Sr0.36Ga3O7.32 (black squares, T at high temperature, O at low
temperature) and La1.54Sr0.46Ga3O7.27 (triangles, T at all temperatures). The lines show the two regions
with different activation energies. The post-measurement XRD is given in Figure S5a.
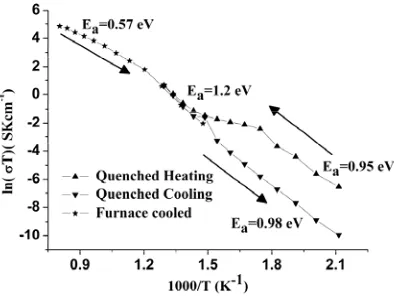
The total conductivity (Figure 9) of a quenched La1.64Sr0.36Ga3O7.32 T phase pellet on heating over the
200-300 °C temperature range is approximately two orders of magnitude higher than that on cooling through this range after heating to 500 °C to form the ordered O phase (e.g. 1.55 x 10⁻⁴ Scm-1 on heating
(T) against 5.5 x 10⁻⁶ Scm-1 cooling (O) at 300 °C), consistent with the T phase corresponding to disordered and the O phase to ordered carriers. The activation energy (0.95eV) for the quenched metastable T La1.64Sr0.36Ga3O7.32 over 200-300 °C measured on heating (Figure 9), compares to 0.85eV
for tetragonal La1.54Sr0.46Ga3O7.27 at low temperature (250 °C – 400 °C ) reported by Kuang and to 0.98
Figure 9. The conductivity of quenched La1.64Sr0.36Ga3O7.32 during thermal cycling is given by
triangles. Initially the sample is tetragonal converting to orthorhombic on heating above 400 ºC, on cooling this sample retains the orthorhombic structure. The conductivity of a second sample of La1.64Sr0.36Ga3O7.32 which wasfurnace cooled from 1350 ºC is also given for comparison and denoted by
stars. This material adopts the tetragonal structure above 565 ºC below, which it reverts to the orthorhombic structure. Post-measurement XRD of the furnace cooled sample (stars) is shown in Figure S5a post measurement XRD of the quenched sample (triangles) is shown in Figure S5b.
Discussion
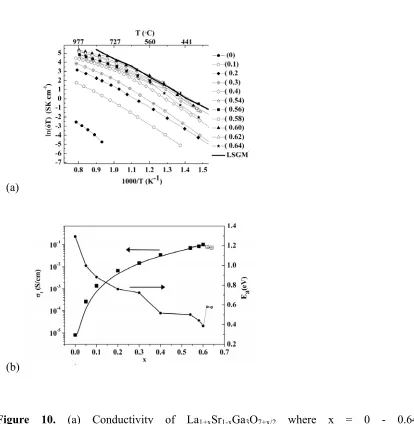
The total conductivity versus temperature in air for 0 ≤ x ≤ 0.64 is shown in Figure 10 (a) with La0.8Sr0.2Ga0.83Mg0.17O2.815 13 (LSGM) for comparison. The conductivity at x = 0.54 is approximately
three orders of magnitude greater than the parent material. The total conductivity of x = 0.6 La1.6Sr0.4Ga3O7.3 at 500 °C is 6.8 x 10⁻³ Scm-1, which compares with 4 x10⁻³ Scm-1 for the bulk
conductivity of Mg-doped La10Si6O27, 14 3.2 x 10⁻⁴ Scm-1 for the bulk conductivity of Al-doped
La10Ge6O27 ,15 5 x 10⁻³ Scm-1for the total conductivity of LSGM (La0.8Sr0.2Ga0.83Mg0.17O2.815) 13 and
0.004-0.01 Scm-1 for the total conductivity of Ce0.9Gd0.1O1.95.4, 17, 18 Above 600 °C and below 400 °C,
400-600 °C range, the x = 0.58 and x = 0.6 compositions have slightly higher conductivity than LSGM (Figure 10 (a)).
(a)
[image:14.595.57.471.152.576.2](b)
Figure 10. (a) Conductivity of La1+xSr1-xGa3O7+x/2 where x = 0 - 0.64; LSGM is
La0.8Sr0.2Ga0.83Mg0.17O2.815 .13 In Figure 10 (a) x = 0.64 and the furnace cooled data in Figure 9 are the
same measurement. (b) Conductivity and activation energy of La1+xSr1-xGa3O7+x/2 at 800 ºC versus x.
The low temperature stable forms are indicated by filled (T) and empty (O) symbols. The black curved line for the conductivity data is a fit to σt = σ0 +ACoin where Coi = number of interstials per formula unit
: σo = 8.01x10⁻⁶ Scm-1 A=2.2(7) n=2.7(2). This line is presented as a guide to the eye. The post
There is a transition (Figure 8) in the conductivity of the x = 0.54 material, where the T phase is long-range stable at all temperatures, at a similar temperature to that found for the electrical and long-long-range structural transition in the ambient temperature O phase x = 0.64 material. The activation energy increases from 0.52 eV to 0.98 eV at this point – both activation energies are lower than those found at x = 0.64 which is O at low T. The interstitial carrier ordering which condenses into a long-range structural phase transition to the O phase beyond x = 0.6 thus exercises a clear influence, assigned to short-range order (SRO), on the temperature dependence of the conductivity of compositions which border the onset of the transition, suggesting that the same type of carrier association is happening at this temperature in both x = 0.54 and x = 0.64 materials but that it is short-range only at x = 0.54. Above the T/O structural phase transition, the more highly doped x = 0.64 material is more conducting, whereas below the ordering transition, the x = 0.54 material, which remains T with long-range carrier disorder, is more conducting. This shows the more pronounced effect of the long-range carrier ordering on the ionic transport behavior.
The variation of the conductivity with dopant concentration x is thus complicated by the effect of the long-range ordering into the O phase at high x and the associated impact of SRO in the T phases before the structural phase transition occurs with increasing x. The total conductivity at 800 °C (Figure 10 (b))
of La1+xSr1-xGa3O7+0.5x increases as the activation energy decreases to x = 0.6, which is the stability
stability limit of the T phase, despite the higher carrier concentration in the O phase even at O compositions above the temperature of the structural phase transition. Below 565 °C, the maximum conductivity is reached at lower x, for example at 450 °C, x = 0.56 (see SI Figure S6) has the highest
conductivity, because the interstitial carrier order associated with the O phase reduces the large x, low temperature conductivity. Thus at all temperatures the highest conductivities are found in materials that do not show the O structural ordering of the carriers. Carrier-dopant association associated with symmetry lowering has been observed in the isolated anion interstitial system La10(GeO4)6-x(GaO4)xO
3-x/2 where the conductivity decreases above x = 0.125. 19
The rate of increase in conductivity with x (Figure 10 (b)) decreases as x increases, consistent with carrier ordering or mobility blocking associated with the T/O transition. This contrasts with the linear behavior observed for Ba1-xLaxIn2O5+x 20and may be associated with short range order that acts as a
precursor to the long range order that causes the T to O transition.
The diffusion coefficient per carrier, D, can be computed from the equation
D= σ /[(nq2)/(kT)]
where n is the number of mobile species per cm3of material and q the charge of the mobile species. In this case the mobile species are the oxide interstitials.Figure 11 (a) shows D over the 400-950 °C range. At 950 °C the diffusion coefficients are of the order of 10-6 to 10-5 cm2s-1 (with a maximum of
1.6 x 10⁻⁵ cm2s-1 at x = 0.6) which compares with conductivity-derived D of 1 x 10⁻⁶ cm2s-1 for
La0.9Sr0.1Ga0.8Mg0.2O3 21 (validated with tracer diffusion). The diffusion coefficient at 800 ºC (Figure 11
(b))increases until x = 0.6, with a 13-fold increase from x = 0.1 to the maximum at 0.6. The decrease of conductivity at higher interstitial content (x = 0.62/0.64) correlates with the reduced diffusion coefficient and Ea increase, associated with short-range structural ordering premonitory to the O phase
disordering is also known to produce a threefold increase in conductivity at the fluorite pyrochlore boundary in Ln2Zr2O7.24 In LSGM 13 vacancy carrier trapping premonitory to long-range ordering
identified in electron diffraction is proposed to impact the conductivity.
(a)
[image:17.595.63.328.162.511.2](b)
Figure 11. (a) Diffusion coefficients of La1+xSr1-xGa3O7+x/2 (x = 0-0.64) (b) Diffusion coefficient versus
x at 800 ºC.
Conclusions
The solid solution range in La1+xSr1-xGa3O7+0.5x extends to x = 0.64. The high interstitial oxide content
phase transition at temperatures above the transition, and the associated effect on the temperature and dopant density dependence of the conductivity.
Acknowledgment. We thank EPSRC (EP/C511794/1) and the EU (European Research Council) for support and the STFC for access to Diamond, where we thank Dr. C. Tang, Dr. J .Parker and Dr. S. Thompson for assistance on the I11 diffractometer.
Supporting Information Available: Variable temperature powder X-ray diffraction data, further discussion of the impedance data, Post measurement XRD patterns, Conductivity versus x data at 450°C, Diffuse Reflectance graph and XRDs from annealing experiments. This materials is available free of charge via the Internet at http://pubs.acs.org.
References
(1) K. Eguchi, R. Kikuchi, T. Takeguchi, Elec. Soc. S. 2003, 2002-2026, 38-52. (2) N. Q. Minh, J. Am. Ceram. Soc. 1993, 76, 563-588.
(3) D. J. L. Brett, A. Atkinson, N. P. Brandon, S. J. Skinner, Chem. Soc. Rev. 2008, 37, 1568-1578. (4) B. C. H. Steele, Solid State Ionics. 2000, 129, 95-110.
(5) A. Lashtabeg, S. J. Skinner, J. Mater. Chem. 2006, 16, 3161-3170. (6) B. C. H. Steele, A. Heinzel, Nature 2001, 414, 345-352.
(8) M. Rozumek, P. Majewski, L. Sauter, F. Aldinger, J. Am. Ceram. Soc. 2004, 87, 662-669.
(9) X. Kuang, M. A. Green, H. Niu, P. Zajdel, C. Dickinson, J. B. Claridge, L. Jantsky, M. J. Rosseinsky, Nat. Mater. 2008, 7, 498-504.
(10) M. Steins, W. Schmitz, R. Uecker, J. Doerschel, Z. Krist-New. Cryst. St. 1997, 212, 76.
(11) J. R. Macdonald, Impedance Spectroscopy Emphasizing solid materials and systems, Wiley, New York, USA 1987.
(12) J. R. Macdonald, Ann. Biomed. Eng. 1992, 20, 289-305.
(13) K. Q. Huang, R. S. Tichy, J. B. Goodenough, J. Am. Ceram. Soc. 1998, 81, 2565-2575. (14) H. Yoshioka, Chem. Lett. 2004, 33, 392-393.
(15) L. Leon-Reina, E. R. Losilla, M. Martinez-Lara, M. C. Martin-Sedeno, S. Bruque, P. Nunez, D. V. Sheptyakov, M. A. G. Aranda, Chem. Mater. 2005, 17, 596-600.
(16) G. Dotelli, C. M. Mari, R. Ruffo, R. Pelosato, I. N. Sora, Solid State Ionics. 2006, 177, 1991-1996.
(17) J. B. Goodenough, Ann. Rev. Mater. Res. 2003, 33, 91-128.
(18) T. S. Zhang, J. Ma, H. Cheng, S. H. Chan, Mater. Res. Bull. 2006, 41, 563-568. (19) E. Kendrick, P. R. Slater, Mater. Res. Bull. 2008, 43, 3627-3632.
(20) K. Kakinuma, H. Yamamura, H. Haneda, T. Atake, Solid State Ionics 2001, 140, 301-306. (21) T. Ishihara, J. A. Kilner, M. Honda, Y. Takita, J. Am. Chem. Soc. 1997, 119, 2747-2748. (22) D. K. Hohnke, J. Phys. Chem. Solids. 1980, 41, 777-784.
(24) H. Yamamura, H. Nishino, K. Kakinuma, K. Nomura, Solid State Ionics. 2003, 158, 359-365. (25) H. W. Eng, P. W. Barnes, B. M. Auer, P. M. Woodward, J Solid State Chem 2003, 175, 94-109. (26) R. Aleksiyko, M. Berkowski, J. Fink-Finowicki, P. Byszewski, R. Diduszko, E. Kowalska, P. Soc. Photo-Opt. Ins. 2001, 4412, 50-54.
(27) J. Ahman, G. Svensson, J. Albertsson, Acta Crystallogr. C. 1996, 52, 1336-1338. (28) S. Li, F. Schonberger, P. Slater, Chemical Communications 2003, 2694.
(29) F. Schonberger, E. Kendrick, M. S. Islam, P. R. Slater, Solid State Ionics 2005, 176, 2951. (30) K. H. Lee, J. H. Kim, H. L. Kim, S. Kim, H. L. Lee, Japanese Journal of Applied Physics 2005,
44, 254.
Chris I. Thomas, Xiaojun Kuang,
Zengqiang Deng, Hongjun Niu, John B.
Claridge and Matthew J. Rosseinsky
Chem. Mater.