8-28-1955
Iodato-silver complexing equilibria
James J. RenierIowa State College Don S. Martin Iowa State College
Follow this and additional works at:http://lib.dr.iastate.edu/ameslab_iscreports Part of theRadiochemistry Commons
This Report is brought to you for free and open access by the Ames Laboratory at Iowa State University Digital Repository. It has been accepted for inclusion in Ames Laboratory ISC Technical Reports by an authorized administrator of Iowa State University Digital Repository. For more information, please [email protected].
Recommended Citation
Abstract
Solubilities of silver iodate in aqueous solutions containing various concentrations of lithium iodate have been measured for 25.0°C., 35.0°C. and 50.0°C. by means of an improved radioassay technique for silver activity. They have also been measured for the same temperatures in aqueous solutions containing various proportions of lithium iodate and lithium perchlorate. In the latter experiments, the ionic strengths of all equilibrium solutions were fixed at a value of 1.00 M.
Keywords Ames Laboratory Disciplines
Chemistry | Radiochemistry
'
1.
Physical Sciences Readin.c Room.
"'
."UN CLASS I FlED
Subject Category: CHEMISTRY
UNITED STATES ATOMIC ENERGY COMMISSION
lODATO- SILVER COMPLEXING EQUILIBRIA
By
James J. Renier Don S. Martin
August 28, 1955
Ames Laboratory Iowa state College Ames, Iowa
. . . - - - L E G A L NOTICE
This report was prepared as an account of Government sponsored wark. Neither the United States, nor the Commission, nor any person acting on behalf of the Commission!
A. Makes any warranty or representation, express or implied; with respect ta the ac-curacy, completeness, or usefulness of the information contained in this report, or that the use of any Information, apparatus, method, or process disclosed In this report may not in-fringe privately owned rights, or
B. Assumes any liabilities with respect to the use of, or for damages resulting from the use of any information, apparatus, method, or process disclosed in this report.
As used in the above, "person acting on behalf of the Commission" includes any em-ployee or controctar of the Commission to the extent that such emem-ployee or contractor prepares, handles or distributes, or provides access ta, any information pur5uant to his em-ployment or contract with the Commission.
This report has been reproduced directly from the best available copy.
Printed in USA, Price 35 cents. Available from the Office of Technical Services, Department of Commerce, Wash-ington 25, D. C.
I. INTRO~UCTION
II. EXPERIMENTAL A. Material
1. Reagents
TABLE OF CONTENTS
2. Analytical standards
3.
Radioactive silver4.
Tagged silver iodate B. Analysesc.
Apparatus D. ProcedurePage 1
5 5 5 5 6 6 7
13
19
III. RESULTS 20
A. Results from the Solubility
Determina-tions 20
B. Description of the Complexing Equilibria 23 C. Determination of the Equilibrium
Solu-bility Product Constants 30
D. Evaluation of the Formation Equilibrium
Constants 30
E. Thermodynamic Properties 36
IV. DISCUSSION 38
V. SUMMARY 40
*
IODATO-·SILVER COMPLEXING EQUILIBRIAby
James J. Renier and Dons. Martin, Jr.
ABSTRACT
Solubilities of silver iodate in aqueous solutions con-taining various concentrations of lithium iodate have been measured for 25.0°C., 35.0°C. and 50.0°C. by means of an
improved radioassay technique for silver activity. They have also been measured for the same temperatures in aqueous
solutions containing various proportions of lithium iodate
and lithium perchlorate. In the latter experiments, the ionic strengths of all equilibrium solutions were fixed at a value of 1.00 M.
The refined radiotracer method was based upon an electro-deposition procedure for mounting samples for counting.
Samples of the equilibrium solution phases from the equ ili-brated mixtures were carefully added to portions of st~ong nitrj_c acid solutions which contained a ~redetermined
amount of silver carrier (usually 10 mg.). To insure
complete exchange between the tracers and the carriers~ the solutions were evaporated to dryness. The residues were subsequently dissolved in ammoniacal cyanide plating baths and a current of 0.2 amp. was passed through the resulting solutions for a period of thirty-five minutes. The silver that was uniformly deposited was determined gravimetrically and was counted to determine its activity. From these data the activities corresponding to 100 per cent recovery of the carriers were computed. The applications of corrections for self-absorption and radioactive decay converted the
observed activities to ones which were proportional to the tracer concentrations in the various aliquots of the equili-brium solution phases. A knowledge of the specific activity
*
This report is based on a Ph.D. thesis by JamesJ.
Renier subm5.tted August.o 1955 to Iowa State College, Ames., Iow·a. 'I'his work \;Ja s done under contract with the Atomic Ene1~gyof the silver used in the experiments made the radioassay complete.
A series of experiments performed to test the prccedure for sampling of equilibrated mixtures llias. been discussed at some length. The results have indicated that an evalua-tion of the method used to obtain equilibrium solution samples should form an integral part of all solubility
measure-ments in which radiotracers are employed.
The solubility data have been interpreted in terms of
chemical equilibria which involve the species Ag+, Agi03 (eq.),
and Ag(ro
3
)a-
·
Equilibrium solubility product constantsfor Agi03(s) in aqueous solution were obtained from the
results of measurements performed in solutions for which
ionic strengths were low and variable. The values of these quantities for 25.0°C., 35.0°C. and 50.0°C. were observed to be (3.0 + 0.15) x 10-8, (6.3
±
0.3) x 10-~ and(17.4 ± 1.0) x lo-7 respectively. Equilibrium formation
constants for the monoiodatosilver and the diiodatosilver
complexes were estimated from the measurements performed for solutions of constant ionic strength. At 25°C., 35.0°C. and 50.0°C. the values determined for the monoiodatosilver species were 4.26 ± 2.62, 6.34 ± 1.86 and 9.09 ± 1.16
respectively, while those for the diiodatosilver species were 79.4 ± 5.2, 66.4
±
4.3 and 41.1 ± 3.0 respectively. It was observed that representations of the experimental data obtained for low, variable ionic strengths were adequately reproduced by means of suitable equations and the equilibrium formation constants obtained for constant ionic strength.From the solubilities and their temperature coefficients thermodynamic quantities for the iodate complexes have also been computed. The entropy change calculated for the
reaction to form Agi03 (aq.) was 20.3
±
14.7 e.u. and that calculated for the reaction to form Ag(I03)2- was -8.50 + 2.55 e.u. These values were found to be in fair agreement with a semi-empirical formulation.The thermodynamic description of the silver
iodate-iodate ion-water system that was obtained was not definitive ~ in an absolute sense in that iodate ion appeared to be a
very weak complexing agent for silver and the monoiodatosilver species possessed a low stability which was difficult to
I. INTRODUCTION
A class of chemical systems which has not been exten-sively investigated by conventional chemical analysis is one composed of a sparingly soluble salt and an aqueous solution of a soluble salt containing a common anion. The nature of this category requires that the common-ion effect be operative. The limited applicability of ordina~y
techniques is primarily due to the reduced solubility of the sparingly soluble salt. To ascertain the various equili-bria established~ a means of obtaining accurate data in
the concentration range below lo-5 M must be available. At the present time~ a radiotracer technique is the method which most generally can meet this stringent requirement.
The fundamental.operations of the radiotracer technique are two in number. The cation of the saturating salt
is tagged with a radioactive nuclide. A solution of a
soluble salt containing the common anion is equilibrated with the tagged salt and the total concentration of the free
and c~mplexed cation is determined radiochemically.
In procedures employing radiotracers for radioassay purposesp certain precautions must be taken in order to insure consistent analyses. The accuracy attainable is usually governed by the reproducibility of the samp~e pre-paration and counting technique. To achieve a precise radioassay of the equilibrium samples~ the active material must be deposited and mounted in such a way that the geomet~y
and backscattering are uniform for all samples. If the thickness of an active deposit varies~ a self-absorption curve mlst be obtained for use as a reference standard.
Counting rates should be held to values at which coincidence losses are unimportant. All samples should be counted for a length of time sufficient to insure good statistics. The g1•eatest erl"Or may be encountered if a representative sample of the equilibrium solution phase were not obtained. Zimmerman
(1)
has written an excellent review on the lattersubject. ·
The application of radioactivity to the determination of solubility product constants was originally demonstrated by Paneth and Hevesy (2). They used Radium D to measure the solubility product of lead chromate. This measurement was subsequently refined by Hevesy and Rona (3) using
and particle accelerators have provided useful tracer& for many of the elements. Ishibashi and Funahashi
(4)
,
rerla et al.(5
$6
)
$
Ruka and Willard(7)$
and many others'b-13)
have-raaioc.h~mically determined the solubilit ies of very insoluble salts in solutions of various compositions.Neiman et
al. (14)
and Jordan(15)
have recently suggested additlonalmethods of approach. Relatively few investiga-tors have used radiotracers to resolve systems containing a range of common ion concentrations. Rare earth oxalate ion equilibria were studied by Crouthamel and Martin{l6p
17).
Work on the thorium iodate-iodate ion-water system was performed by Fry et al.(18).
The silverchloride-chloride ion-water systemwas examined by Barney et al.
(19)
at one temperature. Martin and Jonte (20) in anotnerinvestigation, obtained data which indicated the existence of AgCl (aq.) and Ag(Cl)2- species. They reported thermo-dynamic properties obtained from the solubility and its temperature coefficient. These species, and higher chloro-complexes of silver were reported by Leden and Berne
(21).
Agreement between the results of the separate radiochemical investigations of the silver chloride systems was poor. The silver bromide-bromide ion-water system, and the silverazide .. azide ion--water system have also been r::ltudied by Y..~~d.~;n et al. (22~23) in this manner. Certainly possibilities exist for- improvement and further application of the met;hod.
The wor>k presented in thi.s report is aimed at o''>tEllni.ng
a definitive thermodynamic description of the silver
iodate-iodate ion-water system. Included within the obj~otive ia
t e st~dy of the iodate-silver oomplexing equilibria. An intelligible achievement of this end is impoesible unless existing tracer ·techniques are i~proved . Consequently$ an additional objective is of necessity the refinement of the radiochemical procedure.
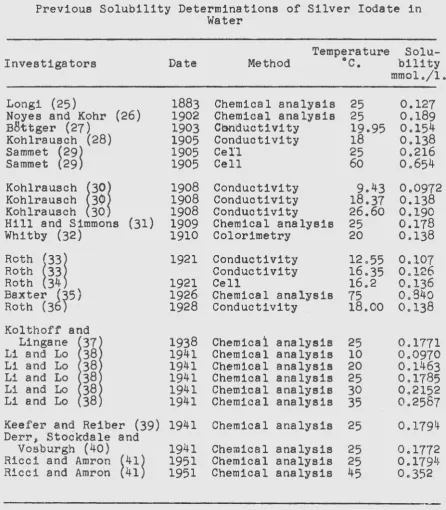
The solubility of silver iodate has freq~ently ~een determined in pure water and in solutions·of diverB3 ioneJ
however~ 1~here hal! be•~n only one quantititative 1 .... eport of ita solubility in a Bolution containing a common ion (24 . • In order to fac~litate the presentation, various reported data have been included in Table 1. Values are reported only for the cases in which the dissolving medium wae pure w~ter
since the present work is not concerned with the solubility in solutions containing diverse ions. ·
Ricci and Amron (41) studied the aqueous ternary systems of silver iodate with each of the following salt~ at 2,°C: L1I03~
Naro
3pKrc
3» andNH4Io
3 . Isotherms obtained forTable 1
Previous Solubility Determinations of Silver Iodate in
Water
Investigators
Longi (25)
Noyes and Kohr (26) B8ttger (27)
Kohlrausch (28) Sammet (29)
Sammet (29)
Kohlrausch
~30l
Kohlrausch 3¢lKohlrausch 30·
Hill and Simmons (31) Whitby (32)
Roth
~33l
Roth 33 Roth 34 Baxter (35) Roth (36)Kolthoff and
Lingane 37
Li and Lo 38
Li and Lo 38
Li and Lo 38
Li and Lo 38
Li and Lo 38
Date 1883 1902 1903 1905 1905 1905 1908 1908 1908 1909 1910 1921 1921 1926 1928 1938 1941 1941 1941 1941 1941
Keefer and Reiber (39) 1941
Der~i~tocikdale and
Vosburgh (40)
Ricci and Amron (41)
Ricci and Amron (41)
1941 1951 1951
Temperature Solu-Method °C. bility
Chemical analysis Chemical analysis Cooductivity Conductivity Cell Cell Conductivity Conductivity Conductivity
Chemical analysis Colorimetry
Conductivity Conductivity Cell
Chemical analysis Conductivity
Chemical analysis Chemical analysis Chemical analysis Chemical analysis Chemical analysis Chemical analysis
Chemical analysis
Chemical analysis Chemical analysis Chemical analysis
25 25 19.95 18 25 60 9.43 18.37 26.60 25 20 12.55 16.35 16.2 75 18.00 25 10 20 25 30 35 25
25
25
45
mmol./1. 0.127 0.189 0.154 0.138 0.216 0.654 0.0972 0.138 0.190 0.178 0.138 0.107 0.126 0.136 0.840 0.138 0.1771 0.0970 0.1463 0.1785 0.21520.2587
0.1794 0.17720 0 1791~
[image:10.565.66.513.114.625.2]testa for silver in the solutions containing silver iod~te
and the dissolved salt were negative.
Shchigol (24) reported the solubility of silver iodate
at 20-22°C. in aqueous solutions for three concentrations of potassium iodate. Equilibrium mixtures were prepared
by contacting an excess of silver iodate with 100 ml. of a solution of potassium iodate which had been prepared by
weighing the oalt directly. They were agitated for twenty-four howrs and filtered. The saturation concentrations of silver iodate in the filtrates were determined volumetrically
using the standard iodometric method for iodate analysis.
The concentrations of iodate at which solubilities were measured were 0.005 M, 0.025 M and 0.50 M. The final molarities of iodate found in the 100 ml. filtrates were reported to be 0.005060 M~ 0.0255000 M, and 0.500830 M which implies that percentage increases in the iodate concentrations of 1.2~ 2~ and 0.2 wero determined with an accuracy as great
as that contained in the concentrations stated above. This
investigator considered that silver was present in the
equilibrium solution phases only in the f orm of the Ag+ and Ag(I03) 2 - ions. From the data, a calculated ina~ability conetant (Kl) for the latter speoiea was reported as 2.~2 x l0-0 • In the calculation~, a value of the thermodynamic solgbility product for silver iodate at 20-22°0. ot 3~t x 10- was used without reference to ita origin. Th~s 7alue was not in agreement with the value of 2.078 x 10-o obtained
in the c8reful wcrk of Li and Lo (36) at
2o•c
.
It waaalso apparent that the valueB 0.960, 0.920 and 0.900, which were used as mean ionic activity coefficients in the cal-culations of the iodate ion activities at the ionic
strengths of Oo00506i Oo02550, and 0.50083 were not in
acco~d with the ezperimentally determined values for ailver iodate in solutions of pot~asium nitr~te (36)o Accordingly,
the information on equilibria in th~ silver iodate-iodate ion-water systems 1~ limited by the inherent uncertainties caused by determining differences between nearly like
quantities~ the few iodate concentrations studied~ the ~e~ect
of the Agi03 (aq.) spec1ea~ and the questionable parsmetera used in the calculations.
II. EXPERIMENTAL
A. Material
1. Reagents
All water that was used in this work was prepared by redistilling dis'tilled water from alkali permanganate solutionsG Its specific conductance was found to be 2.5 x 10- mho. em.- •
The lithium hydroxide, iron{III) nitrate, perchloric acid, borax, sodium thiosulfate, acetone, potassium nitrate, potassium hydroxide, carbon tetrachloride, sodium hydroxide, potassium iodide, hydrochloric acid, 37 per cent formaldehyde solution, ammonium hydroxide, nitric acid, and iodic acid · that were used were reagent grade chemicals. Potassium cyanide was
c.
P. grade. These re•gents were obtained from the J. T. Baker Chemical Company, and were used without further purification. Lithium carbonate and lithium per-chlorate were also reagent grade; the former being supplied by the Mallinckrodt Chemical Works, and the latter by the G. Frederick Smith Chemical Company. Solutions of lithium perchlorate were filtered before being used in order to remove any insoluble matter which was present.The platinum used in the plating procedure was 1 mil
sheet stock supplied by the American Platinum Works.
Lithium iodate was prepared by means of the ·following reactions:
(1)
A stoichiometric amount of iodic acid was added to an aqueous
solution of lithium carbonate. The salt was allowed to crystallize after the carbon dioxide formed in the reaction had been driven off by heating. The product was filtered,
recrystallized twice from water, refiltered, washed, dried
at 120°C for twenty-four hours, and stored in a desiccator
over anhydrous magnesium perchlorate. Analyses of the salt
for total iodate content were consistent with the theoreti-cal composition.
2. Analytical standards
The primary standards used were silver nitrate, potassium
These were reagent grade chemicals, purchased from the
J. T. Baker Chemical Company. All standardized solutions of sodium thiosulfate contained a borax preservative.
3.
Radioactive silverSilverllOm, which decays with-a half-~ife of 270 days
(42,43),
was used throughout the experiments. It wasobtained from the Oak Ridge National Laboratory in a ten millicurie shipment. The irradiated silver had been dis-solved in
1.4
ml. of 2 N nitric acid, and was reported to have a radiochemical purity in excess of98
per_cent.Stock solutions containing silver of·a definite specific activity were prepared in the following manner. An aliquot of the ten millicurie souree was added to a dilute nitric
acid solution containing an amount ~f. inactive silver nitrate. A sample ef 50 mg. of iron(III) carrier was added, and the solution was scavenged by precipitation of the iron with an excess of aq.11eous ammonia. The iron hydroxide was filtered from the solution with S&S black ribbon filter . paper and pulp leaving a clear filtrate which was ta~en tb
dryneas with un excess of nitric acid. The residue was dissolved in dilute nitric acid, and the silver was
quantitatively precipitated as the chloride. This precipi-tate was digested, and filtered through S&S blue ribbon fil-ter paperJ ~~b~equently, it was dissolved from the filter with concentrated ammoni~. Potassium cyanide was added, and the silver was electroplated on a platinum gauze cathode according to a method proposed by Slornin
(44).
Following ·this operation, the silver was dissolved from the electrode with 10 N nitric acid, and the entire purification cycle was repeated. The final electroplating was performed using a carefully weighed electrode, and the amount of pure silver was determined gravimetricallYo The remainder of the procedure merely involved dissolution of the weighed silver in nitric acid, fuming with perchloric acid, and silution in a volumetric flask. Two stock solutions
con-taining silver of different specific aotivities were prepared.
4. Tagged silver iodate
An aliquot of the stock solution prepared by the method of Part 3 sbove, and containing approximately 10 mg. of
radioactive silver, was added to a heavy glass centrifuge tube. Lithium hydroxide was added in sufficient quantity to neutralize excess acid; however, the final pH wae kept be-low the va J.•.Je at which hydrous silver oxide appearo. A
constant stirring» and a copious precipitate of silver iodate was formed which was centrifuged and washed
repeatedly with 10 ml. portions of warm water. The wet mass of crystals was finally washed» slurried» and trans-ferred to the equilibrium flask using many small portions
of the solution phase with which they were to be equilibrated. Two groups of silver iodate precipitates containing silver of different specific activities were prepared from the two
stock solutions described in the previous section.
B. Analyses
The equilibrated mixtures contained tagged silver iodate in contact with an aqueous solution of lithium iodate. In
cases where measurements were performed at constant total ionic strength, lithium perchlorate was also present. There-fore» a previous knowledge of the concentration of lithium perchlorate in a given solution would allow for a complete description of all solutions with but two analyses, total
iodate~ and total silver.
The main stock solution of lithium perchlorate was analyzed by passing aliquots of it through a column of Dowex-50 cation exchange resin in the acid form. The equivalent acid liberated by the lithium ion was titrated with an aqueous solution of sodium hydroxide which had been
standardized against pure potassium acid phthalate. The sodium hydroxide solution was prepared by filtering a saturated aqueous solution of sodium hydroxide into hot, boiled» doubly distilled water, and stored in a bottle equipped with an ascarite-magnesium perchlorate trap to exclude carbon dioxide from the air entering the bottle.
Analyses for iodate ion were performed volumetrically. An iodometric procedure was employed in which iodate ion was reduced to iodine in dilute hydrochloric acid solution by an excess of iodide ion. The liberated iodine was
titrated with sodium thiosulfate which had been standardized against doubly recrystallized potassium iodate. The no::•r:.;a l= itles of the sodium thiosulfate solutions were pe~iodically checked.
A radioassay technique was employed to determine the concentration of silver in a given equilibrium sample. In principle the analysis was simple. Once the specific activity of the radioactive silver in the solid phase was
known~ a determination of the activity contained in a
•
'I
definite volume of the solution phase gave t e concentx•ation
of silver contained thereino However~ due to the problems encountered in obtaining a reproducible set of counting conditions from one sample to the next, the procedure was made rather difficulto
Previous experiments on sparingly soluble silver salta·
have been enumeratedo In the work of Jonte and Martin (20), the concentration of silver was determined by counting the silver contained in an aliquot of the equilibrium solution after evaporation on a copper disco By employing uniform copper discs~ and a careful evaporation technique» geometry and backsoattering factors were held quite constanto As the ionic strength of an aliquot increased, the bulk of the sample also increasedp consequently, self absorption factors were not held constant from one sample to the next. Because of this featureD a series of solutions having
identical concentrations of radioactive silver. bu~ con-taining different quantities of dissolved solid were used to prepare standards for comparison. The method is adequate for ~ysterns in which the ionic strength of the equilibri~m solution phase is lOWJ howeverp if samples of considerable thickness are obtainedp an accurate comparison ia very difficult to obtaino This factor alone was sufficient to exclude the poaaibility of using such a procedure in the preeent work since many measurements were made at 1o~1c strengths as high as 1 Mo Leden et al. (21,22»23) employed
a capping counter for counting radiosilver p1•eeent :'l.n
aliquota of the equilibrium solution phaseso The counting rates obtained were directly proportional to the concentra-tions of the silver in the aliquots. This technique allows for a greater reproducibility of geometry and self-absorp-tion effects than do moat procedures in which solid matcr1als are counted9 however P it possesses two distirv3t di~advEn.t,ages. The counting geometry» thiclmess of the counter windm: p and
the necessity for isotopic dilution to insure negligible adsorption of activity on the apparatus require that trace~s of veJ:•y hlgh spec1fic activities be used. If cumbE:Pso.Je shielding is to be avoided, this factor also imposes
for the ranges over which the concentrations of common and diverse ions were varied. A procedure in which liquid samples are directly counted is obviously capable of
giving accurate results only at a great expense of
con-venienceo This highly undesirable feature mitigated against the use of this procedure in this present work and initiated a search for a technique which embbd~d both ease of operation and accuracy of all equilibrium solution concentrations and densitieso
A radioassay method which possessed the desired attributes was based upon an electrodeposition procedure for mounting samples for counting. Samples of 2.00 ml. of the equilibrium solution phases were carefully added to
5 ml. portions of strong nitric acid solutions which contained a predetermined amount of silver carrier (usually 10 mgo). To insure complete exchange between the tracers and the carriers, the solutions were evaporated to dryness. The residues were subsequently dissolved in
25
ml. portions of concentrated ammonium hydroxide, and the following ingredients were added in the amount and order stated below to convert the solutions into suitable silver plating baths.0.3 g. KCN
9 g. KN03
1 g. KOH
3/4
ml.37%
formaldehyde solution5 ml. H20
For solutions in which iodate ion concentrations were high and perchlorate ions were present, approximately one-half of the potassium nitrate was replaced with ammonium nitrate. In every case in which perchlorate ion was present the
quantity of potassium nitrate added was sufficient to pre-cipitate most of it since high concentrations of perchlora~e
ions interfered with the electrolysis. The plating baths ·
were heated and separated from the undissolved solids by
decantation.
They were subsequently transferred into electrolysis cells, heated nearly to their boiling temperatures, and a current of 0.2 amp. was passed through them for a period of thirty-five minutes. In all the electrolyses, the baths
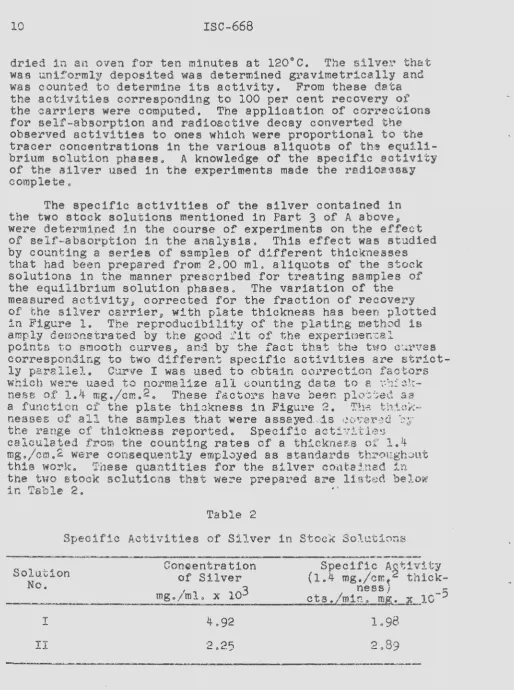
dried in an oven for ten minutes at 120°C. The silver that was uniformly deposited was determined gravimetrically and was counted to determine its activity. From these data
the activities corresponding to 100 per cent recovery of
the carriers were computed. The application of corrections for self-absorption and radioactive decay converted the
observed activities to ones which were proportional to 'the tracer concentrations in the various aliquots of the equili-brium solution phases.. A knowledge of the specific activity of the silver used in the experiments made the radioa~~ay
complete.
The specific activities of the silver contained in the two stock solutions mehtioned in Part
3
of A above, were determiped in the course of experiments on the effectof self-absorption in the analysis. This effect was studied by counting a series of samples of different thicknesses that had been prepared from 2.00 ml. aliquots of the stock
solutions in the manner prescribed for treating samples of the equilibrium solution phases. The variation of the measured activity~ corrected for the fraction of recovery
of the silver carrier~ with plate thickness has been plotted in Figure 1. The reproducibility of the plating method is amply demonstrated by the good tit of the experimental
points to smooth curves~ and by the fact that the two curves corresponding to two different specific activities are strict-ly parallel.. Curve I was used to obtain correction factors which were used to normalize all counting data to a t;hicl~·
neBe of 1.4 mg./cm.2. These factors have been plotted as
a function of' the plate thickness :in Figul"e 2. The t.h:'Le i<:-nesses of all the samples that were aasayed";is ~~o~rer<:~d. ~GJi''
the range of thickness reported. Specific actiJitieo calculated from the counting rates of a thickness of 1.4 mg./am.2 were consequently employed as standards throughout
this worko These quantities for the silver contained in
the two stock solutions that wel"e prepaJ.:•ed are li.S\tr~d be lo-w
in Table 2. · ·
Table 2
Specific Activities of Silver in Stock Solutions Solution
No.
Coneentration Specif~c A~ti~ity of Silver
(1.4
mg./am~ tnick-mg./ml. x 103 ~ 1 nessy , .-5 ~--~---~---c~t=~~·~m=i~n.~lOI
4.92
1.98
[image:17.565.42.557.27.718.2]' 2000
Q)
-
::lc:
[image:18.565.59.654.87.476.2]E 1500 ...
(/)
-
c:::l
0
u
..
~
I->
1-u
1000
<X: 500
0
r'\
- 0
('\
..£"'\. ~ ~ ~ ru .Li 0
O'U f)~
-
:J0
I""'""0
.
0~0
~""""'4~
('\
-~
U'u '"
"0-0
0.40 0.60 0.80 1.00 1.20 1.40 1.60 1.80
THICKNESS OF SILVER PLATES, mg I cm2
Figure 1 - Experi~!ntally determined self-absorption curves
for Ag Om of different specific activities.
2.00 2.20
H
(/) 0
I
0\ 0\
(X)
1.10
a::
~
ult
z
0
~ 1.00 u
w
a::
a::
0
u
0.90
0.40 0.60 0.80 1.00 1.20 1.40 1.60 1.80
THICKNESS OF SILVER PLATES, mg I cm2
Figure 2 - Calculated correction factor curve for normal-izing all counting data to a sample thickness of 1.40 mg./cm.2.
2.00 2.20
H
(/)
0
[image:19.566.67.658.59.480.2]Backscattering of radiation from the samples was held constant by mounting all the plates on a sufficient
thick-ness of tantalum to insure infinite backscattering
character-istics .•
The accuracy with which samples were analyzed was achieved with little expense in convenience and was
uniformly obtained for all samples regardless of the
composi-tion, or density of the equilibrium solutions.
C. Apparatus
All mixtures were allowed to equilibrate in Precision
Scientific Company water baths in which the temperatures were
held constant to + O.l°C.
Erlenmeyer flasks having ground glass stoppers were used
exrilusively to contain the equilibrium mixtures. Some were
Corning Glass Works pyrex Low Actinic, red variety glass,
while others were standard pyrex flasks which had been
wrapped with a black plastic adhesive tape to exclude light. The flasks were sealed with paraffin wax before being placed in the constant temperature baths, and were agitated with
the aid of two Burrell Model CC shakers. Caps for the
flask~ were made from pyrex male 24/40 standard tapers.
Separations of representative samples of the equilib~i~rn
solution phases from the various mixtures were accomplished by filtration through "fine" fritted glass discs having nominal maximum pore sizes of five microns. A simple apparatus was designed which permitted the filtrations to
be performed under pressure in the thermostatted baths. It
was found that suction applied to a filter of this pore
size caused considerable cooling of the equilibrium
solu-tion samples.
The fritted filters were 10 mm. in diameter and were
mounted in the end of 13 mm. pyrex glass tubes. The filter
tubes were sealed through standard taper caps for the
equilibrium flasks and were sufficiently long to allow for
insertion of the fritted discs to a distance of 3 mm. above
the bottom of the flasks. A 5 mm. glass tube was also
sealed to the caps to provide the connection through which
pressure could be applied with a
30
cc. glass tip hypodermicsyringe. During the sampling operation all caps were held
applied with the syringe, the equilibrium solution through the filter into the filter :tu:t>e from which were withdrawn with the aid of pipett~s.
\'Jaa forced samples
_.:·
•
The necessity for obtaining true samples of the equili-brium solutions has been stressed. Before the filtering medium mentioned was adopted for use in this work, a study
was carried out to determine its effectiveness. Four different fritted gloss filters having the nominal maximum pore sizes of 30, 14, 5· and 1.2 microns were examined. It was thought that if samples of an equilibrium solution were passed through these filters, and radioassays of definite volumes of the
filtrates were-identical, all filters would be suitable for obtaining representative eq~ilibrium solution samples. The results of the first experiment are given in Table 3. The amount of the filtrate that was assayed in each case was exactly 2.00 ml. The solution sampled was 0.005 M with respect to lithium iodate. Each assay value is an average of two determinations.
Table 3
Assays of Filtrates from Equilibrium Solution of pH 5-6 atid 0.005 M with Respect to Lii03, for Various Filters
a
This
Filter name
Nominal Maximum Pore Size
microns
Counting Rate 2 ml. Portion counts/minute
Time Needed to Obtain
Sample ____________________________________ minutes
Coarse8 40 1458 2
!'vledium 14 522 10
Fine 5 463 30
Ultra flne 1.2 372 2~)0
-filtration was performed with :suction.
The results listed in Table 3 dertainly indicated that all of the filters were not usable. The high assay value
..
with the other filters were not immediately clear. It was considered possible that particles approaching colloidal dimensions were not being filtered effectively, or that
silver was being adsorbed on the fritted glass. The latter notion seemed to be more compatible with the trend of the assay values given in Table 1. In either case, a decrease in the pH of the equilibrium solution should have produced a marked effect on the discrepancies since radiocolloid
formation is reduced in acid solutions, and adsorption sites would be occupied by excess hydrogen-ion present. The
results of an experiment in which the pH of the same
equilibrium solution was adjusted to a value of 2 are given in Table 4a In this and all subsequent experiments the coarse filter was not used. An increase in the hydrogen
Table
4
Assays of Filtrates from Equilibrium Solution of pH 2 and 0.005 M with Respect to Lii0
3,
for Various FiltersFilter name
I"ledium
Fine
Ultra fine
Normal Maximum Pore Size
microns
14
5
1.2
Counting Rate of
2 ml. Portion counts/minute
559
5'23
472
ion concentration caused the difference between the assay values to narrow. This fact was taken as evidence that adsorption rather than radiocolloid formation was the cause of the disagreement. A trend was also present in the assay values obtained in this experiment. It was calculated
that an increase of approximately
4%
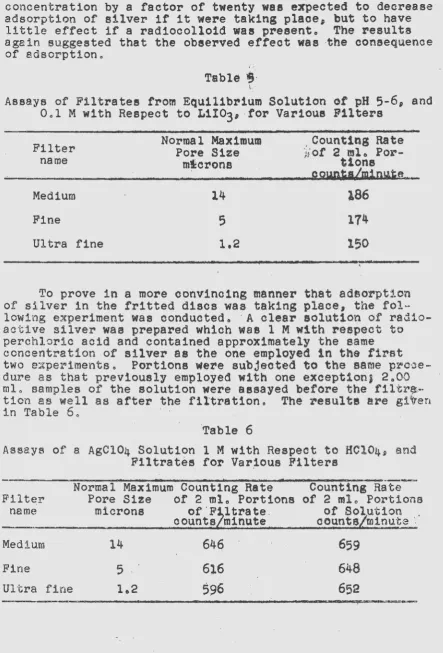
in the counting rates over those obtained in the first experiment was due to the increase in ionic strength caused by the addition of the perchloric acid. However, in each case there was at least an equal, or substantially greater increase in the assay values due to the suspected decrease in th€ number of available adsorption sites. To further eliminate the possibility of the existence of a radiocolloid of silver, a third experiment was performed using an equilibrium solution which was nearly neutral and was 0.10 M withconcentration by a factor of twenty was expected to decrease
adsorption of silver if it were taking plaoe8 but to have
little effect if a radiocolloid was preeento The results
again suggested that the obeerved effect was the conaequenoe
of adsorption.
Table
19·
\.'
Assays of Filtrates from Equilibrium Solution of pH
5-6
8 and0.1 M with Respect to Lii038 ·for Various Filters
Filter Norma 1 Maximum Pore Size };or Counting Rate 2 mlo
Por-name m~crona t1ons
...
poJW.;s/m;i.nl4ie .. _
Medium
14
A86
Fine
5
174
Ul'tra fine
1.2
150
To prove in a more convincing manner that adsorption of silver in the fritted discs was taking place, the fol-lowing experiment was conductedo
·
A
clearsolution
of radio-active silverwaa
prepared which was l M with respectto
perchlorio acid and contained approximately the same concentration of silveras
the one employedin
thefirst
two experiments. Portions ~ere subjectedto the
same
proce-dure as that previously employed with one exception$ 2o00 mlo samples of the solution were assayed before the f1ltr~ tion as well as after the f11trat1on6 The resulte are gi~enin Table 60 ·
·Table 6
Assays of a AgCl04 Solution 1 M with Respect to HCl04~ and
Filtrat~s for Var~ous Filters
Filt~r name Medium
Fine
UH-;r•a fine
Normal Maximum Counting Rate Pore Size of 2
mlo
Portionsmicrons of'F ltrate.
counts minute
14
6465
I 6:L6lo2 5~6
- - - -
-
·
Counting
Rate--of
2 mlo Portionsof Solu·tion
counts rninute .. ~
659
648
[image:23.562.50.494.92.746.2]The possibility of a radiocolloid of silver existing
in 1 M perchloric acid solution of silver perchlorate is
remoteJ) however.s> the results of Table 6 indicated that the
differences,!) although smaller than in previous experiments,
still existed and the trend of assay values originally
found had not disappeared. On the basis of the above results
the colloid hypothesis was abandoned1 and the adsorption
hypothesis was considered to be well substantiated. Another
experiment was performed to see if the "medium" and 11fine11
filters could be saturated with silver. Two 3 ml. portions
of the perchlorate solution were drawn through each of the
filters and discarded before a sample was taken for assay
purposes. Indeed1 Table 7 indicates that they were saturated.
Table 7
Saturation of Medium and Fine Filters
Filter
name
Medium
Fine
Normal
Max-imum Pore
Size microns
14
5
Counting Rate of 2 ml. Por-tions of
Filtrate After Saturation
counts/minute
645
641
8These values werQ obtained from Table
6.
Counting Rate of 2 ml.
Por-tions of
Solutions8
counts/rl1inute
659
648
The preceding series of inve-stigations indicated that ''fine"
filters could be employed if precautions were taken to
saturate the filters before drawing samples for radioassay.
In the course of the study mentioned above1 the
effect-iv~ness of centrifugation as a means of separating
equili-brium solutions from the equilibrated mixtures was also
investigated. It was found that occasionally this method
was not completely effective in separating the solid from
the solution phases.s> however, contaminated samples were
easily discovered since inclusion of small particles
of the solid caused great increases in the counting rates
of the samplesb The method also possessed the disadvantage
of having to remove mixtures from the constant temperature
The electrolysis cells which were used to contain the silver plating baths were similar to Tracerlab E-16
Electro-plating Cells in all respects except one. Non-magnetic
stainless steel was used in their construction rather than
chrome-plated brass because of the highly corrosive nature of the ammoniacal cyanide bath. Electrodes were made f~om
l mil platinum stock. Cathodes were cut in the form of discs having a diameter of 1 inch. Anodes were 0.5 x Oo7 em. rectangles, and were spot welded to platinum wires whfuh were sealed into glass tubes
4
inches in length. Electricalcontacts to the cathodes were made directly with the frame of the apparatus; whereas the anode contacts were made through
the anode tubes filled with mercury. The necessary plating voltage was supplied by a Sargent-Slomin Electroanalyzer.
Rubber gaskets used to prevent leaking around the cathodes.
had outside diameters of 1 inch and inside diameters of
7/8
inch. A platinum surface of3.47
cm.2 was exposed to silver plating after the apparatus was assembled and the gasketswere secured against the cathodes. Anodes were stationary
during the electrolyses, and stirring was accomplished with
motor driven glass stirrers having two small blades at right
angles. A rheostat was provided· to control the speed of the
stirring motor.
For the purpose of avoiding needless repetition, the
procedure for plating silver samples was merely e~ated in
Part B above. The actual precautions taken to insure amoo~b,
bright, and reproducible plates were not discussed at any
length. Plating without stirring was tedious, and bulky, '
non-reproducible plates were obtained from which particleB·
of silver were dis~ngaged by the slightest provocation.
Because of the hialth hazard involved in such a technique,
and the difficulty with which plate~ were reproduced,
stirring h&d to be used. For the best results, the anods
was mounted at the side of the cell and 1 inch above the
cathode at the bottom of the cell. The glass sti~rer was
inserted to a position immediately above the anode flag.
Strong vortex motion induced by the stirrer on the solution near the cathode was ea~~ly controlled by using the anoda as a baffle. Various degrees of baffling were obtained
by merely rotating the anode flag. This control was necessary to prevent the appearance of a bald spot at the center of
the plate. Convection was found to be helpful in increa
s-ing the rate of deposition and consequently the fineness of the plateo For this reason the baths ~ere maintained raear to their boiling temperatures during the electrolyses. To provide uniform convection over the whole of the cathode
To prevent the amrno·niaca 1 cyanide baths from
attack-ing the silver plates at the terminations of the plating
periods, carbon tetrachloride was added to the
electroly-·sis cells in sufficient quantities to lift the plating
baths from the plates. The current immediately fell to an insignificant value but the plates were protected from
the corrosive action of the bath. The bath was subsequently
removed from above the carbon tetrachloride by means of a pipette equipped with a syringe.
Potassium nitrate that was added to the plating baths served two purposes, elimination of the major portion of
the perchlorate ion present and reduction of the internal
resistance of the bath. At high voltages the cathodes were etched, and at high current densities the silver plates
were burned. Inclusion of this salt with a little 37% formal-dehyde solution enabled bright and clean plates to be obtained
at current densities in the range 0.05 - 0.10 amp./cm.2 under
an applied voltage in the range 2.5 - 5 volts. Experiments
with blanks demonstrated that there was no dissolution of
the anode at these operating values of current and voltage.
The mass of most of the silver plates was in the range
3 to 5 mg. To keep the errors in weighings below a nominal
value of 1%. samples were weighed with an Ainswor~h
analytical balance capable of determining masses with an
accuracy of ± 0.03 mg.
A Tracerlab Geiger-Mueller counter with an end mica window of thickness 1.8 mg./cm. 2 was used in conjunction with a Nuclear Instrument and Chemical Corporation Model
165 scaling unit for the counting of radioactive samples. Counting data were taken using the same aluminum sample
holderj tantalum backing. lead housing. and commercial plastic
counter mount for all samples.
D. Procedure
To prepare a mixture for equilibration. tagged silver iodate was slurried with a portion of a 50 ml. solution that
contained the concentration of lithium iodate for which the solubility was to be measured. The slurry was transferred
to an equilibrium flask and the remainder of the 50 ml. was used to completely transfer the residues. The flask was
subsequently sealed with para~fin wax~ inserted into a
mechanism. !J!ixtures which co:1ta ined silver of the lower•
specific activity were prepared with 25 mg. of solid
phase, whereas those which had the higher specific activity
silver contained 12.5 mg. For measurements at constant
ionic strength, the mixtures were made from solutions con-taining both lithium iodate and lithium perchlor~te in the proper proportions. These solutions had been prepared by
adding an accurately weighed q~antity of pure lithium iodate to an appropriate amount of 1·;ooo M lithium perchlorate
solution in a volumetric flask. The desired ionic strength of 1.00 M was obtained by dilution to the mark.
' • '
Mixtures were allowed to equilibrate for a period of at least one week. Samples of the solution phase obtained after two weeks of equilibration gave the same results
aa those which had been taken after an interval of one week.
In some cases saturation equilibrium was1approached from both
below and above the bath temperatures. Differences in' the
observed solubilities for seven experiments at different
temperatures, and concentrations of salts~ were not obtained by either of the procedures, and data obtained by approach-ing saturation only from supersaturation were on a smooth curve with those obtained by approaching from unsatura~ion.
~ \
To sample an equilibrium solution phase, the filter-ing apparatus was brought to the equilibrium temperatar~s,
inserted into the mixture, and pressure was applied until
a suitable amcunt of clear filtrate resided in the filter tube. The level of the solution in the tube was neve~
allowed to reach the necl< of the flask. Pipettes lffere rinsed with small portions of the filtered solution ~nd in
most oases two 5 ml. samples were taken for iod~~.te a~.lillJ)'Sis.
For solution phases in which the concentration of iodate
ion was very high 2 ml. samples were taken for analysi~o
Pressm."e ~~as applied again and two 2 ml. samples we1•e tal::Em
for radioassay of the silvel"' pl"esen'G. To insure that a 11
filters were completely saturated with silver ion before
samples were taken for radioassay, the first portions of the equilibrium solution phase were always taken for the
iodat2 analyeis.
III. RESULTS
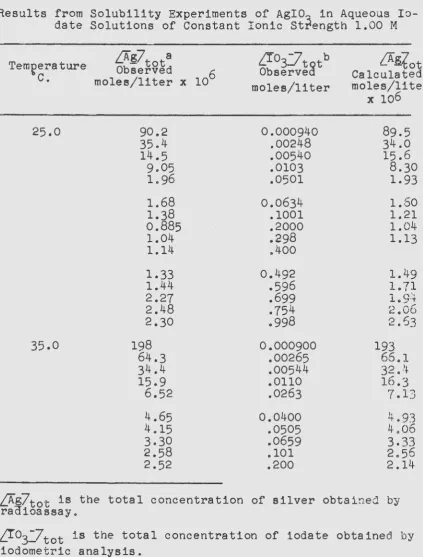
A. Results from the Solubility Determination~
Table 8
Results from Solubility Experiments of Agro3 in Aqueous Solutions of Lii03
Temperature LAg7tot8
fA.iltot
Observed
Cf
Observed 037totb '( ~c -loglO ( LAYtotLI03Jtot - )1/20
± Calculated"c.
moles/liter moles/ moles/ 6X 10⁶ liter J:lte~ x 10
25.0
37.0~
0.000722 0.968 3.80 45.218.1 .00187 .951 3.76 18.2
7.03d .00421 .933 3.79 8.46
6.85d .00493 .928 3.77 7.34
4.29 .0101 .903 3.72 3.86
3.30 0.0110 0.899 3.77 3.59
3.05 .0151 .887 3.72 2.73
2.12 .0249 .863 3.70 1.84
1.13 .0353 .845 3.77 1.43
1.11 .0848 .795 3.61 1.00
0.978 0.1023 0.782 3.61 0.865
. ~993 .1180 .776 3.58 .845
.835 .1540 .761 3.57 .849
.915 .2042 .747 3.49 .892
1.04 .2580 .733 3.43 .975
a
1Ai7tot is the total concentration of silver obtained by radioassay.
boo3 -7tot is the total concentration of iodate obtained by iodometric analysis-.
cThese values are mean ionic activity coefficients for singly charged ions
obtained by interpolation from the table of y1 values presented by Crouthamel
and Martin (17).
dThese val11ee were obtained with silver or specific activity 1.98 x 10⁵ counts;
minute mg~ All other values were obtained with silver of specific activity
2 • 89 x .. L
o·)
- coun~o;m~nu,
+- 1 "" t e mg.H
(/) 0
I 0\ 0\
Q)
[\)
[image:28.567.92.700.86.540.2]'rempera. ture
~il--ot
bse~ved 8,
0°37
Observed
totb
( !
c
-~oglo(LA~totLI~
~
03:7tot}-
1/2
(±LA~tot
Calculated
"c.
moles/l~termoles/
moles/
X 10
liter
liter x
106
35.0
87.5
0.000693
0.970
3.62
99.7
28.0
.00272
.943
3.59
27.2
15.1
d
.00435
.932
3.62
17.5
8.66
.00780
.914
3.63
10.4
7.68
.0114
.900
3.58
7.58
4.09
0.0266
0.860
3.55
3.80
2.71
.0398
.837
3.56
2.90
2.46
.0520
.821
3.54
2.48
1.99
.0836
.795
3.49
1.99
H (/.)1.73
.1023
.782
3.49
1.88
0I
0\
1.89
0.1068
0.781
3.46
1.86
0\(X)
1.69
.1279
.771
3.44
1.81
1.80
.1682
.757
3.38
1.80
1.74
.2292
.740
3.33
1.91
1.66
.252~.737
3.32
1.96
1.97
.2700
.732
3.28
2.01
50.0
217
0.00914
0.966
3.37
206
65.6d
.00283
.942
.
3.40
70.9
23.0
.00800
.911
3.40
27.8
19.9d
.0109
.899
3.38
21.5
13.7
.0177
.880
3.37
14.4
7.26
0.0395
0.837
3.35
8.15
3.64
.1008
.
783
3.33
5~124.05
.131
7
.770
~ _,.
25
4.~5!~ 0 211-
.1580
• '7603.21
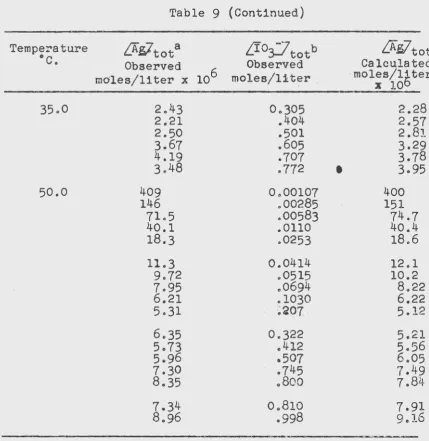
4. 2 [image:29.564.98.682.70.508.2]for 25.0°C., 35.0°C. and 50.0°C. Instances in which solu-bility data were obtained with silver of different specific
activities have been indicated. Assays of the equilibrium
solutions in which ionic strengths were fixed at 1.00 M
have been presented in Table
9.
The range of iodatecon-centrations studied was greater in these solutions.
Plots of the logarithms of the total silver
concentra-tions have been presented in Figures 3 and
4.
Anexamina-tion of these plots indicated an important feature of the
equilibrium systems. In every case it appeared that the
slopes of the curves in the region of high iodate ion
activities or concentrations were not greater than 1.0,
consequently~ there was no evidence for significant
forma-tion of complex species containing more than two iodate ligands per central silver atom in the range of concentrations
studied.
For Figure 3, iodate activities were computed from the
concentrations by employing activity coefficients,
y
%' fora singly charged ion. These were interpolated from the tabulation of t1, presented by Crouthamel and Martin (17).
The same activity coefficients were used for all ecuilibrium
temperatures since ( is virtually independent
of-temperature in a small range of temperature. Activity
coefficients applied to iodate concentrations in the range
O.l~[(OJ=?tot ~0.27 moles/liter were used with the
reserva-tion that they represented only a fair approximation to the true values for silver iodate in aqueous solutions of lithium
iodate. In all calculations it was assumed that only a
negligible fraction of the total iodate was supplied by
dissolution of silver iodate or removed by the formation of
iodate complexes, i.e.
where:
ifo
3
:7
=
molar concentration of free iodateion
(2)
!J.o
37tot=
observed total molar concentrationof iodate in the equilibrium solu-tions.
B. Description of the Complexing Equilibria
The equilibrium state of the system was successfully
Table 9
Results from Solubility Experiments of AgiO~ in Aqueous
Io-date Solutions of Constant Ionic Strength 1.00 M
Teml:erature
c.
25.0
35.0
fA~7tota
Observed 6
moles/liter x 10
90.2 35.4 14.5 9.05 1.96 1.68 1.38 0.885 1.04 1.14 1.33 1.44 2.27 2.48 2.30 198 64.3 34.4 15.9 6.52 4.65 4.15 3.30 2.58 2.52
!J.
03Jtotb Observed moles/liter 0.000940 .00248 .00540 .0103 .0501 0.0634 .1001 .2000 .298 .400 0.492 .596 .699 .754 .998 0.000900 .00265 .00544 .0110 .0263 0.0400 .0505 .0659 .101 .200LA~fot
Calculated moles/literX 106
89.5 34.0 15.6 8.30 1.93 1.60 1.21 1.04 1.13 1.49 1.71
1. 9·+ 2.06
2.63
193
66.1 32. )t
16.3
7.13
4
.93
~-.063.33
2.56 2.14a[Ag7tot is the total concentration of silver obtained by
raCiioassay. b
0'03-=ltot is the total concentration of iodate obtained by
[image:31.564.68.492.94.652.2]Table 9 (Continued)
Temperature
fAiltota
Lfo~totb
LAsltot
oc.
Observed
Observed
Calculated
moles/liter x 106 moles/liter
.
·
moles/16ter
.
x
10
35.0
2.43
0.305
2.28
2.21
.404
2.57
2.50
.501
2
.8J.3.67
.605
3.29
4.19
.707
3.78
3.48
.772
3.95
50.0
409
0.00107
400
146
.00285
151
71.5
.00583
74.7
40.1
.0110
40.4
18.3
.0253
18.6
11.3
0.0414
12.1
9.72
.0515
10.2
7.95
.0694
8.22
6.21
.1030
6.22
5.31
:~'a07
.
5.12
6.35
0.322
5.21
5.73
.412
5.56
5.96
.
o507
6.05
7.30
.745
7.49
8.35
.800
7
.8J.J.7.34
0.810
7.91
[image:32.566.70.500.82.524.2]CONSTANTS ~N TABLE II
0
-EXPERIMENTAL VALUES FROM RADIOASSAYS WITH SILVER OF3.0~ SPECIFIC ACTIVITY 2.89 X 10⁵ counts I mg . - - - - 1
• . - EXPERIMENTAL VALUES FROM RADIOASSAYS WITH SILVER OF
SPECIFIC ACTIVITY I. 98 X 105 coun)s I mg
E
4
.
0~~-L~~~+---~---~---t---!---r--~
,----,
01
<X:
'----'
o I 1 I I
01 ~ ~ L ..._1
o 5.0 I I - . . . : : : : : =
I
el
50.0 °C
35.0°C
6.01 I I I '-~ ~
25.0°C
13.0 2.5 2.0 1.5 1.0 0.5
[image:33.564.75.663.57.478.2]-Jog tO 0[ 10
3
J
totFigure 3 - Graphs of solubilities of Agi03 for
equili-brium solutions of low, variable ionic strengths. 0.0
H
(j}
0 I
0\ 0\
-
0-,....---,
0"
<l
• - COMPUTED' BY MEANS OF EQUATION II AND THE EQUILIBRIUM
CONSTANTS IN TABLE II
3.0 I
0-
IEXPERIME~TAL
VALYES FROM I RADIOASSIAYS I I I4.0
'~·
501
I
I
~-{e)~
I
6 .0 I I I I I 'V'= ; •c--:-f.!.f \ cv - I I
3.0 2.5 2.0 1.5 1.0 0.5
-logiO [
103 ]
totFigure 4 - Graphs of solubilities of Agi03 for equilibrium solutions in which ionic strengths were fixed at 1.00 M.
0.0
H
til
(')
I
0'\
0'1
():)
1\)
[image:34.562.77.652.75.471.2]Ksp +
Agi03 (s) ( ~ Ag + I03 (3)
+ Kl
(aq.) (4)
Ag +
ro3-~ Agi03
K2
) Ag~ro
3
)2-
(5)Ag+ + 2I03
(
Formation equilibrium constants for the two iodate complexes and the equilibrium solubility product constant were
defined according to the following scheme:
Ksp
Kl
K2
where:
~
[Ag:J
fi
037
t
± 2-
(6)LAgi03(aq.l7
I
o[.Ag+7!J.037
V±
2(7)
{i\g(I03)2
-
02--!f.g~7
Lf.o372r
±2r-(8)
= activity coefficient for IO -3
::.:: activity coefficient for Agi03 (aq.)
... activity coefficient for Ag(IC3
)2-= mean ionic activity coefficient for Agi03
in the equilibrium solutions.
Brackets denote concentrations in moles/liter.
The molar concentrations of the silver bearing species were formulated as a function of the total iodate
concentra-tion and the activity coefficients for the individual species. A summation of these molarities represented the
total silver concentration in an equilibrium solution$
LA.g7 ~, the quantity determined by the radioassay. In
equat£~n form these formulations are properly represented
..
era
.~SC-ob _,
r
029
y
2Unfortunately the degree of iodate complexing in the concentration region for which it was valid to use the
interpolated activity coefficients was n~t extensive. This
fact caused the necessity for obtaining the v&lues of K1 snd
K2 from experiments where the ionic strength was constant.
It is important to note, however, that the equilibrium
solubility product constants were conveniently secured from
the data obtained for solutions in which the ionic strength varied.
Equation 5 was simplified for application to Gate taken
for constant ionic strength by ai:H~ulrd..ng t;h~t aotiv5.ty
coefficients were effectively constant anj could be included in the equilibrium constants to form a set •f th~ee concentra-tion equilibrium constRnts. The total ailver was t~en given
by~
ffiiltot
""where:
oo37tot
·- K K
2 sp
(" \ J ... ,:,;.. •""'-)
(13)
Within the limits of error of the results, this assumption
30 ISC-668
c
.
Determination of the Equilibrium Solubility Prod-uct ConstantsA form of Equation 10 that is convenient for
determin-ing equilibrium solubility product constants is given by Equation
15
below.'(_ [f.O
7
2) 1/2'( 3 tot
2
(15)
. . - 1/2
It predicts that a plot of log1o(LAi7totLI03~tot)
r
± must approach 1/2 1og10 Ksp with a small slope as Lfo3:71/2totapproaches zero.
Plots of Equation 15 for the data at the three t e
mpera-tures studied are given in Figure 5. Assay values obtained
with silver of different specific activities have been
indicated in these graphs also. The dashed lines indicate
the extrapolations to zero ionic strength and values of
the equilibrium solubility product constants are contained
in Table 10. For comparison» representat ive experimental values which were reported previously have been included.
D. Evaluation of the Formation Equilibrium Conatants
Concentration equilibrium solubility product conAtan~a,
KAJ> were obtained from the data for const_§!nt ionic st:Pengt;h
b,¥_ p1ott~ng the quantity -l og[Ag7
LT.O"J,::J'
versusLlO-;),J
l
t qt and extrapolating tototanIod~~~
concent::>at;ionof l ero. ~fiese functions have been graphed in Figure
6
.
Good extrapolations were possible since the experimental·
curvee approached the vertical axis at an extremely small
angle from the horizontal.
Equation 11 was also employed for the evaluation of
KB and K0 • By subtracting the term containing KA from