This is a repository copy of Estimating the impact of time-based road user charges on risk taking by drivers..
White Rose Research Online URL for this paper: http://eprints.whiterose.ac.uk/2107/
Monograph:
Palmer, I.A. and Bonsall, P.W. (1997) Estimating the impact of time-based road user charges on risk taking by drivers. Working Paper. Institute of Transport Studies, University of Leeds , Leeds, UK.
Working Paper 493
[email protected] https://eprints.whiterose.ac.uk/ Reuse
See Attached
Takedown
If you consider content in White Rose Research Online to be in breach of UK law, please notify us by
White Rose Research Online
http://eprints.whiterose.ac.uk/
Institute of Transport Studies University of Leeds
This is an ITS Working Paper produced and published by the University of Leeds. ITS Working Papers are intended to provide information and encourage discussion on a topic in advance of formal publication. They represent only the views of the authors, and do not necessarily reflect the views or approval of the sponsors.
White Rose Repository URL for this paper: http://eprints.whiterose.ac.uk/2107
Published paper
I.A. Palmer & P.W. Bonsall (1997) Estimating the impact of time-based road user charges on risk taking by drivers. Institute of Transport Studies, University of Leeds, Working Paper 493
ABSTRACT
This study, conducted for ethical reasons on a driving simulator, has indicated that drivers take more risks when they are being charged for their use of roadspace on the basis of time, than they do when they are not subject to such charges. This effect is highly significant for some measures of risk taking (e.g. red light violation and illegal overtaking) but less so for others. The effect is apparent even at very low charge levels and is observed irrespective of whether the charge is based on total travel time or time spent below specified speeds (‘congestion charges’). There are however some differences in the types of risky behaviour engendered by these two charging regimes. These results have obvious and serious implications for the implementation of time-based road user charges.
1 Background
An EPSRC funded research project currently underway at the Universities of Leeds and Newcastle-upon-Tyne (May et al, 1995) seeks to establish drivers’ response to road user charges and then to represent this behaviour in network models so as to estimate the impact of different charging regimes on the use of urban road networks. The project seeks to improve on the simplistic assumption, widely adopted in previous modelling work (e.g. Milne 1993, Mauchan and Bonsall 1995, Bates et al 1996), that the effect of a charge can be represented by extending the generalised cost formula to include charges valued like any other out-of-pocket cost and combined with time costs via the standard value of time.
It was hypothesised that a more accurate representation of response to charges would need to allow for the fact that road user charges might be perceived as more (or less) onerous than other out-of-pocket expenses and that this perception was likely to depend on the precise charging regime in use. For example, it is likely that the response to tolls or distance-based charges, which are fairly predictable on any given day, might differ from the response to charges based on total travel time or time spent in congestion, neither of which can be predicted precisely by the diver on any given day.
In order to gather data on these responses, a series of experiments was planned using a combination of stated preference and transfer price questionnaires, a modified version of the VLADIMIR route choice simulator (Bonsall et al, 1995) and field trials using specially equipped vehicles (Thorpe and Hills, 1997). Participants in these experiments were to be given a powerful incentive to behave as they would in real life by having any charges they incurred during the experiments deducted from the fee they were being paid for taking part!
In order to explore this issue, an extra element making use of the Leeds Advanced Driving Simulator (LADS) (Carsten and Gillimore, 1993) was added to the project. This enabled us to study, in a controlled environment, the effect of time-based charges on driving style. It is this part of our study on which we report in the current paper.
2 Experimental
Design
2.1 General
The aim of the study was to determine whether total-time or time-in-congestion-based charges (Oldridge 1991) caused a significant increase in risk taking by drivers, and if so, to determine the level of charges at which this effect becomes apparent. The experiment involved asking experienced drivers to ‘drive’ a number of times through a carefully designed LADS network.
On some journeys no road user charges were imposed whereas, on other journeys, the drivers were charged at various rates on the basis of the time taken to complete the journey or the time spent below a specified speed. They were incentivised to behave as they would in real life by having any charges incurred deducted from their participation fee. Their driving performance was closely monitored and records were kept of their own assessment of their mood and driving performance after each journey. Subsequent analysis was designed to establish whether the imposition of either of the charging regimes has any impact on driving style and whether this varied with the level of charge imposed.
2.2 The Driving Simulator
LADS comprises the shell of a Rover 216GTi saloon car positioned in front to a curved screen on to which is projected a computer generated view of the road ahead (see figure 1). The car’s controls are linked to the computer such that the projected image responds to use of the brake, steering wheel and accelerator to give the illusion of movement. The illusion is further enhanced by means of a sound generator which mimics the engine sound responding to the use of accelerator and clutch. For the current exercise an LCD screen was fixed onto the dashboard to emulate the display screen of an in-car road charging meter displaying, in real time, the credit currently remaining and whether or not charges were currently being incurred.
LADS was programmed to record the drivers’ behaviour at each of these locations: − what gap in the opposing flow would he accept at the G locations?
− would he violate the red lights at the P locations? − at what speed would he traverse the S sections?
− would he use the wrong (designated left) lane at the L locations?
− would he overtake one or both vehicles at O? and would this involve infringement of the road markings?
In addition to recording these location-specific measures, LADS was programmed to record the subjects’ overall journey time and other measures of driving style.
2.3 Experimental Procedures
Volunteer drivers with at least one year of driving experience, preferably daily car commuters, were recruited via posters placed around the university offering a fee of “about £10” for participation in study on the driving simulator. Each session lasted approximately an hour. The initial briefing session introduced the concept of road user charges and the fact that any charges incurred would be deducted from their participation fee. Volunteers were given some 10 minutes to familiarise themselves with the car’s controls and to do a short test drive.
Each driver was asked to drive the route shown in figure 2, following signposts for the station four times - each time with a different level or regime of charge imposed. The nine levels/regimes used are shown in Table 1.
Table 1: Charging Regimes and Levels used in the study
Charge Condition Regime and Level Typical charge for the 4½km journey (pence)
none 0 no charge imposed 0
low T1 3 pence per minute en route 25
medium T2 6 pence per minute en route 52
high T3 12 pence per minute en route 100
very high T4 36 pence per minute en route 300
low C1 12 pence per slow or stationary minute* 25 medium C2 24 pence per slow or stationary minute* 52 high C3 50 pence per slow or stationary minute* 100 very high C4 150 pence per slow stationary minute* 300 Note
These charges were deliberately chosen to include some which are higher than are likely to be used in practise because the ethical underpinnings of the work required us to attempt to find an effect if it existed rather than to risk having missed it because our charges were too low.
The four charge conditions presented to a given volunteer were constrained to include on free journey and the order of presentation was varied in case there was any tendency for behaviour to change as familiarity with the road layout and traffic conditions increased.
Before each journey the basis of any charge was explained to the driver and he was shown that the charge would be debited, in real time, from the credit shown on the in-car meter. (The amount of credit on the meter at the beginning of each journey was adjusted such that, irrespective of the charge rate, a typical driver would end up with approximately the same amount of credit i.e. about £2.50). The driver was then reminded that they could keep any credit remaining as a participation fee but that they would get no payment at all if they crashed the car and that they should drive as they would in real life. After each journey their attention was drawn to the amount of credit remaining on their meter and they were asked to complete a questionnaire which sought to discover their own assessment of their state of mind and the quality of their driving in the just-completed journey.
2.4 The Volunteer Sample
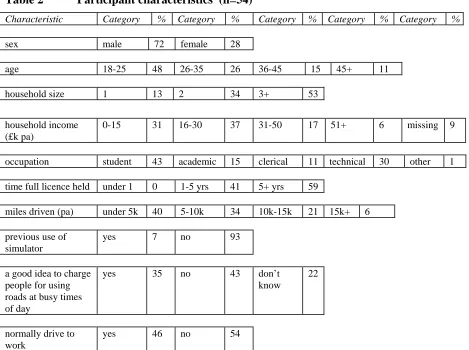
Table 2 Participant characteristics (n=54)
Characteristic Category % Category % Category % Category % Category %
sex male 72 female 28
age 18-25 48 26-35 26 36-45 15 45+ 11
household size 1 13 2 34 3+ 53
household income (£k pa)
0-15 31 16-30 37 31-50 17 51+ 6 missing 9
occupation student 43 academic 15 clerical 11 technical 30 other 1
time full licence held under 1 0 1-5 yrs 41 5+ yrs 59
miles driven (pa) under 5k 40 5-10k 34 10k-15k 21 15k+ 6
previous use of simulator
yes 7 no 93
a good idea to charge people for using roads at busy times of day
yes 35 no 43 don’t
know
22
normally drive to work
yes 46 no 54
This population is more heavily biased to young males than we had originally intended and this reflects the fact that the problem with simulator sickness was particularly apparent with older females. The resulting sample, is thus biased towards the group who are generally thought most prone to risk taking.
3 Analysis
The analysis includes cross tabulation of various indicators of risk against the different charge regimes and levels, and statistical analysis designed to determine which factors have most influence on the risk indicators.
3.1 Cross Tabulations
time-based than with congestion-time-based charges. The effect of different levels of charge may be apparent in the case of red light violation at P2 where, particularly for congestion charges, there seems to be an increased violation at higher charge levels.
[image:10.595.70.529.311.601.2]The raw data does not, however, show other effects that might have been expected. There are two reasons for this. Firstly the simple crosstabulation does not allow for the inevitable differences between the characteristics of subjects exposed to each of the charging regimes/levels. Secondly, despite the randomisation of the order in which the free journey and the various charging regimes/levels were presented, we cannot be sure that the final data set is perfectly balanced in this respect. The effect of a given charging regime/level may therefore be distorted by its having been obtained from a sample with, say an over representation of young males or from people who were driving our experimental route for the fourth time.
Table 3 Raw Cross tabulation of risk indicators against charge conditions
Risk Indicator % of subjects with specified risk factor under each charge condition (see Table 1)
0 T1 T2 T3 T4 C1 C2 C3 C4 acceptance of < 6 second gap at G1 13 25 22 12 12 38 9 7 25 acceptance of < 6 second gap at G2 28 38 35 38 29 50 41 11 54 violating red light at P1 72 75 74 54 71 62 54 67 79 violating red light at P2 26 12 26 58 38 12 27 41 42 average speed above speed limit on S1 23 9 35 29 18 15 29 38 12 average speed above speed limit on S2 56 78 92 83 50 63 83 75 75 improper use of left lane at L1 13 25 26 38 17 25 23 33 33 improper use of left lane at L2 13 25 26 38 25 25 36 30 33 overtaking first car illegally (given that he
overtook at all)
18 0 40 33 25 0 33 31 31
overtaking second car illegally (given that he overtook at all)
29 100 75 62 67 0 67 20 67
overall journey time under 9 mins 17 38 17 42 17 25 27 26 42 spending less than 1? mins at less than 11kph N/A 0 18 12 4 12 18 15 30 self-reported anxiousness after journey level* 9 0 13 21 25 12 27 11 17 self-reported anxiousness after journey* 13 25 17 38 25 38 30 18 21 self reported loss of control* 9 12 26 25 25 38 17 22 8 self reported dangerous driving* 6 25 35 42 42 25 27 41 25 Note
* Note that in each case the 5 point scale was coverted into a 0/1 variable such that 1,2,3 were classed as 0 and 4,5 were classed as 1.
3.2 Statistical Analysis
finally allowing for any effect of the charging level or regime. The procedure also allows for values of variables to be grouped where appropriate - thus if the result were affected by the subjects’ age we would have the choice of combining the four original age bands into two or three more explanatory bands - if for example the real distinction were between people aged under 26 and the rest then we could adopt a binary classification by merging the 26-35, 36-45 and 46+ band into one.
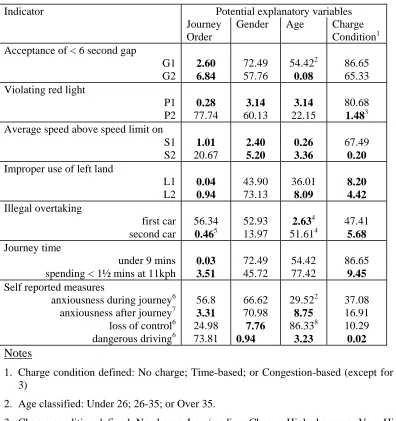
[image:11.595.68.464.280.701.2]The results of the initial chi-squared analysis are summarised in Table 4. The values in bold type are significant (at 10%) and the variables in question were therefore taken forward into the sequential logistic regression. We note that for all behaviours, except gap acceptance, the chi-squared analysis showed at least one significant effect for the charge condition.
Table 4 Results of initial Pearson chi-squared analysis.
Indicator Potential explanatory variables
Journey Order
Gender Age Charge Condition1 Acceptance of < 6 second gap
G1 2.60 72.49 54.422 86.65 G2 6.84 57.76 0.08 65.33 Violating red light
P1 0.28 3.14 3.14 80.68 P2 77.74 60.13 22.15 1.483 Average speed above speed limit on
S1 1.01 2.40 0.26 67.49 S2 20.67 5.20 3.36 0.20 Improper use of left land
L1 0.04 43.90 36.01 8.20 L2 0.94 73.13 8.09 4.42 Illegal overtaking
first car 56.34 52.93 2.634 47.41 second car 0.465 13.97 51.614 5.68 Journey time
under 9 mins 0.03 72.49 54.42 86.65 spending < 1½ mins at 11kph 3.51 45.72 77.42 9.45 Self reported measures
anxiousness during journey6 56.8 66.62 29.522 37.08 anxiousness after journey7 3.31 70.98 8.75 16.91 loss of control6 24.98 7.76 86.338 10.29 dangerous driving6 73.81 0.94 3.23 0.02 Notes
1. Charge condition defined: No charge; Time-based; or Congestion-based (except for P2 - see note 3)
2. Age classified: Under 26; 26-35; or Over 35.
3. Charge condition defined: No charge; Low/medium Charge; High charge; or Very High charge.
4. Age classification: Under 36 or 36 and over.
5. Journey order classified: J1-J2; or J3-J4.
7. point scale compressed to a binary variable: 1,2, coded as 1; and 3, 4,5 coded as 2
8. Age classified: Under 36; 36 to 45; or 46 and over.
The models are defined by means of a base effect plus other effects as specified. Generally, the base assume that the subjects were male, in our youngest age group (under 26) , were making their first journey in the experiment and were not being charged. For some analyses the definition of the base has been extended and this has been indicated by a ‘b’ in the appropriate cell of Table 5. Thus in the analysis of P2 red light violation low and medium charges have also been included in the base.
In deciding whether, and in what form, to include a variable in the model we determined that a variable would be included if the consequential reduction in deviance significantly improved the model. A critical value of 20% has been used for this because of our wish to avoid type II errors - we did not wish to risk missing any effect that there might be.
The “factor of odds for charge” indicates the degree to which the probability of making the risky manoeuvre is increased when the specified charges are applied, thus the factor of 1.32 for the G1 gap acceptance indicates that people who are being charged are 1.32 times more likely to accept a gap of less than 6 seconds than those who are being charged.
The deviances and probabilities quoted in the right hand part of the table are calculated after allowing for the effect of variables already entered into the model - the order of entry having been determined by the relative significance revealed by the chi-squared analysis reported in Table 4.
The probabilities in the right hand side of the table indicate the probabilites that the incremental effect occurred by chance. As a basic measure of goodness-of-fit statistic we have presented the initial log likelihood function, the final model likelihood and the residual degrees of freedom for each model. A model is generally considered as adequate if the residual likelihood is equal to the degrees of freedom.
A number of interesting observations can be made about the results contained in Table 5 but we restrict ourselves here to those which have a bearing on our experiment.
admit to having felt anxious but less likely to admit having driven dangerously. The subjects’ gender has a significant impact on their likely to admit having dangerously. The subjects’ gender has significant impact on their risk taking behaviour in three situations: the red light violation at P1, where females were more likely to be at fault and exceeding the speed limit at S1 and S2, where females were less likely to be at fault. Gender also seems to affect the likelihood of their admitting to having lost control of the vehicle (the females report this more than do the males).
Turning now to the effect of charge levels and regimes; a number of conclusions can be drawn from the results of the logistic regression.
− Firstly, we find in almost every case that, after allowing for the effect of the confounding variables, the imposition of time-based or time-in-congestion-based charges is associated with an increased in the risk factor; in most cases the probability of risky behaviour is more doubled (see “factor of odds” column in Table 5).
− Secondly, the effect of imposing charges is (from Table 5) highly significant (p<1%) in the case of:
• admitting having driven dangerously • red light violation at P2
• exceeding the speed limit at S2 • misuse of the left lane at L2 significant (p<5%) in the case of: • misuse of the left lane at L2 • illegally overtaking the second car
• admitting to feeling anxious after the journey • admitting to having lost control of the vehicle • completing the journey in less then 9 minutes
− Thirdly, the increases are, in almost every case, apparent even at the lowest charge rates and in most cases it is not possible to distinguish statistically between the effect of different charge rates - the exception is the red light violation at P2 which is significantly more likely to occur with high and very high charges than it is with medium or low charges or with no charges at all.
reduce their time spent queuing. Table 6, on the same format as Table 5, shows models with separate effects for based and in-congestion charges. We note that time-based charging has higher coefficients for:
• exceeding the speed limit at S2 (significant at p<1%) • illegally overtaking the second car (significant at p<10%) • exceeding the speed limit at S1
while time-in-congestion-based charging has coefficients for: • misuse of left lane at L1
• misuse of left lane at L2
4
Disussion and Conclusions
Our work has suggested that drivers are indeed likely to take more risks when being charged on the basis of their overall journey time or the time they spend in congestion than they do when not subject to such charges. This effect seems to be apparent even at very modest charge levels. It is of course conceivable that subjects will drive with less care in a simulator than they would in real life. Even though they had been instructed to drive normally and were told that this was crucial to the success of research project, and even though they stood to lose face, to lose their participation fee and to suffer our displeasure, they may have felt that the consequences of an accident would be less severe in the simulator than it would be in real life.
We would not therefore wish to claim that the absolute levels of risk taking which we have observed in the simulator would be replicated in real life but we do suggest that the relative levels associated with the no-charge and charge conditions in the simulator will be indicative of their relative levels in real life. We must conclude, therefore, that the increased levels of risk-taking which we have found in the simulator under various time-based and congestion-based charging regimes strongly suggest that risk taking would increase among drivers exposed to such charges in the real world.
Our results suggest that dangerous behaviour may be engendered even at quite modest charge levels. Had the effects only become apparent at the highest levels then it would have been possible to avoid them simply by avoiding such high charges.
On the basis of our result it was decided that it would not be ethical to include any time-based or congestion-based charges in our Newcastle field trials. The result may be of interest to others contemplating similar trials elsewhere.
A detached academic observer might regret that this evidence has come to light because economic theory set our, for example, by Johansson and Matsson 1995), and previous modelling work (see for example Smith et al 1994) had indicated that, given perfect knowledge of charges, greater efficiencies were to be achieved by congestion charging or time-based charging than could be achieved by simple tolls or distance based charging. Our results, along with more realistic assumptions about prior knowledge of charges, will clearly tip the balance more in favour of distance-based charges or tolls. However, there may be circumstances in which tolls or distance charging could also engender risky behaviour. For example, if such charges were to vary by time of day (in order to dissuade people from travelling at those times), an incentive would exist to drive quickly so as to get past the charge area before the charge increases.
Acknowledgements
REFERENCES
Bates, J, Williams, I, Coombe, D, and Leather, J (19960, The London Congestion Charging Research Programme: 4. The transport models, Traffic Engineering and Control, 37(5), May 1996, pp.334-339.
Bonsall, PW, Ckarke, R, Firmin PE, and Palmer, IA (1994) VLADIMIR and TRAVSIM - powerful tools for route-choice research, Proc. European Transport Forum, Seminar H, PTRC, London, pp 65-76.
Carsten, OMJC, and Gallimore, S (1993), The Leeds driving simulator: anew tool for research in driver behaviour, Proceedings of the 5th International Conference on Vision in Vehicles, Glasgow.
Johansson, B, and Matsson, LG (editors) (1995), Road Pricing: Theory, Empirical Assessment and Policy, Kluwer Academic Publishers, Mass., USA.
Mauchan, AJ, and Bonsall, PW (19950), Model predictions of the effects of motorway charging in West Yorkshire, Traffic Engineering and Control, 36 (40), April 1995, pp. 206-212.
May, AD, Bonsall, PW, and Hills, PJ (1995), ‘Evaluating Driver Response to Road-User Charging Systems’, Unpublished Case for Support submitted to EPSRC.
Milne, D, (1993), The network effects of alternative road user charging systems, Proc. European Transport Forum, Seminar F, UMIST, PTRC, London, pp. 91-102
Oldridge, B (1991), Road Transport and the Limits of Growth, European Infrastructure Development, pp. 115-118, Sterling Publications International Ltd, London
Smith MJ, May AD, Wisten, MB, Milne, DS, Van Vliet, D, and Ghali, MO (1994), Comparison of the network effects off four Road-User Charging Systems,
Traffic Engineering and Control, 35 (5), May 1994, pp. 311-315.