This is a repository copy of
Work Journey Rescheduling – Model Development Analysis.
.
White Rose Research Online URL for this paper:
http://eprints.whiterose.ac.uk/2373/
Monograph:
Montgomery, F.O. and May, A.D. (1983) Work Journey Rescheduling – Model
Development Analysis. Working Paper. Institute of Transport Studies, University of Leeds ,
Leeds, UK.
Working Paper 167
[email protected] https://eprints.whiterose.ac.uk/
Reuse
See Attached
Takedown
If you consider content in White Rose Research Online to be in breach of UK law, please notify us by
White Rose Research Online
http://eprints.whiterose.ac.uk/
Institute of Transport Studies
University of Leeds
This is an ITS Working Paper produced and published by the University of
Leeds. ITS Working Papers are intended to provide information and encourage
discussion on a topic in advance of formal publication. They represent only the
views of the authors, and do not necessarily reflect the views or approval of the
sponsors.
White Rose Repository URL for this paper:
http://eprints.whiterose.ac.uk/
2373/
Published paper
Mongtomery, F.O. and May, A.D. (1983)
Work Journey Rescheduling – Model
Development Analysis.
Institute of Transport Studies, University of Leeds,
Working Paper 167
Working Paper167
-May
1983
WORK JOURNEY RESCHEDULING ' MODEL DEVELOPMENT AND
m e s I s
F. 0. Montgomery and A. D. M a y
. . . . . . ~ . .
F. 0 . Montgomery and A. D. May (1983) Work journey rescheduling: model development and a n a l y s i s . Leeds: University of Leeds, I l l s t . Transp. Stud., WP 167 (unpublished
1.
Using Wakefield a s a case study, a method
was
developed of t e s t i n g t h e e f f e c t s on t r a f f i c of s e v e r a l d i f f e r e n t work journey rescheduling s t r a t e g i e s . The method c o n s i s t e de s s e n t i a l l y of assigning a s e r i e s of s i x 0-D matrices t o t h e Wakefield network, each matrix r e p r e s e n t i n g t h e t r i p s f o r consecutive 1 5 minute periods over t h e morning peak. The s i x m a t r i c e s were obtained by f i r s t l y disaggregating t h e la hr peak matrix by purpose ( i n t o home-based work,
commercial v e h i c l e , and o t h e r t r i p s ) and t h e n disaggregating each of t h e s e t h r e e m a t r i c e s by time. This temporal
disaggregation was based, f o r t h e home based work t r i p s , on employee a r r i v a l p r o f i l e s by zone, and f o r t h e CV and other t r i p s on cordon crossing p r o f i l e s . The d i f f e r e n t s t r a t e g i e s were modelled by making adjustments t o t h e parameters of t h e employee a r r i v a l p r o f i l e s .
CONTENTS
Abstract
1. INTRODUCTION
1.1 Background
1 . 2 The study approach 1 . 3 The study a r e a
1 . 4
Model o u t l i n e 1 . 5 Report o u t l i n e2. EMPLOYEE ARRIVAL PROFILES
2 . 1 Introduction 2.2 Data
2.3 Need f o r a model 2.4 Form of t h e model 2.5 C a l i b r a t i o n
2.6 R e s u l t s of c a l i b r a t i o n 2.7 C l a s s i f i c a t i o n of curves
2.8 Extension t o firms not surveyed i n Stage 2
3. MATRIX DISAGGmGATION
3.1 Introduction
3.2 0-D d a t a a v a i l a b l e
3.3 Zoning, network and cordons
3.4 Modifying t h e initial 0-D matrices 3.5 Required form of d a t a
3.6
Outline of proposed method3.7 Disaggregating t h e t o t a l 0-D matrix by purpose 3.8 Temporally disaggregating t h e
HBW
p r i v a t e matrix3.9 Temporally d i saggregating t h e "other" p r i v a t e v e h i c l e matrix
3.10 Temporally disaggregating t h e CV matrix
4.
SATURN MODIFICATIONS AND APPLICATION4 . 1
Introduction 4.2 SATURNQ5. CfiIBRATION, VALIDATION AND STRATEGY FORMULATION
5 . 1
Recapitulation 5.2 C a l i b r a t i o n Runs 5.3 Validat ion5.4
S t r a t e g y Formulation6.
CONCLUSIONS ON OUTSTANDING MODELLING ISSUES7.
REFERENCESAPPENDICES
A. Summary of SIC Orders
B. Requirements of a Model t o Test t h e Response t o Work Journey Rescheduling P o l i c i e s
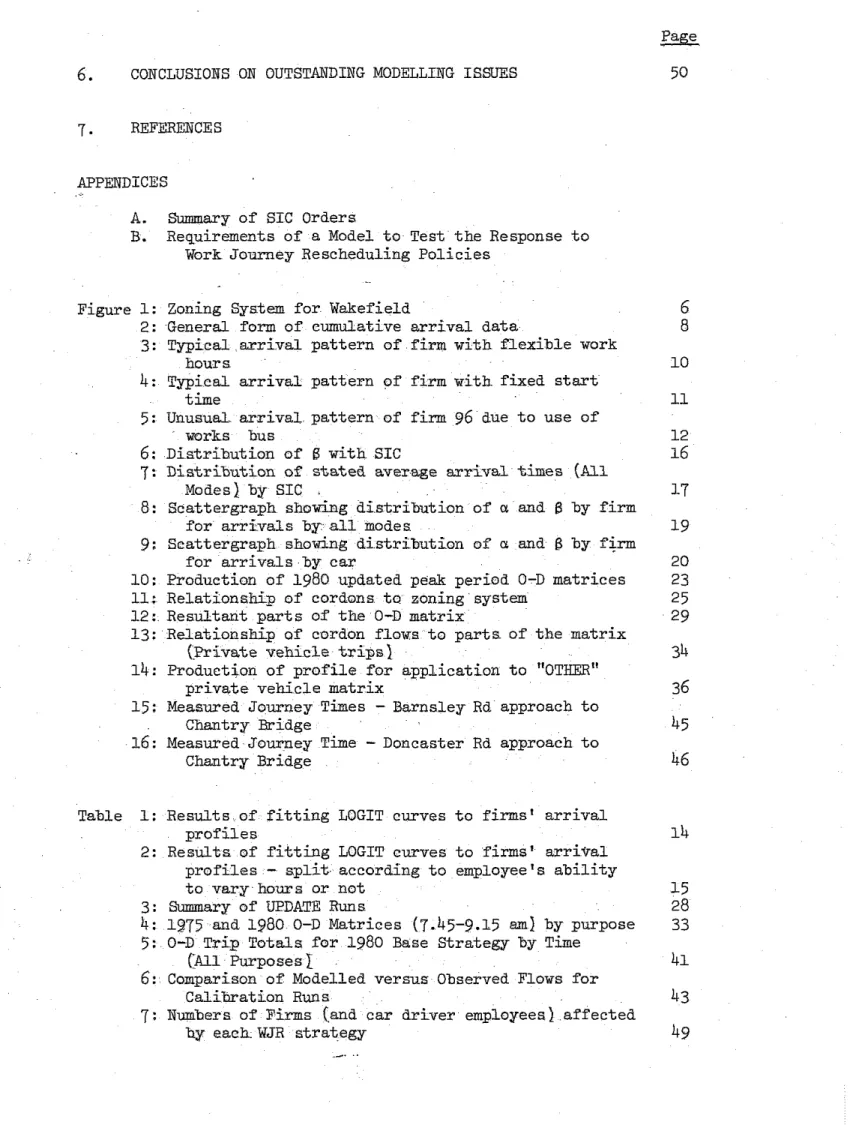
Figure 1: Zoning System f o r Wakefield
2: General form of cumulative a r r i v a l d a t a
3:
Typical a r r i v a l p a t t e r n of f i r m w i t h f l e x i b l e work hours4:
Typical a r r i v a l p a t t e r n of f i r m w i t h fixed s t a r t time5:
Unusual a r r i v a l p a t t e r n of firm 96 due t o use of works bus6:
D i s t r i b u t i o n of 8 with SIC7:
D i s t r i b u t i o n of s t a t e d average a r r i v a l times ( A l l Modes) by SIC8: Scattergraph showing d i s t r i b u t i o n of
a
and8
by f i r m f o r a r r i v a l s b y a l l modes9: Scattergraph showing d i s t r i b u t i o n of a and
8
by firm f o r a r r i v a l s by c a r1 0 : Production of 1980 updated peak period 0-D matrices
11: Relationskip of cordons t o zoning system 12: Resultant p a r t s of t h e 0-D matrix
13:
Relationship of cordon flows t o p a r t s of t h e matrix ( P r i v a t e v e h i c l e t r i p s )1 4 :
Production of p r o f i l e f o r a p p l i c a t i o n t o "OTHXR" p r i v a t e v e h i c l e matrix15: Measured Journey Times
-
Barnsley Rd approach t o Chantry Bridge16:
Measured Journey Time-
Doncaster Rd approach t o Chantry BridgeTable 1: R e s u l t s of f i t t i n g LOGIT curves t o f i r m s ' a r r i v a l p r o f i l e s
2: R e s u l t s of f i t t i n g LOGIT curves t o f i r m s ' a r r i v a l p r o f i l e s
-
s p l i t according t o employee's a b i l i t y t o v a r y hours o r not3: Summary of UPDATE Runs
4:
1975 and 1980 0-D Matrices (7.45-9.15 am] by purpose 5: 0-D T r i p T o t a l s f o r 1980 Base S t r a t e g y by Timerfil
Purposes16:
Comparison of Modelled v e r s u s Observed Flows f o rCalibration R u n s
7:
Numbers of Firms (and c a r d r i v e r employees) a f f e c t e d1. INTRODUCTION
1.1 Background
This paper p r e s e n t s t h e a n a l y s i s method adopted f o r a study c a r r i e d out f o r t h e Department of !Cransport, t h e o b j e c t i v e s of which were
( 1 ) To study t h e p r e s e n t p a t t e r n and d i s t r i b u t i o n of journeys t o and from work i n Wakefield, and t h e c o n s t r a i n t s imposed by employers, unions, domestic conditions, and
( 2 ) To study t h e p o t e n t i a l r o i e of i n c e n t i v e s i n encouraging change on journey timing, and t h e p o s s i b l e c o s t s and b e n e f i t s which would a r i s e .
The morning and evening peak i n t r a f f i c l e v e l s i n urban a r e a s give r i s e t o s e v e r a l problems. High l e v e l s of car use cause congestion and l e a d t o increased delays and u n r e l i a b i l i t y t o c a r , bus and commercial v e h i c l e u s e r s , and increased c o s t s t o t h e i r operators. They a l s o encourage use of environmentally s e n s i t i v e r o u t e s t o avoid congestion.
High l e v e l s of bus and r a i l use i n c r e a s e t h e l e v e l of discomfort on public t r a n s p o r t and t h e chance t h a t waiting times
w i l l
i n c r e a s e because buses or t r a i n s a r e f u l l . Peak demands determine t h e l e v e l a t which t r a n s p o r t capacity i s provided; new roads t o a l l e v i a t e congestion w i l lo f t e n only be f u l l y used during t h e peak periods; equally a l a r g e proportion of urban public t r a n s p o r t v e h i c l e s and s t a f f a r e required s o l e l y f o r t h e peak and a r e i d l e a t other times.
The spreading of morning and evening peak t r a v e l demands i s f r e q u e n t l y advocated a s a means of a l l e v i a t i n g t h e s e problems and a s an a l t e r n a t i v e t o l e s s p a l a t a b l e congestion reducing measures such a s road c o n s t r u c t i o n o r r e s t r a i n t . The most obvious w a ~ i n which t h i s can be achieved i s by removing, o r modifying t h e requirement on i n d i v i d u a l s t o t r a v e l a t p a r t i c u l a r times. Since work journeys predominate i n t h e peaks t h e emphasis has been on employees' hours, which have been modified by t h e i n t r o d u c t i o n of b o t h staggered and f l e x i b l e working hours. There h a s a l s o been some i n t e r e s t i n modification of school and shop opening hours t o
1978)) can a l l be expected t o have some e f f e c t . So, a s i n d i c a t e d by experience i n York, can a reduction i n highway c a p a c i t y , s i n c e it
i n e v i t a b l y causes more congestion i n t h e peak t h a n a t o t h e r times (Dawson,
1979 )
.
While spreading of peak demand can have obvious b e n e f i t s , it i s not
without i t s drawbacks. Increased demand immediately o u t s i d e t h e peak may add t o delays and t r a v e l c o s t s then, and may c o n f l i c t with o t h e r t r a v e l requirements. It may a l s o c o n f l i c t with t r a n s p o r t o p e r a t o r s ' need f o r
some spare off peak capacity f o r such a c t i v i t i e s a s road and v e h i c l e maintenance. Choice of mode may a l s o change; peak period bus u s e r s could conceivably be a t t r a c t e d t o c a r use outside t h e peak because d r i v i n g
conditions were e a s i e r o r c a r s more r e a d i l y a v a i l a b l e and c a r sharing could perhaps be made more d i f f i c u l t i f p o t e n t i a l s h a r e r s 1 working hours change.
Perhaps t h e g r e a t e s t drawback, however, i s t h e l a c k of information on t h e s c a l e of e f f e c t s of d i f f e r e n t s t r a t e g i e s f o r spreading t h e peak, without which it i s d i f f i c u l t t o p r e d i c t t h e e f f e c t s of t r a n s p o r t a u t h o r i t i e s 1
a c t i o n s o r , equally importantJy, t o know how t r a n s p o r t demands w i l l change
if employers introduce f l e x i b l e working hours t o an i n c r e a s i n g extent.
Some information i s a v a i l a b l e on t h e changes r e s u l t i n g from t h e i n t r o d u c t i o n of staggered working hours ( S e l i n g e r , 1 9 7 6 ) , f l e x i b l e working hours
(Safavian and McLean, 1975, Department of Transport, 1977). a r e a l i c e n s i n g (Watson, 1978) and c a p a c i t y reductions ( ~ a w s o n , 1979) but t h i s information
i s o f t e n incomplete and more importantly, t h e r e i s no information on t h e causal process by which t r a v e l l e r s s e l e c t any p a r t i c u l a r changed time t o t r a v e l .
The current p r o j e c t was designed t o c a s t more l i g h t on t h i s i s s u e by i d e n t i f y i n g t h e f a c t o r s influencing time of t r a v e l ( i n terms of c o n s t r a i n t s a t workplace and home, and c o s t s of t r a v e l ) estimating t h e changes i n time of t r a v e l which would be made if t h e s e c o n s t r a i n t s or c o s t s were modified, and p r e d i c t i n g t h e e f f e c t s on t h e t r a n s p o r t system of such changes.
1.2 The study approach
Early work on t h e d e v e l o p e n t of t h e form of model necessary t o cover t h e behavioural a s p e c t s of t h e o b j e c t i v e s ( a s o u t l i n e d i n Appendixg )
Rather than attempt t o simulate t h e response of firms and t h e i r
employees t o d i f f e r e n t types of work journey rescheduling s t r a t e g y , t h e study makes t h e simplifying assumption t h a t employees' responses t o
d i f f e r e n t s t r a t e g i e s w i l l be s i m i l a r i n s i m i l a r t y p e s of f i r m , and uses t h e p a t t e r n s of response t o e x i s t i n g arrangements i n Wakefield (May e t a1 1981) t o estimate t h e s e responses. It then considers s i x s t r a t e g i e s
( i ) a base s t r a t e g y r e p r e s e n t i n g c u r r e n t conditions
( i i ) a 'backwards looking' s t r a t e g y i n which all firms work f i x e d hours, t o t e s t t h e e f f e c t s of t h e l e v e l of rescheduling which has already occurred
( i i i ) a ' r e a l i s t i c f l e x i b l e hours' s t r a t e g y i n which h a l f t h e firms f o r whom f l e x i b l e o r i n t e r n a l staggered hours a r e f e a s i b l e , b u t which a r e c u r r e n t l y on f i x e d hours, reschedule t h e i r a c t i v i t i e s
( i v ) a ' r e a l i s t i c e x t e r n a l staggering' s t r a t e g y i n which h a l f t h e firms on f i x e d hours who a r e unable t o introduce f l e x i b l e hours, but have s t a r t times near t h e peak, have t h e i r s t a r t times rescheduled
(v) a ' r e a l i s t i c rescheduling' s t r a t e g y representing a combination of
(iii) and ( i v )
( v i ) a 'maximum e f f e c t ' s t r a t e g y i n which a l l firms i n ( i i i ) and ( i v ) reschedule t h e i r operations.
The e f f e c t s on t r a f f i c p a t t e r n s a r e then modelled i n d e t a i l t o provide four
d i f f e r e n t l e v e l s of response of t h e hi&way system. The question of which l e v e l of response i s most l i k e l y i s not answered, but t h e r e s u l t s serve t o i n d i c a t e t h e importance t o be placed on obtaining a c l e a r e r understanding of t h e behavioural processes which would determine t h e response.
1.3
The study a r e aIt was decided t o base t h e study on Wakefield, which has been i d e n t i f i e d a s l i k e l y t o b e n e f i t from peak spreading (Wytconsult, 1976). It was f u r t h e r decided t o concentrate on morning peak period work t r i p s by p r i v a t e c a r , because
1 ) o r i g i n d e s t i n a t i o n d a t a was a v a i l a b l e f o r t h e study a r e a f o r t h e a.m. peak period only
2) work t r i p s predominate i n t h e a.m. peak and appear t o be more amenable
t o spreading t h a n education t r i p s (Wytconsult, 1977)
1 . 4
Model o u t l i n ePerhaps t h e e a s i e s t way t o understand t h e model i s t o consider t h e process i n reverse. The required f i n a l output (flows on l i n k s , journey times, o v e r a l l network performance measures) i s produced by means of a
modified version of SATURN ( &TUF~NQ) which i s an assignment-simulation. model designed f o r t e s t i n g t h e e f f e c t s of t r a f f i c management schemes on urban networks. The b a s i c i n p u t s t o t h e modified v e r s i o n of SATURN a r e t h e network coding, and a s e t of o r i g i n - d e s t i n a t i o n matrices one f o r each of s i x q u a r t e r hour periods covering t h e
1 2
hour morning peak.These matrices a r e not simply s c a l e d down versions of t h e t o t a l peak period matrix, because t h e d i s t r i b u t i o n of t r i p purposes changes over t h e peak. Rather t h e y were produced by f i r s t l y disaggregating t h e t o t a l peak period matrix i n t o purpose groups, and then f a c t o r i n g each purpose-matrix i n t o i t s quarter-hour components. The f a c t o r s f o r work t r i p s were obtained by c a l i b r a t i n g curves ( o r p r o f i l e s ) t o t h e a r r i v a l p a t t e r n s of employees, and f o r o t h e r groups of t r i p s by using a combination of t h e s e work t r i p f a c t o r s , and f a c t o r s obtained from cordon counts.
1 . 5 Report o u t l i n e
Chapter 2 d e s c r i b e s i n d e t a i l how t h e a r r i v a l p r o f i l e s of employees were obtained and Chapter 3 describes how t h e s e and o t h e r p r o f i l e s were used t o a i s a g g r e g a t e t h e 0-D matrices. Subsequent chapters then describe t h e modification and a p p l i c a t i o n of SATURN, t h e c a l i b r a t i o n and v a l i d a t i o n of i t s output.
*
2. EMPLOYEE ARRIVAL PROFILES
2 . 1 Introduction
This chapter d e s c r i b e s t h e process by which t h e d i s t r i b u t i o n s of
employee a r r i v a l times were obtained f o r d i f f e r e n t t y p e s of firm with d i f f e r e n t t y p e s of work schedules. These ' a r r i v a l p r o f i l e s 1 were used t o disaggregate t h e peak period t r i p matrix f o r t h e 'base1 s t r a t e g y and were assumed t o be t r a n s f e r a b l e t o s i m i l a r types of firm when t h e y were r e q u i r e d ,
i n any of t h e o t h e r s t r a t e g i e s , t o change t h e i r work schedules. Thus t h e a r r i v a l p r o f i l e f o r a f i r m i n Standard I n d u s t r i a l C l a s s i f i c a t i o n (SIC) 27
which t r a n s f e r r e d t o f l e x i b l e hours i n t h e ' r e a l i s t i c rescheduling' s t r a t e g y was assumed t o be t h e average p r o f i l e of t h o s e SIC 27 firms
-.
2.2
-
DataWP
150 (Report of surveys) gives full d e t a i l s of t h e r e l e v a n t surveys.B r i e f l y , questionnaire surveys were c a r r i e d out among employers ( s t a g e 1)
and employees (Stage 2 ) over a range of firms i n t h e c e n t r a l and intermediate a r e a s of Wakefield. The primary aim was t o o b t a i n a s much information as
possible about t h e a r r i v a l p a t t e r n s of firms i n t h e c e n t r a l a r e a (Zones 1-11
& 1 6 ) (Fig. 1
.
However poor response among some employment c a t e g o r i e s l e d us t o survey some intermediate a r e a firms a s a proxy f o r t h e i r c e n t r a la r e a counterparts.
Stage 1 d a t a c o n s i s t s of d e t a i l s of t h e f i r m s ' l o c a t i o n , SIC group, and t h e number of persons working i n t h e firm, c l a s s i f i e d by type of work hours ( f i x e d , f l e x i b l e , r o t a t i n g s h i f t s o r staggered h o u r s ) . The s t a r t and f i n i s h times of each s h i f t a r e a l s o g i v e n (ranges i n t h e c a s e of f l e x i b l e hours).
Stage 2 data, which i s a v a i l a b l e f o r only a proportion of t h e Stage 1
firms, c o n s i s t s of d e t a i l s of t h e employee's journey t o work, including modes used, journey times, times of a r r i v a l over a week, and whether t h e respondent i s a b l e t o vary h i s / h e r a r r i v a l time from day t o day.
The main input t o t h e modelling process described h e r e consisted of t a b u l a t i o n s of t h e Stage 2 d a t a using SPSS. Tabulations were produced of t h e number of respondents a r r i v i n g by f i r m by 5-minute period (within t h e range 7.00 a.m.
-
10.15 a.m. ). The t a b u l a t i o n s were run f o r those a b l e t o vary t h e i r work hours from day t o day, and ( s e p a r a t e l y ) f o r t h o s e not a b l e t o do so; and f o r t h o s e a r r i v i n g a s c a r d r i v e r a s well a s a l l modes.2.3 Need f o r a model
Even if d a t a had been a v a i l a b l e on t h e arrival times of a l l employees
i n a l l firms, it would s t i l l have been u s e f u l t o construct a model r a t h e r than use t h e a c t u a l d a t a a s input f o r t h e following reasons:
1) Reported a r r i v a l times a r e o f t e n c l u s t e r e d around e a s i l y remembered times such a s 8.30, 8.45 e t c . , giving t h e i l l u s i o n of l i t t l e peaks within t h e main peak. A s u i t a b l e model f i t t e d t o t h e d a t a smooths
out t h e s e peaks.
2 ) The use of an a n a l y t i c a l function i n t h e model enables t h e a r r i v a l p a t t e r n s t o be represented much more s u c c i n c t l y
-
by 2 parametersr a t h e r than one per time s l i c e .
<. .
NOT TO SCALE
K E Y :
-.-
Central Area boundary@
Barnsley Road----
Intermediate Area boundary-
M a i n roads@
Doncaster Road.
.
.
.
.
.
.
.
.
Railways- .
@
Westgateexamine and a l t e r i n d i v i d u a l firms' p a t t e r n s when t e s t i n g s t r a t e g i e s .
Data i s a v a i l a b l e f o r only a proportion of firms however, so t h a t t h e
model must a l s o be used t o estimate t h e a r r i v a l p a t t e r n s of t h o s e firms f o r which no d a t a i s a v a i l a b l e . This process e n t a i l e d examining t h e parameters of t h e fixed a r r i v a l p a t t e r n s t o s e e whether and how t h e y were r e l a t e d t o p o t e n t i a l c l a s s i f i c a t o r y v a r i a b l e s such a s S I C . The r e s u l t s of t h i s process a r e described l a t e r .
2.4 Form of t h e model
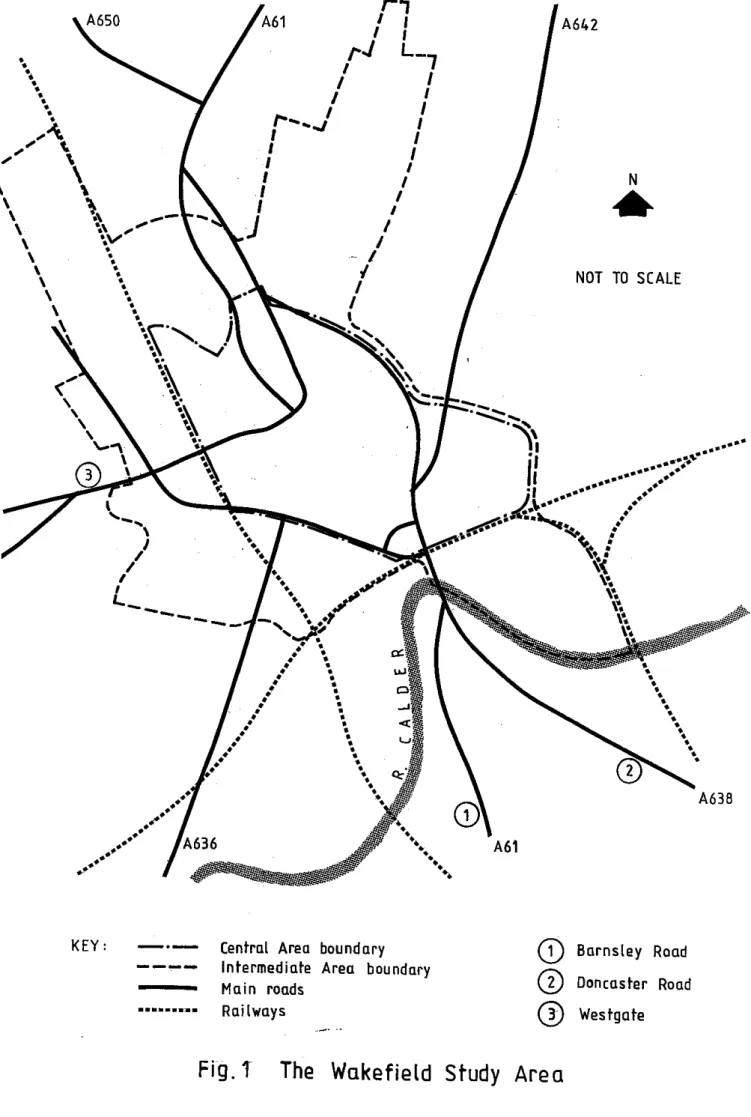
F i r s t l y , r a t h e r t h a n model t h e a c t u a l numbers a r r i v i n g i n each time period, it was decided t o model t h e cumulative p a t t e r n , i . e . t h e proportion
a r r i v e d by a given time, expressed a s a percentage of t h e t o t a l a r r i v a l s i n t h e period modelled (7.00
-
10.15 a.m. ), See Fig. 2.The modelling process then r e s o l v e s i t s e l f i n t o a c u r v e - f i t t i n g e x e r c i s e . That i s , t h e form of curve t o be used i s decided simply on t h e b a s i s of how w e l l it f i t s t h e d a t a and conforms t o t h e c o n s t r a i n t s p r e s e n t l y
s e t o u t , and i s not based on any behavioural assumptions. There i s indeed scope f o r f u t u r e r e s e a r c h t o develop such a behavioural model.
There i s only one c o n s t r a i n t on t h e f i t t e d curve, and t h a t i s t h a t
it must be non-decreasing ( i . e . it i s impossible f o r l e s s people t o have a r r i v e d a t time t
+
1 t h a n a t time t ) .Various forms of curve were attempted including polynomials, cubic s p l i n e s and l o g i t , and t h e l a t t e r was chosen because 1) it was t h e only one c o n s i s t e n t l y t o s a t i s f y t h e forementioned c o n s t r a i n t ; 2 ) it i s defined by
only two parameters a s opposed t o
4
o r5
f o r t h e o t h e r forms; 3 ) t h e function i s e a s i l y c a l c u l a b l e by computer.(Note t h a t t h e cumulative normal curve could have been used and would s a t i s f y 1 and 2 above, but i s not so e a s i l y c a l c u l a b l e ).
The form of t h e function chosen i s t h u s
where x = time i n minutes a f t e r midnight y = estimated
%
a r r i v e d b y t i m e x e = base of n a t u r a l l o g sa , 8
a r e parameters t o be c a l i b r a t e d . - .2.5 C a l i b r a t i o n
The parameters a &
6
were determined f o r each s e t of d a t a p o i n t s a s follows :eqn ( 1 ) becomes
Taking l o g s ; -B(x-a)
=
l n ( ( 1 0 0-
y ) / y )O r : l n ( (100
-
y ) / y ) = -Bx + Ba. . .
.
..
( 2 )Eqn ( 2 ) i s a l i n e a r equation with a b s c i s s a = x and o r d i n a t e =
l n ( (100-Y
)/Y).
Thus t h e b e s t s t r a i g h t l i n e f i t t e d through t h e transformed d a t a p o i n t s has slope = -6 and i n t e r c e p t=
Ba.(note t h a t only t h o s e values .of y g r e a t e r than 0 and l e s s than 100 a r e used i n t h e c a l i b r a t i o n . )
The advantage of t h i s method of c a l i b r a t i o n i s i t s s i m p l i c i t y and
robustness. However it s u f f e r s from t h e disadvantages t h a t 1 ) a goodness of f i t s t a t i s t i c
i s
a v a i l a b l e only f o r t h e transformed d a t a , and cannot be t r a n s f e r r e d t o t h e o r i g i n a l d a t a ; 2 ) d a t a p o i n t s close t o y = 0 o r y = 100 tend t o e x e r t a s t r o n g e r influence than t h e y should on t h e r e s u l t .2.6 Results of c a l i b r a t i o n
A program was w r i t t e n t o c a r r y out t h e c a l i b r a t i o n f o r each d a t a set
and a l s o t o p l o t t h e d a t a and t h e f i t t e d curve. Examples of t h e output a r e shown i n Figs. 3 and
4.
It w i l l be seen t h a t t h e form of t h e d a t a c o n s i s t s of a f l a t s e c t i o n (during which t h e r e a r e no a r r i v a l s ) followed by a curveds e c t i o n ( r e p r e s e n t i n g t h e a r r i v a l s ) , followed by another f l a t s e c t i o n (during which t h e r e a r e no f u r t h e r a r r i v a l s ) . The program automatically
f i t s a l o g i t curve t o t h o s e p o i n t s where ( 0 < y < l o o ) , and g i v e s a s output t h e c a l i b r a t e d range and c o e f f i c i e n t s of t h e curve.
Examination of t h e g r a p h i c a l output f o r each d a t a s e t g r e a t l y aided t h e decision whether t o accept or r e j e c t t h e f i t t e d curve a s being
Legend
:survey d a t a
f i t t e d l i n e
420 440
460
4 8 0
500
520
5 4 0
560
580
600
Period ending (mins a f t e r midnight)
Legend
:survey d a t a
' f i t t e d line
Legend
:survey d a t a
f i t t e d line
420 4 4 0
4 6 0
4 8 0
500
520
5 4 0
560
580
600
Period ending (mins a f t e r midnight)
The problem of how t o r e p r e s e n t t h i s type of a r r i v a l p a t t e r n i s worthy of f u r t h e r i n v e s t i g a t i o n , but a s i n t h i s study we a r e concerned primarily with a r r i v a l s by c a r t h e problem need not concern us f u r t h e r .
Tables 1 and 2 t h e n , show t h e r e s u l t s of c a l i b r a t i n g t h e curves. Table 1 shows t h e r e s u l t s f o r each firm, both f o r c a r a r r i v a l s and f o r all
modes. Table 2 r e f e r s t o t h o s e firms where t h e proportion of employees
a b l e t o vary t h e i r work hours i s not close t o 0 o r 1. Table 2a shows f o r t h e s e firms, t h e r e s u l t s of c a l i b r a t i n g curves a g a i n s t only t h e a r r i v a l times of t h o s e employees who can vary t h e i r hours. Table 2b shows t h e r e s u l t s f o r employees who cannot vary t h e i r hours.
2.7
C l a s s i f i c a t i o n of curves2.7.1 I n c l a s s i f y i n g t h e curves i n t o t y p e s , t h e r e a r e two a t t r i b u t e s t o be considered, corresponding t o t h e two parameters
B
& a . The f i r s t a t t r i b u t e i s t h e maximum slope of t h e curve, which i s determined by B and i s i n v e r s e l yproportional t o t h e standard d e v i a t i o n of t h e a r r i v a l time d a t a . The second a t t r i b u t e i s t h e p o s i t i o n of t h e curve on t h e time a x i s , which i s determined by a and i s d i r e c t l y r e l a t e d t o t h e mean of t h e a r r i v a l times.
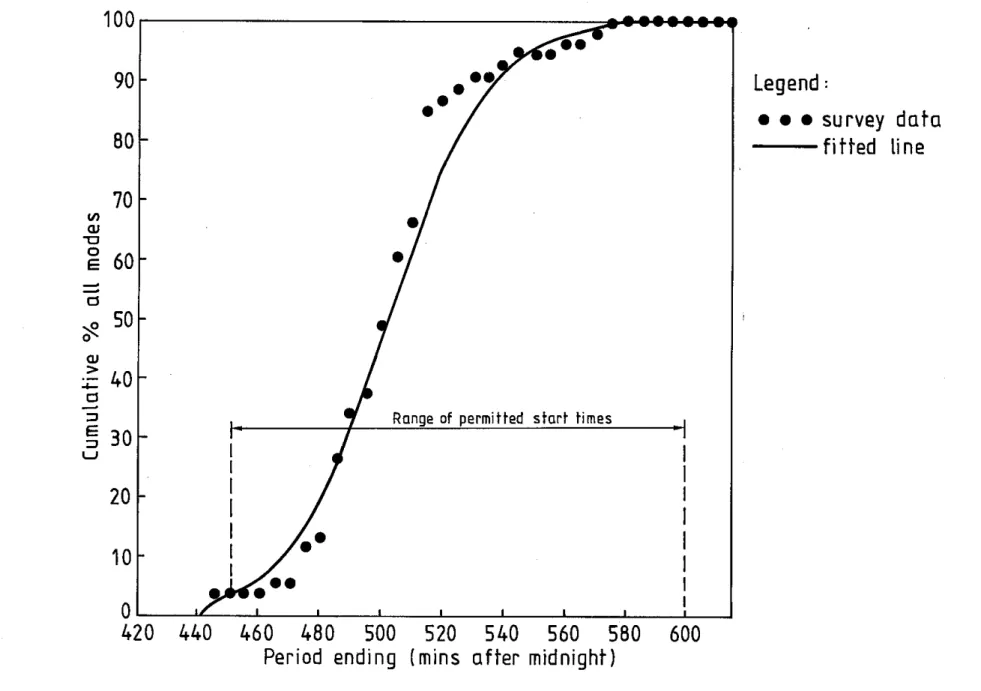
2.7.2 C l a s s i f i c a t i o n by SIC It had been thought from t h e s t a r t t h a t t h e r e would be some c o r r e l a t i o n between t h e type of t h e curve and t h e SIC of t h e
firm, and t h i s was t h e r e f o r e t h e f i r s t r e l a t i o n s h i p t o be examined.
Fig.
6
t h e n , shows t h e d i s t r i b u t i o n of B with SIC, f o r a l l mddes and f o r c a r s only. It i s obvious from t h i s t h a t t h e v a r i a t i o n within SIC'S i s a s much a s or g r e a t e r t h a n t h e v a r i a t i o n between them, i . e . t h e r e is no d e t e c t a b l e r e l a t i o n s h i p between SIC and 8.The next s t a g e was t o look a t t h e c o r r e l a t i o n between SIC and a.
I n f a c t r a t h e r than a we examined t h e mean a r r i v a l time, determined from Stage 1 surveys f o r firms on f i x e d o r staggered hours, o r Stage 2 surveys f o r those on f l e x i b l e hours. (The reason f o r ex-ningmean a r r i v a l times r a t h e r than a was t o i n c r e a s e t h e amount of d a t a f o r comparison
-
a & B parameters were only obtainable f o r t h o s e d a t a s e t s where s u f f i c i e n t Stage 2 responses had been obtained t o c a l i b r a t e a curve).Fig.
7
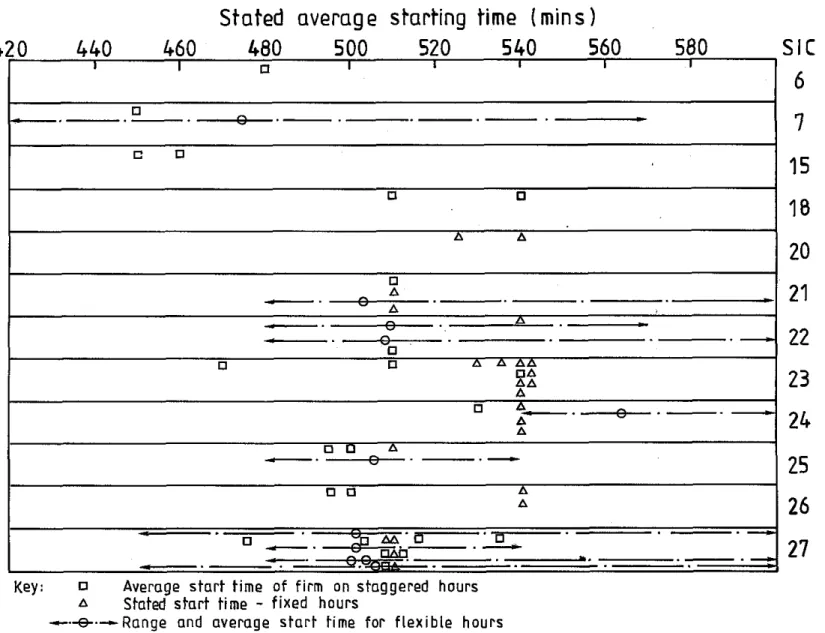
t h e r e f o r e shows t h e r e l a t i o n s h i p between SIC and mean a r r i v a l time, and f r o m t h i s it can be seen t h a t t h e r e i s i n f a c t a degree of-
1 4
-
TABLE
1.Results of f i t t i n g LOGIT curves t o f i r m s ' a r r i v a l p r o f i l e s NB. Curve formula i s y = 1 0 0 / ( 1
+
e-@(x-"));
,
= tirneTABLE 2.
Results of f i t t i n g LOGIT curves t o f i r m s ' a r r i v a l p r o f i l e s
-
s p l i t according t o employee's a b i l i t y t o vary hours o r notNB Curve formula i s y = 100j(l
+
eStated average starting time (mins
1
-.
-.
.-.
.-.
C-.
27
Key: Average s t a r t time of firm on staggered hours
A Stated s f a r t time
-
fixed hours-.+.--Range and average s t a r t time for f l e x i b l e hours
42 0
440
460
480
500
520
540
560
580
S I C
Fig. 7
Distribution of stated average arrival times ( a l l modes)
by
SIC
I I CI I I I
Hence, although t h e r e i s no evidence of a r e l a t i o n s h i p between SIC and
6 ( t h e shape of t h e curve) t h e r e does appear t o be a correspondence with t h e mean a r r i v a l time (hence a , t h e p o s i t i o n of t h e curve).
2.7.3 C l a s s i f i c a t i o n by s t a t e d work hour type It was t h e r e f o r e s t i l l
necessary t o f i n d a c l a s s i f i c a t o r y v a r i a b l e f o r 6, and t h i s was found i n t h e "type of work hours" a s s t a t e d by t h e firms i n t h e Stage 1 surveys. Work hours types included Fixed hours, F l e x i b l e hours, and Staggered hours
( t h e l a t t e r including r o t a t i n g s h i f t s , a category occurring i n only
5
firms). Fig. 8 i s a s c a t t e r g r a p h showing t h e c a l i b r a t e d a & 6 f o r each firm ( a l l modes). The symbols denote t h e dominant work hour t y p e i n each firm. (Note t h a t f o r those firms where no one t y p e i s dominant, i . e . t h o s e l i s t e d on Table 2 , t h e r e s u l t s f o r both types a r eFig. 9 shows t h e same b u t f o r c a r a r r i v a l s only.
It can be seen t h a t i n both graphs t h e points f a l l i n t o two groups, with f i x e d hour firms tending t o have 6 values i n a higher range than e i t h e r
f l e x i b l e o r staggered work hours firms.
Thus f o r a l l modes ( F i g . 8 ) t h e 6 value f o r f l e x i b l e / s t a g g e r e d hours firms l i e s between 1. 0.05 and 0.10 whereas t h e value f o r f i x e d hour firms
i s between 0.10 and 0.15. S i m i l a r l y f o r car a r r i v a l s , f l e x i b l e / s t a g g e r e d hours firms have a 6 from % 0.05 t o 0.09, with f i x e d hours ranging from
1. 0.08 t o 0.16.
The r e l a t i o n s h i p between s t a t e d work hours and a i s not s o d i s t i n c t , but t h e r e does appear t o be a tendency f o r t h e average s t a r t time of employees
on f l e x i b l e hours t o be e a r l i e r t h a n t h o s e on staggered, and f o r t h e l a t t e r t o be e a r l i e r than t h o s e on f i x e d hours. This i s a f u r t h e r t o p i c which would b e n e f i t from f u r t h e r study.
Hence it would appear t h a t t h e type of work hours, a s s t a t e d by t h e firms i n t h e Stage 1 surveys, can be used t o c l a s s i f y t h e 6 values.
2.7.4 Difference between c a r a r r i v a l s and all modes Referring back t o Table 1, an examination of t h e a parameter firm by firm shows t h a t i n 8 cases
a i s lower f o r ' c a r s only' than f o r ' a l l modes', and i n
6
cases it i s higher.Key
:
A
Fixed hours
0
Flexible
Staggered
0.15
0.10
'P
0.05
0 -
45
-
Key
:A
Fixed
hours
0
Flexible
0
Staggered
-
-
I I I I I I I I I I 1
0
46 0
47 0
480
490
500
510
520
530
540
550
560
a
This being t h e case, it becomes j u s t i f i a b l e t o u t i l i s e t h e p a t t e r n s f o r 'all modes' i n t h e model where i n s u f f i c i e n t d a t a had r e s u l t e d i n u n r e l i a b l e o r non-existent ' c a r s only' p a t t e r n s .
2.8 Extension t o firms not surveyed i n Stage 2
The purpose of c l a s s i f y i n g t h e curves a s described above i s of course s o t h a t reasonable estimates can be made of t h e a r r i v a l p a t t e r n s of t h o s e firms not surveyed. For t h o s e firms which have been surveyed i n Stage 2 ,
and f o r which p r o f i l e s a r e t h e r e f o r e a v a i l a b l e , t h e parameters c a l i b r a t e d f o r ' c a r s only' were used where a v a i l a b l e , otherwise t h o s e f o r ' a l l modes'
were used.
For t h o s e firms not surveyed i n Stage 2 , t h e following procedures-
were adopted.
1) Firms surveyed i n Stage 1
For t h e s e firms d e t a i l s of t h e work hourswereknown, and a could t h e r e f o r e be determined by r e f e r e n c e t o t h e s t a t e d average a r r i v a l time. The p o s s i b l e range of
0
f o r each firm was determined on t h e b a s i s of t h e s t a t e d work hours t y p e , and w i t h i n t h a t range t h ea c t u a l choice of 8 was taken randomly from t h e observed
d i s t r i b u t i o n of 8 ' s .
2 ) Firms not surveyed i n Stage 1, within t h e c e n t r a l a r e a
The SIC'S of t h e s e firms i s known, and t h i s was t h e r e f o r e used t o determine t h e p o s s i b l e range of a. Again t h e a c t u a l choice was. made randomly from t h e observed d i s t r i b u t i o n of a w i t h i n t h e range.
The choice of
0
f o r firms i n t h i s group i s more of a problem a s t h e i r work hour types a r e not known. The procedure a d o p t e d w e s t o go through t h e l i s t examining each f i r m i n d i v i d u a l l y , and f i r s t l y a l l o c a t e awork hour t y p e t o each f i r m f o r which t h e choice i s f a i r l y s t r a i g h t - forward (e.g. f i x e d hours f o r small shops, schools, f l e x i b l e / s t a g g e r e d hours f o r l o c a l government o f f i c e s ) ; and then t o a l l o c a t e t h e remainder by randomly sampling t h e observed d i s t r i b u t i o n of work hour t y p e s .
(This ensures t h a t t h e f i n a l estimated d i s t r i b u t i o n of work hour types among firms i s approximately t h e same a s t h a t surveyed.)
3) Firms not surveyed i n Stage 1, intermediate a r e a
It i s not necessary t o have individual p r o f i l e s f o r firms i n t h e
intermediate a r e a , a s t h e t e s t s t r a t e g i e s a f f e c t only c e n t r a l a r e a firms. It i s s u f f i c i e n t t h e r e f o r e t o have only one o v e r a l l p r o f i l e f o r t h e whole intermediate a r e a , and i n t h e absence of contrary information i t w a s assumed t h a t t h e o v e r a l l a r r i v a l p r o f i l e s of t h e c e n t r a l and intermediate a r e a s a r e s i m i l a r . Thus t h e o v e r a l l a r r i v a l p r o f i l e f o r t h e c e n t r a l a r e a a s obtained i n 1 & 2 above
was applied t o t h e intermediate a r e a a s a whole.
3.
MATRIX DISAGGREGATION3.1 I n t r o d u c t i o n
This chapter d e s c r i b e s t h e methods by which t h e morning peak o r i g i n d e s t i n a t i o n matrices obtained from t h e WYTCONSULT Surveys of 1975 were
updated and disaggregated by purpose and by time. The process i s summarised
i n Fig. 1 0 .
3.2 0-D d a t a a v a i l a b l e
The b a s i c source of o r i g i n - d e s t i n a t i o n d a t a i s t h e WYTCONSULT surveys
of 1975. 0-D matrices were produced f o r Wakefield by c a l i b r a t i n g a g r a v i t y model a g a i n s t t r i p s observed a t roadside interview s t a t i o n s , on a cordon
drawn round t h e former Wakefield CB area. These matrices a r e f o r t h e morning peak period (7.45
-
9.15 a.m. ) i n 1975, disaggregated by purpose(HEW, HBO, NHB, EDUC, HGV & LGV) on a 129 zone zoning system.
3.3 Zoning, network and cordons
3.3.1- The 129 zone system used i n WYTCONSULT i s t o o f i n e i n t h e outer zones f o r our purposes, a s we only r e q u i r e t o know by which r o u t e s t r a f f i c approaches t h e c e n t r a l a r e a . For t h i s reason, a 32 "zone" system was used, c o n s i s t i n g of 21 WYTCONSULT zones covering t h e c e n t r a l a r e a of ~
Wakefield, and 11 " r o u t e zones" by which all e x t e r n a l t r a f f i c e n t e r s t h e network. It should be noted t h a t t h e s e "route zones" a r e not simply aggregations of WYTCONSULT zones, but r a t h e r t h e t r i p s to/frorn them were obtained by a cordon i s o l a t i o n procedure, i . e . by running an assignment on t h e 129 zone system and recording t h o s e t r i p s passing through each "route
zone".
Thus a 32 x 32 zone 0-D_,matrix was obtained i n which only t h o s e
Roadside i n t e r v i e w surveys on
1. cordon surrounding Wakefield CB
(w.Y.T.s. 1975) d
W.Y.T.S. O'-D Matrix 1975 3. 7.45
-
9.15, 129 zonesI
Link i s o l a t i o n
-
assignment t o I3l.Y.T.S. - network
Other
C V
*
mw
0-D Matrix 1975
9.15, 32 zones
P
Growth f a c t o r s 75
-
8 3
Veh.
-
P.C.U. f a c t o r sI
OtherCV
+
m\r
c
I
0-D Matrix, 1975 f a c t o r e d t o 801
1
2
,
0 "
1
7 . 4 5 - 9 . 1 5 , 32 zones Counts on+
o u t e r cordonI
T o t a l 0-D N a t r i x1
I7.
1975 f a c t o r e d t o 807.45
-
9.15, 32 zones1
I
I
F u r n e s s 4
f
Counts on v a r i o u s1
network l i n k s . (1 h r Furnessed 0-D Matrix 1980 f a c t o r e d t o 12 h r s ) 7.45-
9.15, 32 zonesC o r r e c t Row/col. t o t a l s
I
I
.I#
Updated 0-D Matrix 1980
7.45
-
9.15, 32 zones%
HBW e t c by elementc
I, , :: Otlher
I C V
V HBW
had simply been aggregations of t h e o r i g i n a l zones, t h e n t r i p s from say 10 miles n o r t h of Wakefield t o say
5
miles south, would have been included and hence assigned t o t h e SATURN network, whereas i n f a c t t h e y would most probably avoid t h e Wakefield a r e a a l t o g e t h e r by using t h e M l . )3.3.2 Network The network used f o r t h i s study i s based on, but d i f f e r e n t from, t h e WYTCONSULZ network. It covers t h e c e n t r a l a r e a of Wakefield from Leeds Road/Bradford Road i n t h e North t o Chantry Bridge i n t h e South,
and from Westgate End i n t h e West t o Peterson Road/Jacob's Well Lane i n t h e East. Link l e n g t h s and speeds wire provided by WYCC and t h e network was coded by a postgraduate student i n t h e I n s t i t u t e a s p a r t of h i s M.Sc. d i s s e r t a t i o n p r o j e c t (Yip 1980).
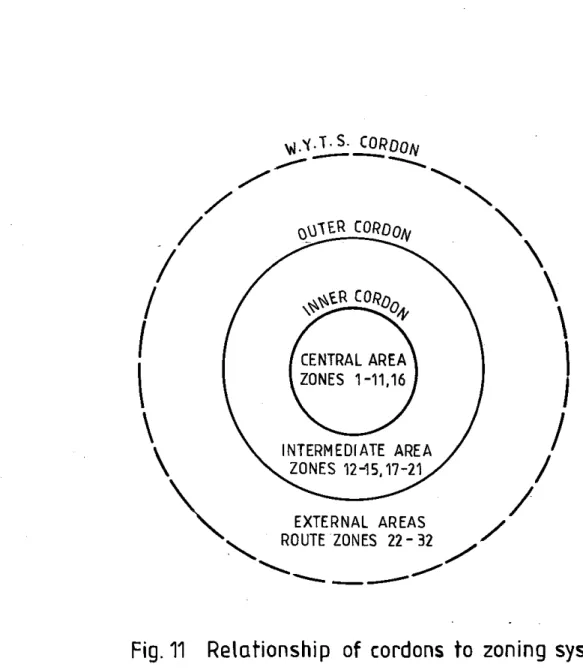
3.3.3 Cordons There a r e two cordons p e r t a i n i n g t o t h i s model a s shown i n Fig. 11. The f i r s t i s t h e o u t e r cordon mentioned i n 3.3.1 above, defined
by t h e l i m i t s of t h e SATURN network which encloses zones 1-21. The second o r i n n e r cordon defines t h e CBD or town c e n t r e of Wakefield, where t h e
bulk of o f f i c e workers a r e employed, and which i s t h e most l i k e l y a r e a
within which Work Journey Rescheduling (WJR) s t r a t e g i e s could be implemented.
I n l o c a t i n g t h e p r e c i s e p o s i t i o n of t h e inner cordon, t h e following points were considered important.
1) As f a r a s p o s s i b l e t r i p s should pass around r a t h e r t h a n through t h i s cordon. This f e a t u r e makes t h e p r o f i l e s obtained from cross-
.
cordon flows more u s e f u l , and was achieved by keeping t h e cordon j u s t i n s i d e t h e main i n n e r r e l i e f roads.2 ) The number of roads c r o s s i n g t h e cordon should be a s few a s
p o s s i b l e t o reduce d a t a c o l l e c t i o n time and c o s t . There a r e eleven crossing p o i n t s here.
3) The cordon should be c a r - t i g h t , i . e . t h e r e should be no uncounted minor roads, back l a n e s e t c .
4)
The a r e a enclosed by t h e inner cordon should, a s f a r a s p o s s i b l e , contain t h e m a j o r i t y of workplaces amenable t o WJR, and exclude a s f a r a s p o s s i b l e t h o s e workplaces which a r e not so amenable, and a l s o non-workplaces. The chosen cordon t h e r e f o r e excludes t h eheavy i n d u s t r i a l a r e a south of Ings Road and t h e River Calder (zones 1 9 , 20, 21) and t h e predominantly r e s i d e n t i a l a r e a s t o t h e n o r t h , e a s t and west of t h e c e n t r a l area.
,,J.Y.T.S. C O R D O ~
--
CENTRAL AREA
INTERMEDIATE AREA
EXTERNAL AREAS ROUTE ZONES 22- 32
The following paragraphs describe t h e r e l a t i o n s h i p of each of t h e s e a r e a s t o t h e network and consequently t o t h e survey methods r e q u i r e d t o model t h e e f f e c t t h a t work journeys t o t h e s e a r e a s h a v e o n congestion i n t h e network.
3.3.3.1 Central a r e a Because t h e c e n t r a l a r e a i s s u b j e c t t o WJR s t r a t e g i e s ,
it i s necessary t o model with reasonable accuracy t h e present work journey
a r r i v a l p a t t e r n s i n t h a t a r e a , i n order t o make s e n s i b l e comparisons between base and t e s t conditions. Thus it was attempted t o c a r r y out surveys of every employer i n t h e c e n t r a l a r e a employing more t h a n
1 5
people, t o o b t a i n up- to-date d e t a i l s of t h e number and type of employees, and c u r r e n t workschedule arrangements. Additionally, a sample of firms was c i r c u l a t e d with
employee q u e s t i o n n a i r e s , i n order t o o b t a i n t h e c u r r e n t modal s p l i t and times of a r r i v d . The information obtained from t h e employee surveys was
expanded by means of t h e employer surveys and o t h e r d a t a t o produce a
histogram o r p r o f i l e of a r r i v a l times by c a r f o r each f i r m . These p r o f i l e s were then added (weighted by t h e number of employees) t o o b t a i n a r r i v a l p r o f i l e s by zone ( s e e Chapter 2 ) .
3.3.3.2 Intermediate a r e a 'Fne intermediate a r e a between t h e two cordons would not be s u b j e c t t o W J R s t r a t e g i e s , but t r a f f i c g e n e r a t e d / a t t r a c t e d t h e r e does have a s t r o n g influence on congestion i n t h e network. Hence it
was thought u s e f u l t o c a r r y out some employer/employee surveys i n t h i s a r e a , but a lower sample f r a c t i o n t h a n i n t h e c e n t r a l a r e a was used.
3.3.3.3 External a r e a Because of t h e extent of t h e e x t e r n a l a r e a , i t s c o n t r i b u t i o n t o network congestion i s l i k e l y t o be much more evenly spread over time t h a n t h e c e n t r a l and intermediate areas. It i s not intended nor indeed would it be p r a c t i c a b l e , t o survey t h e a r r i v a l times of firms i n t h i s a r e a , and i n any case a s w i l l be seen l a t e r t h e p r o f i l e s of t r a f f i c a t t r a c t e d t o e x t e r n a l zones can be obtained f r o m t r a f f i c counts alone.
3.4
Modifying t h e i n i t i a l 0-D matricesReferring again t o Fig.10, t h e d e r i v a t i o n of t h e i n i t i a l 32 zone
matrix ( ( 4 ) i n ~ i10) ~h a s already been described. . There a r e i n f a c t 3 such matrices, f o r
HBW
p r i v a t e v e h i c l e s , CV's and a l l o t h e r (non-bus ) vehicles. A l l t h e s e matrices of course r e f e r t o 1975 AM peak period flows, and it i s t h e r e f o r e necessary t o modify them t o 1980 flows before they can be used i n t h e model along with 1980 employment surveys, t r a f f i c counts e t c .-. .
1) The a p p l i c a t i o n of o v e r a l l growth f a c t o r s t o each matrix t o
account f o r o v e r a l l t r a f f i c growth from 1975 t o 1980 and t o
convert from v e h i c l e s t o PCUs
( ( 6 )
Fig. 1 0 ) .2 ) After adding t h e t h r e e m a t r i c e s t o form a t o t a l PCU matrix, t h e a p p l i c a t i o n of t h e liurness technique t o make t h e row and column t o t a l s f o r t h e r o u t e zones agree with t h e measured 1980 flows on t h o s e r o u t e s ( ( 8 1 Fig. 1 0 ) .
31 The a p p l i c a t i o n of t h e UPDATE program a s s o c i a t e d with SATURN,
which modifies t h e matrix elements within t h e given row and
column t o t a l s so t h a t , when assigned t o t h e network, t h e r e s u l t i n g flows agree w i t h measured l i n k flows ( ( 9 1 Fig. 1 0 ) .
The o u t e r cordon counts applied in ( 2 ) were f o r t h e 1; hour period
7.45
-
9.15 ( i . e . t h e period covered hy t h e 0-D m a t r i x ) . These counts wereaggregations of t h e
5
minute counts conducted i n November 1980.The counts used in t h e UPDATE process were ohtained mainly from
bTYCC. These counts were c a r r i e d out i n v a r i o u s months and y e a r s , and factored t o 1980 by r e f e r e n c e t o long-term automatic count d a t a . They each
r e f e r t o t h e peak hour, so t h a t before t h e y could he used i n t h e UPDATE program t h e m a t r i c e s had t o he f a c t o r e d down t o 1 hour v a l u e s and suh-
sequently f a c t o r e d back t o a 1; hour matrix using t h e 1980 r a t i o of 1;
hour f l o w / l hour flow a t t h e i n t e r n a l cordon.
The UPDATE. p r o c e s s can be c a r r i e d out a t present o n l y on t h e
0-D matrix, and not on s e l e c t e d purpose sub-matrices. This i s because t h e
process involves running t h e simulation and assignment s t a g e s of SATURN t o determine t h e p a t h s taken from each o r i g i n t o d e s t i n a t i o n , and t h i s i s
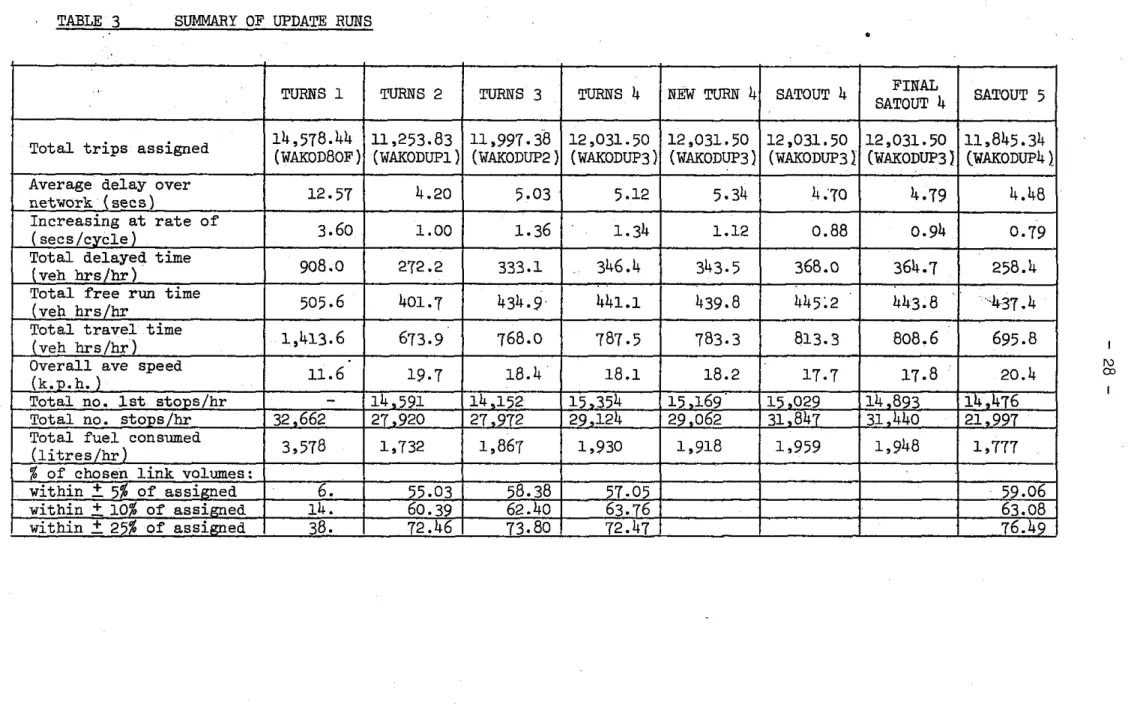
obviously dependent on t h e - t r a f f i c using t h e network. Tahle 3 shows
t h e r e s u l t s of t h e updating process i n summary.
3.5 Required form of d a t a
In this study we a r e t e s t i n g t h e e f f e c t of rescheduling work times
in t h e c e n t r a l a r e a of Wakefield, and a r e looking only a t t h e e f f e c t on t h e
1; hour morning peak period. Thus o n l y t h e hatched a r e a s of t h e home-hased- m r k matrix on Fig. 12 ( i . e . t h e journey t o work
-
in t h e c e n t r a l a r e a l a r e d i r e c t l y a f f e c t e d by t h e t e s t s t r a t e g i e s . Trips i n t h e other p a r t s o f t h e home-based-work matrix, and t h e o t h e r purpose matrices may be i n d i r e c t l yTABLE
3
SUMMARY OF UPDATE RUNSNote: shaded cells are potentially affected by W J R
The t r i p s made during t h e a.m. peak t h e r e f o r e f a l l i n t o t w o groups
1. Those which can be d i r e c t l y a l t e r e d by rescheduling s t r a t e g i e s .
2. Those which a r e a f f e c t e d o n l y i n d i r e c t l y .
When disaggregating t h e t o t a l o r i g i n - d e s t i n a t i o n matrix (obtained a s i n
Section 3 . 4 ) i n t o d i s c r e t e time s l i c e s , it i s t h e r e f o r e , necessary t o keep
t h e s e t w o groups separated.
What we r e q u i r e t h e n i s ( 1 ) a s e t of 0-D m a t r i c e s f o r home-based-work
t r i p s t o t h e c e n t r a l a r e a , i n d i s c r e t e time s l i c e s covering t h e morning
peak period; ( t h e s e m a t r i c e s w i l l v a r y f o r d i f f e r e n t s t r a t e g i e s although
t h e t o t a l number of t r i p s f o r each 0-D p a i r a c r o s s a l l time s l i c e s w i l l
remain c o n s t a n t ) ( 2 ) a s e t of 0-D matrices covering a l l o t h e r t r i p s , f o r
t h e same time s l i c e s ( t h e s e m a t r i c e s w i l l remain f i x e d over a l l t e s t s ) .
3.6
Outline of disaggregation methodThere a r e two main s t a g e s i n p r e d i c t i n g t h e e f f e c t of t h e s t r a t e g i e s
being t e s t e d . These a r e f i r s t l y , t h e response t o t h e s t r a t e g y and secondly
t h e e f f e c t of t h a t response on t r a f f i c conditions.
I n t h e method described here, t h e response t o a s t r a t e g y i s not p a r t
of t h e model p r e d i c t i o n procedure, but i n s t e a d i s p a r t of t h e input t o
t h e model, In other words, t h e response f o r each workplace ( i n terms of
t h e a r r i v a l p r o f i l e s r e s u l t i n g from p a r t i c u l a r work schedules) i s determined o u t s i d e t h e model, based on surveys of t h e a r r i v a l p r o f i l e s of s i m i l a r f i r m s
on s i m i l a r schedules. The production of t h e s e p r o f i l e s was described i n
some d e t a i l in Chapter 2 , but here we a r e discussing only t h e manner i n
which t h e p r o f i l e s and o t h e r d a t a were used t o temporally disaggregate
t h e t o t a l 0-D matrix.
One o r t w o c a v e a t s should be mentioned with regard t o t h e method
described. F i r s t l y , SATURN does not process groups of v e h i c l e s over l i n k s
i n t h e network i n t h e way t h a t say CONTRAM would do. Rather, a l l t r i p s
in one 0-D time s l i c e a r e assumed t o be loaded on t o t h e network uniformly
during t h a t time s l i c e . Moreover, t h e time s l i c e i n which any t r i p f a l l s
is assumed t o depend on e i t h e r t h e a r r i v a l time a t t h e workplace ( f o r work
t r i p s destined f o r t h e c e n t r a l and intermediate a r e a s ) o r t h e cordon
crossing time otherwise. Hence in t h i s method t h e l e n g t h of t h e time s l i c e s should not be l e s s than t h e average journey time a c r o s s t h e network.
matrices depends on t h e i n n e r cordon being l o c a t e d such t h a t t h e majority of "throughtt t r i p s pass around it r a t h e r than through it.
Section
3.4
described how t h e updated t o t a l 0-D matrix ( ( 9 ) of Fig. 1 0 ) was obtained. The r e s t of t h i s s e c t i o n describes i n a u t l i n e t h e r e s t of t h e method from t h a t s t a g e . The following four s e c t i o n s w i l l then d e s c r i b eeach s t a g e i n more d e t a i l .
Referring again t o Fig.10, t h e next s t a g e i s t o disaggregate t h e
t o t a l matrix
( 9 )
i n t o t h r e e matrices by purpose. It i s necessary t o separate t h e HEiW matrix because we wish t o disaggregate it i n d i f f e r e n tways f o r d i f f e r e n t t e s t s . It i s not s t r i c t l y necessary t o separate t h e commercial v e h i c l e matrix, but f a i l u r e t o do so i s l i k e l y t o l e a d t o
l o s s of accuracy, due t o t h e d i f f e r e n t shape of t h e t r i p - t i m e p r o f i l e of CVs compared t o o t h e r t r a f f i c .
Having obtained t h e s e 0-D matrices f o r t h e peak period, t h e next
s t a g e i s t o disaggregate them i n t o time s l i c e s of 1 5 minutes. F i r s t l y , home based work t r i p s with d e s t i n a t i o n s i n t h e c e n t r a l o r intermediate a r e a s
a r e disaggregated by a p p l i c a t i o n of t r i p - t i m e p r o f i l e s obtained from f i r m s t surveys, by d e s t i n a t i o n zone. Secondly t h e commercial v e h i c l e t r i p matrix i s disaggregated by a p p l i c a t i o n t o t h e matrix a s a whole of t r i p - t i m e p r o f i l e s obtained from cordon counts of CVs. (Note t h a t CVs a r e t h e only
11
purpose" group, capable of being s e p a r a t e l y i d e n t i f i e d from cordon c o ~ y l t s . ) Thirdly t h e remaining p a r t s of t h e 0-D matrix ( i . e .
HBW
t r i p s with e x t e r n a l d e s t i n a t i o n s , o t h e r home-based, non-home based and education trips), a r e t r e a t e d a s one, and disaggregated by means of a combination of cordon count p r o f i l e s and f i r m s ' surveys.3.7 Disapuregatinu t h e t o t a l 0-D matrix by purpose
To c a r r y out t h i s process, it i s assumed t h a t t h e purpose s p l i t f o r each 0-D p a i r i s t h e same i n 1980 a s it was i n 1975.
i . e . t h a t T . .
80
T . .75
where p denotes purpose.-u.F! = 3
T . . 80
75
L J T i j
Hence t o o b t a i n t h e 1980 m a t r i x f o r purpose p we simply f a c t o r each element
This process maintains t h e same t o t a l number of t r i p s i n each 0-D p a i r , hence t h e UPDATE previously c a r r i e d out i s not i n v a l i d a t e d . It would not of course be a b l e t o d e a l properly with cases where major l a n d use changes have a l t e r e d t h e purpose s p l i t between zonal p a i r s . Table
4
shows t h e o v e r a l lr e s u l t s of t h i s process, with t h e 1975 purpose s p l i t s f o r comparison.
-
3.8 Temporally d i s s g r e g a t i n ~ t h e HBW p r i v a t e matrix
Fig. 1 3 shows i n t a b u l a r form t h e 9 p a r t s o f t h e KBW p r i v a t e v e h i c l e
matrix and t h e nine p a r t s of t h e "other" p r i v a t e v e h i c l e matrix (CVs not included). This s e c t i o n describes t h e procedure used f o r disaggregating t h e f i r s t s i x p a r t s of t h e HBW matrix, i . e . t h o s e with d e s t i n a t i o n i n t h e c e n t r a l o r intermediate a r e a s .
A s already mentioned, t h e s t r a t e g i e s t o be t e s t e d applied only t o firms i n t h e c e n t r a l a r e a , and t h e r e f o r e it was not necessary t o have a r r i v a l p r o f i l e s ?or i n d i v i d u a l firms i n a r e a s o u t s i d e t h e c e n t r e . For HBW t r i p s t o intermediate a r e a d e s t i n a t i o n s t h e r e f o r e , one a r r i v a l p r o f i l e was e s t a b l i s h e d f o r t h e whole a r e a , t h i s being t h e same a s t h e aggregate p r o f i l e f o r a l l c e n t r a l a r e a firms.
Once p r o f i l e s had been obtained or estimated a s described i n Chapter
2 , they were added t o g e t h e r on a zonal b a s i s , weighted by t h e number of employees i n each f i r m a r r i v i n g by c a r . Then, by assuming t h a t t h e p r o f i l e s of firms employing l e s s than 1 5 (which i n 1976 accounted f o r
25%
of t o t a lemployees i n t h e c e n t r a l a r e a ,
6%
intermediate) a r e not s u b s t a n t i a l l y d i f f e r e n t from t h o s e employing more, t h e s e zonal a r r i v a l p r o f i l e s were applied t o t h o s e p a r t s of t h e HBW matrix with d e s t i n a t i o n s i n t h e c e n t r a l and intermediate areas. The zonal a r r i v a l p r o f i l e s were a p p l i e d byd e s t i n a t i o n zone, by applying a f a c t o r H t o each element i n t h e column t where
t+L+A t
j r ( t )tit
TABLE
4
1975 and 1980
0-DMatrices (7.45-9.15
am) byPurpose
PURPOSE
CV
HBW
OTHER
TOTAL
1975
%
1 8
5 3
29
100
1980
UP DATE%
19
51
30
100
TRIPS
3151
8301
4942
Fig. 1 3 Relationship of cordon flows
t o p a r t s of t h e matrix ( p r i v a t e veh.
t r b )1 2
3
4
5
6
7 8w
X Trips i n t e r c e p t e d i n f u l l by t h e given cordon.
A t = l e n g t h of time s l i c e
n = no of time s l i c e s over t h e period of t h e t o t a l 0-D matrix
f ( t ) = t h e a r r i v a l p r o f i l e function
L = time l a g
The time l a g L i s t o account f o r t h e d i f f e r e n c e between t h e time a t which v e h i c l e s t r a v e r s e t h e cordon, and t h e ( l a t e r ) time a t which t h e
occupants of t h o s e v e h i c l e s a r r i v e a t work. It i s an average f i g u r e , obtained from surveyed network times as
5
minutes.3.9
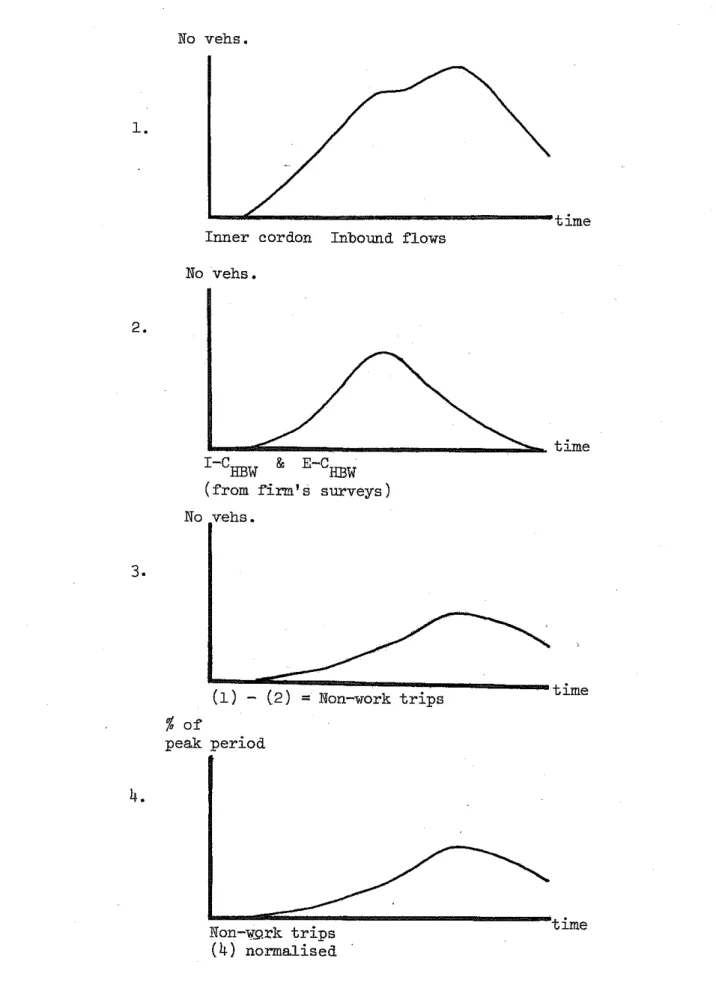
Temporally disaggregating t h e "other" p r i v a t e v e h i c l e matrixThis s e c t i o n d e a l s with t h e method f o r dealing with t h e remaining t h r e e p a r t s of t h e HBW matrix ( t r i p s with e x t e r n a l d e s t i n a t i o n s ) and a l l o t h e r p r i v a t e v e h i c l e t r i p s combined. Fig. 1 3 , c o l .
4,
shows t h e p a r t s which have t o be disaggregated and c o l . 2 shows t h e number of t r i p s i n each p a r t (only those t r i p s which t r a v e r s e p a r t of t h e SATURN network a r eincluded). Cols.
5
t o8
show t h e p a r t s of t h e matrix which a r e i n t e r c e p t e d by each of t h e two cordons, i n each d i r e c t i o n . It can be seen t h a t t h eouter cordon outbound ( c o l .
8 )
i n t e r c e p t s a l l t h e remaining p o r t i o n of t h e HBW matrix, t h e equivalent p a r t s of t h e "other" matrix, and nothing e l s e . Hence p r o f i l e s obtained from outbound flows a t t h e o u t e r cordon can beapplied d i r e c t l y t o t h e sum of t h e s e s i x p a r t s ( i . e . a l l t r i p s with e x t e r n a l d e s t i n a t i o n s ) .
To avoid problems caused by r o u t e choice, t h e cordon flows were added t o produce one p r o f i l e , which was applied t o t h e sum of t h e s i x p a r t s
uniformly ( i . e . one f a c t o r per time s l i c e ) .
Note t h a t a s we a r e not using t h e cordon flows i n terms of a b s o l u t e numbers, b u t r a t h e r a r e looking a t t h e r e l a t i v e flows a t d i f f e r e n t times i n t h e peak period, it i s not necessary t o have a completely " c a r - t i g h t "
cordon, i . e . no harm w i l l be caused by leakages through minor uncounted roads. (This i s not so f o r t h e i n n e r cordon a s w i l l be shown l a t e r . )
There t h e r e f o r e remain t o be disaggregated, t h o s e p a r t s of t h e "other" matrix with c e n t r a l and intermediate a r e a d e s t i n a t i o n s . As can be seen, no cordon matches t h e s e flows p a r t i c u l a r l y w e l l , ( a p e r f e c t match being where t h e flows t o be s p l i t a r e counted, and no o t h e r flows a r e counted.) However it i s p o s s i b l e because of t h e l o c a t i o n of t h e i n n e r cordon ( i n s i d e t h e inner r e l i e f roads) and t h e r e l a t i v e number of t r i p s i n each p a r t of t h e matrix, t o use t h e i n n e r cordon inbound flows i n conjunction with p a r t s of
-
36-
Fig.
1 4
Production of p r o f i l e f o r a p p l i c a t i o n t o "OTHER" p r i v a t e veh.matrix.No vehs.
No vehs.
I-'HBW & E-C HBW
(from firm's surveys)
3.
time
%
ofpeak p e r i o d
4.
Non-wgrk t r i p s time